Preparation of bulk AgNWs/PEDOT:PSS composites: a new model towards high-performance bulk organic thermoelectric materials
Yuan Liua,
Zijun Songa,
Qihao Zhanga,
Zhenxing Zhoua,
Yijing Tanga,
Lianjun Wang*a,
Juanjuan Zhua,
Wei Luoa and
Wan Jiangab
aState Key Laboratory for Modification of Chemical Fibers and Polymer Materials, Donghua University, Shanghai 201620, P. R. China. E-mail: wanglj@dhu.edu.cn
bThe School of Material Science and Engineering, Jingdezhen Ceramic Institute, Jingdezhen 333000, China
First published on 13th May 2015
Abstract
A facile and effective approach is demonstrated to prepare high-performance bulk AgNWs/PEDOT:PSS thermoelectric composites. The thermoelectric properties of the samples with different AgNWs contents are investigated in detail. The results show that well-dispersed AgNWs in the bulk PEDOT:PSS can give rise to a much higher electrical conductivity without a noticeable decrease in Seebeck coefficient or increase in thermal conductivity, which suggests the achievement of decoupling and optimizing the electrical conductivity and Seebeck coefficient. Consequently, the maximum ZT is observed to be 340% larger than that of the pure PEDOT:PSS sample. Our work clearly proves that the introduction of AgNWs is a promising model to significantly improve the thermoelectric properties of bulk organic-based TE materials.
Introduction
Thermoelectric (TE) materials, a new type environmentally-friendly materials, which can convert waste heat into the electric energy, are now gathering people's attention.1,2 The efficiency of TE materials is determined by the ZT value, a dimensionless figure of merit defined by the eqn (1):
 | (1) |
Conducting polymers such as polyaniline, polythiophene and their derivatives have exhibited great potential as high-performance TE materials due to extremely low thermal conductivity (varies between 0.2 and 0.7 W m−1 K−1), easy synthesis and low cost.4–7 Among them, poly(3,4-ethylenedioxythiophene):poly(styrenesulfonate) (PEDOT:PSS) has the advantage of good processability, high stability and relatively excellent TE properties. Liu et al. reported a ZT = 1 × 10⁻² for the DMSO (dimethylsulfoxide) doped PEDOT:PSS film.8 Kim et al. reported an extremely-high ZT = 0.42 for PEDOT:PSS thin film, which is the highest reported value for organic TE materials.9 Bubnova et al. successfully reported PEDOT:PSS/Tos film with a high ZT of 0.25.4 Du et al. investigated a high electrical conductivity of 1295.21 S cm−1 for Bi0.5Sb1.5Te3/PEDOT:PSS film.10 However, most of the above studies about PEDOT:PSS focus on thin films, not bulk materials. It is true that in recent studies, film TE materials tend to show greater performance than bulk TE materials (both organic and inorganic) because thin films are easier to achieve special structures to control the transports of phonons and electrons.11–13 Especially for the organic TE materials, ordered structures will facilitate the electrical transports and exhibit better electrical properties.8,14–16 However, the problem is that many micro TE devices composed of thin films are generally difficult to fabricate and design. Many of them cannot create enough temperature difference across thin film of a few μm thick to convert energy thus still are invalid to the large-scale commercial applications.17–20 Although bulk TE materials now suffer from comparable low performance, there are plenty of rooms for them to make further improvement. Therefore, despite a high ZT has been obtained in thin film thermoelectric material, bulk TE materials which is compatible with commercially available TE devices will still be the major trend. Recently, Jiang et al. and Wang et al. reported the syntheses of bulk PEDOT:PSS TE materials, but the bulk PEDOT:PSS suffered from relatively lower electrical conductivity compared to the thin films.7,21 The thermoelectric properties of bulk PEDOT:PSS TE materials are by far lower than that of thin films. Furthermore, for many organic-based composites TE materials, the enhancement in electrical conductivity will also pay for the price of lower Seebeck coefficient at the meantime.21–23 All these problems have significantly restricted the application of organic TE materials. For this sake, an effective way for fabricating the high-performance bulk PEDOT:PSS-based organic TE materials has been developed by incorporating inorganic nanoparticles, nanotube or nanowire into a conducting polymer matrix.
Single-walled carbon nanotubes (SWCNT) has been reported by Moriarty et al. to be very helpful for promoting the electrical properties of PEDOT:PSS.24 Recently Coates et al. found Te nanowires/PEDOT:PSS film could exhibit higher electrical conductivity, Seebeck coefficient and a lower thermal conductivity than pure PEDOT:PSS. This unusual electrical behavior shows that low dimensional nanocrystal/polymer system can exhibit unique opportunity to optimize ZT via molecular and interfacial design in ways that impossible in many classical systems.3 Some newly raised research works have also demonstrated that nano-sized silver can obviously enhance the electrical conductivity of both organic and inorganic materials.21,23,25,26 Additionally, it has been proved that lower dimensional materials tend to achieve better TE performance over the higher dimensional materials mainly because the nanoscale materials can increase the phonon scatter effect so that to suppress the thermal conductivity, thus a higher ZT value.3,5,25,27–29 Silver nano-wires (AgNWs) as a typical one-dimensional nano-sized material, with higher electrical conductivity than SWCNT and many metals, is expected to greatly enhance the electrical properties of the organic TE materials without increasing the thermal conductivity at the meantime. Furthermore, AgNWs also have the advantage of easy synthesis, controllable aspect ratio and good dispersion in matrix. So it seems that AgNWs is a very promising choice to optimize both of the electrical properties and thermal conductivity of bulk PEDOT:PSS.
In this work, we propose a facile method to fabricate AgNWs/PEDOT:PSS bulk TE material for the first time. The as-prepared AgNWs/PEDOT:PSS composites powders were synthesized by cryogenic grinding (CG) and then consolidated by a Spark Plasma Sintering (SPS) system. The TE properties of all samples were investigated and the results show that samples well dispersed with AgNWs exhibited a much higher electrical conductivity than the pure bulk PEDOT:PSS, and consequently the maximum ZT value of AgNWs-dispersed PEDOT:PSS composites was found to achieve a four-times enhancement without sacrificing the Seebeck coefficient and thermal conductivity. This indicates the addition of AgNWs is an ideal way towards the high-performance bulk PEDOT:PSS TE materials.
Experimental section
Preparation of the AgNWs
All chemicals were obtained from Sinopharm Chemical Reagent Co., Ltd and used without any purification.Firstly, 10 ml ethylene glycol (EG) dispersed with 425.7 mg polyvinylpyrrolidone (PVP, K-30) was prepared and then 7 mg NaCl was added into the mixed solution. Secondly, the solution was poured into a three-necked round flask and heated at 170 °C. Then 5 ml EG dispersed with AgNO3 (108.7 mg) was added into the solution by an injection pump at a rate of 5 ml h−1. After that, the solution was heated for 1.5 h with magnetic stirring until the color shifted to opaque gray, indicating the presence of AgNWs.25 Finally, the solution was quenched into an ice-water bath and washed by acetone and ethyl alcohol to remove the PVP and EG and centrifuged at 9000 rpm for 20 min. The final AgNWs were dispersed into ethyl for further use.
Preparation of the AgNWs/PEDOT:PSS composites
The PEDOT:PSS solution was obtained from Sigma Aldrich (Orgacon™ N-1005), and came into use without any further treatment.Firstly, the as-prepared Ag nanowires dispersion solution was added into the PEDOT:PSS solution with different mass fractions (0 wt%, 5 wt%, 10 wt%, 15 wt%, 20 wt%, 25 wt%, 30 wt%) and mixed it by ultrasound and magnetic stirring for 6 hours. Secondly, the mixed solution was poured to pre-cleaned glass gardens and then dried into the film at 300 K. Then the film was washed by deionized water and ethanol for several times and dried at 360 K. After that, the composites film was scratched and grinded into the powders by a cryogenic grinding machine (SPEX SamplePrep 6770 Freezer/Mill, TECH-Knowledge International Co., California, U.S.A.). Samples containing different AgNWs mass fractions (0 wt%, 5 wt%, 10 wt%, 15 wt%, 20 wt%, 25 wt%, 30 wt%), plugs and impactor were embedded in a grinding vial, and the vial was precooled in the liquid nitrogen to make the samples brittle. The samples were ground into powders at −195.6 °C for 20 min. Finally, the as-milled AgNWs/PEDOT:PSS composites powders (0.3 g for each AgNWs concentration samples) were consolidated by spark plasma sintering (Dr Sinter 725, Japan). The powders of all samples were loaded into cylindrical carbon dies with an inner diameter of 10 mm, and consolidated into the pellets at 100 °C for a dwell time of 5 min under 50 MPa, the final samples were the cylinders with the mean size of diameter × thickness = 10 mm × 2.0 mm.
Characterization
The UV-visible absorption spectra were measured on LanbdaA35 spectrometer (USA) at room temperature. The purity of the each phase in the AgNWs/PEDOT:PSS composites was characterized by X-ray powder diffraction (XRD, Rigaku D/Max-82550PC, Japan) with Cu Kα radiation at 40 kV, 200 mA. The chemical structures of the as-prepared and SPSed PEDOT:PSS samples were investigated by Nicolet 8700 FTIR spectrometer. The spectra of FTIR was collected by the averaging of 32 scans ranging from 500 to 4000 cm−1. The field-emission scanning electron microscopy (FE-SEM, S-4800) was employed to study and observed the surface morphology of the bulk sample and the morphology of the pure AgNWs.As for the thermoelectric properties, all samples were measured in the temperature range of 300 K to 360 K. The thermal conductivity (κ) of the bulk sample was calculated through combining thermal diffusivity (a), heat capacity (Cp) with density (ρ) of the sample, according to the calculation:
| κ = a × Cp × ρ | (2) |
The thermal diffusivity was measured by a laser-flash system (LFA427; Netzsch Instruments, Selb, Germany), the samples are the cylinders with the mean size of diameter × thickness = 10 mm × 1.8 mm. The heat capacities were measured by Differential Scanning Calorimetry (Netzsch DSC 204 F1). The electrical resistance and Seebeck coefficient were characterized by Seebeck coefficient/electric conductivity measuring system (ZEM-3), the samples are the rectangles with the mean size of length × thickness × width = 8.5 mm × 1.6 mm × 3.3 mm. Then the Hall coefficient RH was carried out on a Hall measurement system (Lakeshore HMS-7700, USA) with a magnetic field of 5 G and an electrical current of 3 mA.
Results and discussion
Morphology characterizations
The as-prepared AgNWs are studied by UV-vis spectroscopy, as is shown in Fig. 1a. The two peaks appearing at 350 nm and 381 nm corresponds to the surface plasmon resonance (SPR) of the AgNWs.30 Through the FE-SEM image (Fig. 1b), it can be seen that the as-prepared AgNWs possess high quality and quantity. These nanowires have the average length of 2–4 μm and diameter of 60 nm.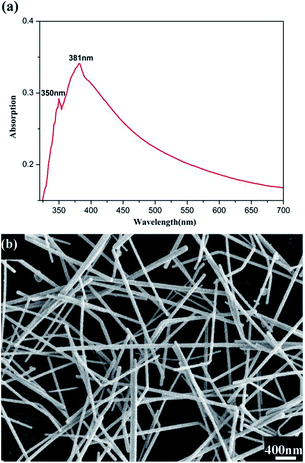 | ||
| Fig. 1 (a) UV-visible absorption spectrum of as-prepared AgNWs. (b) FE-SEM image of as-prepared AgNWs. | ||
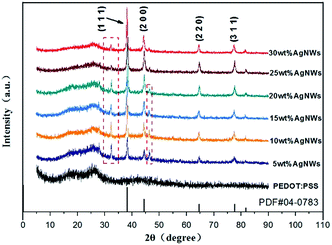
Fig. 2 shows the X-ray diffraction patterns of the AgNWs/PEDOT:PSS composites. The broad peak at 25° indicates the phase of PEDOT:PSS.31 The sharp peaks at 2θ values of 38.179°, 44.340°, 64.50°, 77.40°, 81.561° corresponding to (1 1 1), (2 0 0), (2 2 0) and (3 1 1), respectively, can be attributed to the pure phase of Ag (JCPDS file no. 04-0783), indicating the existence of Ag phase in the composites.23,32 The small peaks at 2θ values of 32° and 46° (marked by the red dashed square) can be attributed to the oxidized composites of Ag and Na, which probably formed during the preparation of AgNWs.25
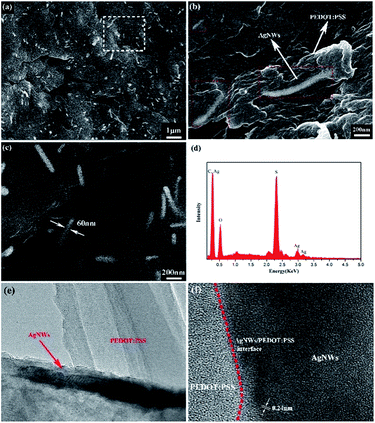
The FE-SEM micrographs of the AgNWs/PEDOT:PSS composites containing 20 wt% AgNWs are presented in Fig. 3. It is obvious that the AgNWs are well-dispersed in the PEDOT:PSS matrix according to the Fig. 3a. The red squared areas in Fig. 3b show the interface and junction between the embedded AgNWs and polymer matrix, confirming that the close connection between the AgNWs and molecule chains of PEDOT:PSS. In Fig. 3c, clearly that the diameter of dispersed AgNWs is about 60 nm, matching that of as-prepared AgNWs in Fig. 1b. Fig. 3d is the EDX pattern of the composites sample, showing the presence of major elements C, O, S and Ag, corresponding to the PEDOT:PSS matrix and AgNWs. This confirms that AgNWs survive in the matrix during the consolidation process. Fig. 3e clearly shows the a single AgNW is embedded in the PEDOT:PSS matrix (by HR-TEM image). And in its higher magnification HR-TEM image, as shown in Fig. 3f, the interplanar distance of 0.24 nm agrees with that of the (1 1 1) lattice planes of Ag, clearly proving the organic–inorganic interface between PEDOT:PSS matrix and AgNWs. Therefore, the results of XRD, FE-SEM and HR-TEM fully demonstrate the existence of AgNWs and their homogeneous dispersion in the PEDOT:PSS matrix, as well as the organic–inorganic interface between PEDOT:PSS and AgNWs.
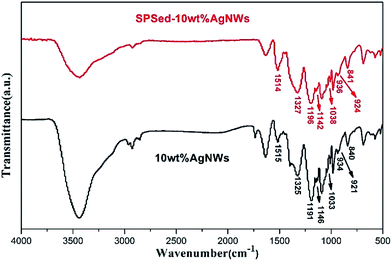
To investigate whether there exists any chemical changes during the consolidation process, we studied the FTIR spectra of the composite powders with 10 wt% AgNWs and its SPSed bulk sample. As shown in Fig. 4, the peak at 1325 cm−1 and 1518 cm−1 can be ascribed to the C–C and C![[double bond, length as m-dash]](https://www.rsc.org/images/entities/char_e001.gif) C stretching in the thiophene ring. Peak at 840 cm−1 is corresponding to the vibration mode of C–S bonds in the thiophene ring.33 The peaks at 1146 cm−1 and 1033 cm−1 are assigned to the stretching modes of ethylenedioxy group, and the peak at 921 cm−1 can be attributed to the ethylenedioxy ring deformation mode. The peak at 937 cm−1 and 1188 cm−1 are corresponding to –SO and S–OH stretching in the molecule of the PSS.34 From Fig. 4, there did not show any obvious changes compared to the as-prepared powders, implying no chemical changes happened during the SPS press process.
C stretching in the thiophene ring. Peak at 840 cm−1 is corresponding to the vibration mode of C–S bonds in the thiophene ring.33 The peaks at 1146 cm−1 and 1033 cm−1 are assigned to the stretching modes of ethylenedioxy group, and the peak at 921 cm−1 can be attributed to the ethylenedioxy ring deformation mode. The peak at 937 cm−1 and 1188 cm−1 are corresponding to –SO and S–OH stretching in the molecule of the PSS.34 From Fig. 4, there did not show any obvious changes compared to the as-prepared powders, implying no chemical changes happened during the SPS press process.
Thermoelectric properties
Measurements have been carried out to study the effect of different AgNWs contents (0 wt%, 5 wt%, 10 wt%, 15 wt%, 20 wt%, 25 wt%, 30 wt%) on the thermoelectric properties of PEDOT:PSS bulk samples. All samples were measured in the temperatures ranging from 300 K to 360 K. As can be seen in Fig. 5a, the electrical conductivity firstly increases as the AgNWs content increases. Then it reaches the maximum value of 84.84 S cm−1 for the composite with the AgNWs content of 20 wt%, finally slightly decreases with the continuous increase in the AgNWs content. It does not change too much with the increasing temperature, exhibiting the typical conducting polymer behavior.5,23,35,36 As is known, electrical conductivity is calculated by the eqn (3):| σ = neμ | (3) |
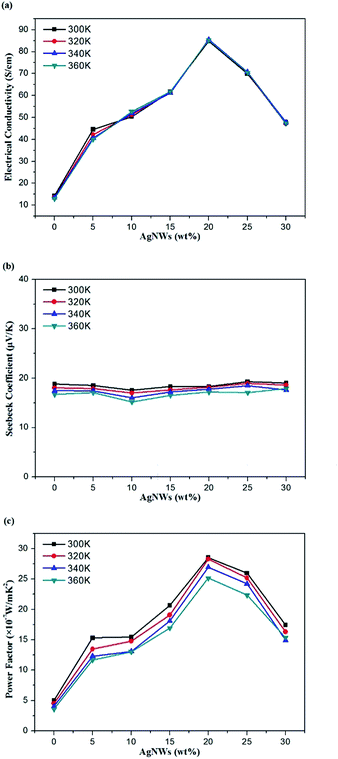 | ||
| Fig. 5 (a) Electrical conductivity (b) Seebeck coefficient (c) power factor of the composites with different AgNWs contents at different temperatures. | ||
In the conventional inorganic TE materials, it has been demonstrated that the Seebeck coefficient of the composites should follow the eqn (4):
 | (4) |
To clarify the electrical transport properties in the composites, we measured carrier concentration at room temperature by Hall measurement system. According to the Table 1, there is no obvious change in the carrier concentration with increasing AgNWs contents. Consequently, the carrier mobility is enhanced by almost five times with 20 wt% AgNWs addition. As is reported, the PEDOT:PSS is sensitive to the polymer morphology, and a highly-ordered structure is conducive to obtaining a high electrical conductivity.39,40 When AgNWs are embedded into the PEDOT:PSS matrix, it may create a kind of organic–inorganic interfaces (shown in Fig. 3b). This kind of interfaces will not only assist the PEDOT:PSS chains to exhibit a higher level of ordered structure than bulk PEDOT:PSS, but also provide more conductive paths between the PEDOT:PSS chains to facilitate the carrier transport as conducting bridges.3,15,41 Furthermore, the introduction of AgNWs may also reduce the carrier-hopping barriers, thus creating a much higher carrier mobility.22,42 When the content of AgNWs reaches 25 wt% and 30 wt%, the carrier mobility slightly decreases. This suggests that embedded AgNWs will not always increase the conducting paths, too many AgNWs may even impede the carrier transport. The carrier concentration of the composites is relatively unchanged, and that is why the Seebeck coefficient can keep its value with the increasing electrical conductivity. The embedded AgNWs may lead to the carrier filter effect, which is believed to hinder the transport of low-energy electrons across the organic–inorganic interfaces, and leaving the Seebeck coefficient insensitive to the changes in electrical conductivity and effectively decoupling these two properties.24,43,44 This indicates the reason why embedded AgNWs can improve the carrier mobility of the bulk composites while not change the level of the carrier concentration. Combining the values of Seebeck coefficient and electrical conductivity, the power factor increases from 5.03 × 10⁻⁷ W m K−2 to 28.55 × 10⁻⁷ W m K−2 at room temperature, achieving a five-time enhancement (as shown in Fig. 5c). Actually, some works even achieved the simultaneous enhancement in electrical conductivity and Seebeck coefficient before, such as the TeNWs/PEDOT:PSS thin film reported by Coates.3 And similar enhancements happen in the PANI system.15,38 All these works and results suggest that the low dimensional nano-sized materials can significantly optimize electrical transport properties of the conducting polymers matrix and lead to a new model to improve the power factor of organic TE materials.
| Samples PEDOT:PSS + x wt% AgNWs | Volume density (g cm−3) | Carrier concentration (1019 cm−3) | Carrier mobility (cm2 V−1 s−1) | Seebeck coefficient (μV K−1) |
|---|---|---|---|---|
| x = 0 | 0.929 | 10.25 | 0.85 | 18.8 |
| x = 5 | 1.205 | 10.34 | 2.73 | 18.5 |
| x = 10 | 1.225 | 14.02 | 2.24 | 17.6 |
| x = 15 | 1.280 | 11.01 | 3.48 | 18.4 |
| x = 20 | 1.375 | 11.50 | 4.57 | 18.3 |
| x = 25 | 1.393 | 9.85 | 4.43 | 19.3 |
| x = 30 | 1.552 | 9.94 | 3.01 | 19.0 |
Fig. 6a shows temperature-dependent thermal conductivity with different AgNWs contents. The thermal conductivity increases with increasing temperatures because of the increasing Cp of the samples. Interestingly, we find κ does not raise too much with increasing AgNWs contents. It changes from 0.257 W m−1 K−1 to 0.356 W m−1 K−1, and the average value of thermal conductivity still remains at low level of 0.3 W m−1 K−1 at room temperature, which is very close to that of pure PEDOT:PSS.22 Generally, the thermal conductivity of the materials is determined by two parts: electronic thermal conductivity (κe) and lattice thermal conductivity (κL). According to the Wiedemann–Franz law:
| κe = LσT | (5) |
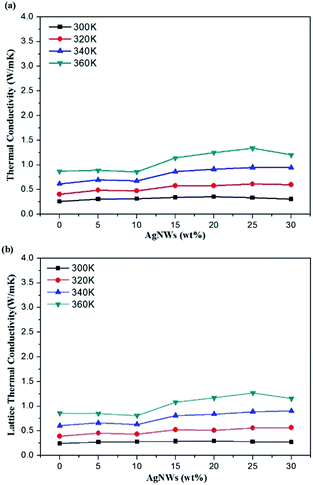 | ||
| Fig. 6 (a) Thermal conductivity of the composites with different AgNWs contents at different temperatures. (b) Lattice thermal conductivity of the composites with different AgNWs contents. | ||
| Samples PEDOT:PSS + x wt% AgNWs | Thermal diffusivity (mm2 s−1) |
|---|---|
| x = 0 | 0.220 |
| x = 5 | 0.201 |
| x = 10 | 0.181 |
| x = 15 | 0.159 |
| x = 20 | 0.178 |
| x = 25 | 0.169 |
| x = 30 | 0.143 |
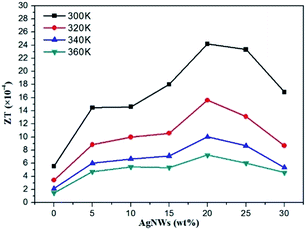
The ZT of the samples are calculated and shown in Fig. 7 the highest value is 2.42 × 10⁻³ for the composites with 20 wt% AgNWs at 300 K, achieving more than four-times enhancement compared to the pure bulk PEDOT:PSS (ZT = 5.5 × 10⁻⁴). Although the ZT value of the composites is not impressive compared to that of PEDOT:PSS-based hybrid thin films, the electrical conductivity is relatively high among the bulk PEDOT:PSS TE materials.10,22,24,48 More important is that this enhancement in ZT is gained by raising the electrical conductivity without sacrificing the value of Seebeck coefficient or raising the thermal conductivity, and seems to be an ideal mode for us to fabricate high-performance bulk PEDOT:PSS TE materials. If we can realize an ordered structure in a bulk PEDOT:PSS system through some post or pro treatment process, we may achieve a much higher ZT value and closer the gap from that of thin films.8 Our further works will focus on how to realize the simultaneous enhancement in electrical conductivity and Seebeck coefficient for the bulk PEDOT:PSS.
Conclusion
In summary, we successfully prepared higher-performance AgNWs/PEDOT:PSS bulk TE materials by the as-prepared composites powders. The results show that the introduction of AgNWs may lead to the potential organic–inorganic interfaces, which can significantly enhances the carrier mobility and electrical conductivity. Furthermore, the introduction of AgNWs will not sacrifice the Seebeck coefficient and increase the thermal conductivity too much. We find sample with 20 wt% AgNWs has the highest electrical conductivity (84.84 S cm−1), making a five-times enhancement compared to the pure PEDOT:PSS, and the highest ZT value is achieved as 2.42 × 10⁻³ at room temperature. All these results demonstrate that the addition of low dimensional AgNWs and even other low dimensional materials may be the promising choice to improve the performance of bulk organic TE materials.Acknowledgements
This work was funded by Natural Science Foundation of China (no. 51374078, 51403037, 51432004), Shanghai Committee of Science and Technology (no. 13JC1400100 and 13NM1400101), PCSIRT (no. IRT1221), the Fundamental Research Funds for the Central Universities, DHU Distinguished Young Professor Program and DHU Post-graduate's Degree Thesis Innovation Programme (no. EG2015009).Notes and references
- H. K. Lyeo, A. A. Khajetoorians, L. Shi, K. P. Pipe, R. J. Ram, A. Shakouri and C. K. Shih, Science, 2004, 303, 816 CrossRef CAS PubMed.
- M. He, F. Qiu and Z. Lin, Energy Environ. Sci., 2013, 6, 1352 Search PubMed.
- N. E. Coates, S. K. Yee, B. McCulloch, K. C. See, A. Majumdar, R. A. Segalman and J. J. Urban, Adv. Mater., 2013, 25, 1629 CrossRef CAS PubMed.
- O. Bubnova, Z. U. Khan, A. Malti, S. Braun, M. Fahlman, M. Berggren and X. Crispin, Nat. Mater., 2011, 10, 429 CrossRef CAS PubMed.
- Q. Zhang, W. Wang, J. Li, J. Zhu, L. Wang, M. Zhu and W. Jiang, J. Mater. Chem. A, 2013, 1, 12109 CAS.
- Y. Hu, S. Norina and T. Naoki, J. Therm. Anal. Calorim., 2002, 69, 881 CrossRef.
- F. X. Jiang, J. K. Xu, B. Y. Lu, Y. Xie, R. J. Huang and L. F. Li, Chin. Phys. Lett., 2009, 25, 2202 Search PubMed.
- C. Liu, F. Jiang, M. Huang, R. Yue, B. Lu, J. Xu and G. Liu, J. Electron. Mater., 2011, 40, 648 CrossRef CAS PubMed.
- G. H. Kim, L. Shao, K. Zhang and K. P. Pipe, Nat. Mater., 2013, 12, 719 CrossRef CAS PubMed.
- Y. Du, K. F. Cai, S. Chen, P. Cizek and T. Lin, ACS Appl. Mater. Interfaces, 2014, 6, 5735 CAS.
- R. Venkatasubramanian, E. Siivola, T. Colpitts and B. O'Quinn, Nature, 2001, 413, 597 CrossRef CAS PubMed.
- L. M. Goncalves, P. Alpuim, A. G. Rolo and J. H. Correia, Thin Solid Films, 2011, 519, 4152 CrossRef CAS PubMed.
- T. C. Harman, M. P. Walsh, B. E. Laforgeand and G. W. Turner, J. Electron. Mater., 2005, 34, 19 CrossRef PubMed.
- D. Yoo, W. Son, S. Kim, J. J. Lee, S. H. Lee, H. H. Choi and J. H. Kim, RSC Adv., 2014, 4, 58924 RSC.
- Q. Yao, Q. Wang, L. Wang and L. Chen, Energy Environ. Sci., 2014, 7, 3801 CAS.
- J. Ouyang, ACS Appl. Mater. Interfaces, 2013, 5, 13082–13088 CAS.
- D. J. Yao, C. J. Kim and G. Chen, 20th International Conference on Thermoelectrics, Beijing, 2001 Search PubMed.
- R. Yang, J. Appl. Phys., 2004, 95, 8226 CrossRef CAS PubMed.
- G. S. Hwang, A. J. Gross, H. Kim, S. W. Lee, N. Ghafouri, B. L. Huang, C. Lawrence, C. Uher, K. Najafi and M. Kaviany, Int. J. Heat Mass Transfer, 2009, 52, 1843 CrossRef CAS PubMed.
- K. H. Lee and O. J. Kim, Int. J. Heat Mass Transfer, 2007, 50, 1982 CrossRef PubMed.
- Y. Wang, K. Cai, S. Chen, S. Shen and X. Yao, J. Nanopart. Res., 2014, 16, 2531 CrossRef.
- G. H. Kim, D. H. Hwang and S. I. Woo, Phys. Chem. Chem. Phys., 2012, 14, 3530 RSC.
- W. Wang, S. Sun, S. Gu, H. Shen, Q. Zhang, J. Zhu, L. Wang and W. Jiang, RSC Adv., 2014, 4, 26810 RSC.
- G. P. Moriarty, S. De, P. J. King, U. Khan, M. Via, J. A. King, J. N. Coleman and J. C. Grunlan, J. Polym. Sci., Part B: Polym. Phys., 2013, 51, 119 CrossRef CAS PubMed.
- Q. Zhang, X. Ai, W. Wang, L. Wang and W. Jiang, Acta Mater., 2014, 73, 37 CrossRef CAS PubMed.
- Q. Zhang, X. Ai, L. Wang, Y. Chang, W. Luo, W. Jiang and L. Chen, Adv. Funct. Mater., 2015, 25, 966 CrossRef CAS PubMed.
- L. Hicks and M. Dresselhaus, Phys. Rev. B: Condens. Matter Mater. Phys., 1993, 47, 16631 CrossRef CAS.
- A. I. Boukai, Y. Bunimovich, J. Tahir-Kheli, J. K. Yu, W. A. Goddard 3rd and J. R. Heath, Nature, 2008, 451, 168 CrossRef CAS PubMed.
- M. S. Dresselhaus, G. Chen, M. Y. Tang, R. G. Yang, H. Lee, D. Z. Wang, Z. F. Ren, J. P. Fleurial and P. Gogna, Adv. Mater., 2007, 19, 1043 CrossRef CAS PubMed.
- Y. Sun, Y. Yin, B. T. Mayers, T. Herricks and Y. N. Xia, Chem. Mater., 2002, 14, 4736 CrossRef CAS.
- H. Song, C. Liu, H. Zhu, F. Kong, B. Lu, J. Xu, J. Wang and F. Zhao, J. Electron. Mater., 2013, 42, 1268 CrossRef CAS.
- N. Duraisamy, S.-J. Hong and K.-H. Choi, Chem. Eng. J., 2013, 225, 887 CrossRef CAS PubMed.
- D. Han, G. Yang, J. Song, L. Niu and A. Ivaska, J. Electroanal. Chem., 2007, 602, 24 CrossRef CAS PubMed.
- B. D. Martin, N. Nikolov, S. K. Pollack, A. Saprigin, R. Shashidhar, F. Zhang and P. A. Heiney, Synth. Met., 2004, 142, 187 CrossRef CAS PubMed.
- W. Wang, Q. Zhang, J. Li, X. Liu, L. Wang, J. Zhu, W. Luo and W. Jiang, RSC Adv., 2015, 5, 8988 RSC.
- S. K. Yee, N. E. Coates, A. Majumdar, J. J. Urban and R. A. Segalman, Phys. Chem. Chem. Phys., 2013, 15, 4024 RSC.
- K. C. See, J. P. Feser, C. E. Chen, A. Majumdar, J. J. Urban and R. A. Segalman, Nano Lett., 2010, 10, 4664 CrossRef CAS PubMed.
- Q. Yao, Q. Wang, L. Wang, Y. Wang, J. Sun, H. Zeng, Z. Jin, X. Huang and L. Chen, J. Mater. Chem. A, 2014, 2, 2634 CAS.
- P. K. Choudhury, D. Bagchi, C. S. S. Sangeeth and R. Menon, J. Mater. Chem., 2011, 21, 1607 RSC.
- E. Çinar, S. Koçyiğit, A. Aytimur, I. Uslu and A. Akdemir, Metall. Mater. Trans. A, 2014, 45, 3929 CrossRef.
- N. G. Semaltianos, S. Logothetidis, N. Hastas, W. Perrie, S. Romani, R. J. Potter, G. Dearden, K. G. Watkins, P. French and M. Sharp, Chem. Phys. Lett., 2010, 484, 283 CrossRef CAS PubMed.
- Q. Yao, L. Chen, X. Xu and C. Wang, Chem. Lett., 2005, 34, 522 CrossRef CAS.
- D. Kim, Y. Kim, K. Choi, J. C. Grunlan and C. H. Yu, ACS Nano, 2010, 4, 513 CrossRef CAS PubMed.
- Y. S. Kim, D. Kim, K. J. Martin, C. Yu and J. C. Grunlan, Macromol. Mater. Eng., 2010, 295, 431 CAS.
- Q. Jiang, C. Liu, J. Xu, B. Lu, H. Song, H. Shi, Y. Yao and L. Zhang, J. Polym. Sci., Part B: Polym. Phys., 2014, 52, 737 CrossRef CAS PubMed.
- A. J. Minnich, M. S. Dresselhaus, Z. F. Ren and G. Chen, Energy Environ. Sci., 2009, 2, 466 CAS.
- H. L. Kwok, J. Mater. Sci.: Mater. Electron., 2014, 26, 830 CrossRef.
- A. Yoshida and N. Toshima, J. Electron. Mater., 2013, 43, 1492 CrossRef.
| This journal is © The Royal Society of Chemistry 2015 |

