Enhanced catalytic activity with high thermal stability based on multiple Au cores in the interior of mesoporous Si–Al shells

Yiwei Zhang, Sanming Xiang, Yuming Zhou*, Yuanmei Xu, Zewu Zhang, Xiaoli Sheng, Qianli Wang and Chao Zhang
School of Chemistry and Chemical Engineering, Southeast University, Nanjing 211189, P.R.China. E-mail: ymzhou@seu.edu.cn; Fax: +86 25 52090617; Tel: +86 25 52090617

Received 27th March 2015 , Accepted 18th May 2015

First published on 18th May 2015


Abstract

A novel mesoporous Si–Al/Au catalyst with core–shell structure was successfully fabricated by the combination of a sol–gel strategy and calcination process. This method involves the preparation of a gold sol and the capsulation of Si–Al layers. Afterwards, the mesoporous Si–Al/Au catalyst was obtained by calcination at 550 °C to remove the surfactant and other organics. The synthesized samples were characterized by several techniques, including transmission electron microscopy (TEM), energy-dispersive X-ray spectroscopy analysis, X-ray diffraction, field emission scanning electron microscopy (FESEM), N2 adsorption–desorption isotherms and UV-Vis spectra. It was found that this Si–Al/Au core–shell catalyst exhibited high thermal stability and the existence of a mesoporous structure could ensure high permeation and mass transfer rates for species involved in a catalytic reaction. After the calcination, the Au nanoparticles still maintained their small size because of the protective effect of the outside Si–Al layers. Moreover, when the samples were treated by a hydrothermal method, the one core was changed to multiple cores, resulting in the high catalytic activities for the reduction of p-nitrophenol (p-NPh). In our experiment, this prepared catalyst could be easily recycled without a decrease of the catalytic activities in the reaction.

1. Introduction

Hollow mesoporous structures have always been paid much attention and have been widely applied in many important research fields,1–3 such as energy storage, confined synthesis, optics, electronics and catalysis,4,5 owing to their properties of low density, high surface areas, and interstitial hollow spaces. Especially, the interior of hollow mesoporous structures decorated by encapsulating guest species, which are called “yolk-shell” structures, has attracted great interest in recent years.6,7 With permeable shells and the unique structures of functional cores, yolk-shell mesoporous structures can provide opportunities to render and advance the applications of hollow mesoporous materials.8–11 Typically, hollow mesoporous structures incorporated with catalytically active cores have therefore presented promising applications as nanoreactors for catalysis.12–14 Gold has always been considered as a very promising metal when Haruta et al.15 observed the extraordinary activity of gold for the oxidation of CO at low temperature. In fact, much work has been carried out to use gold as the core.2,12,16 However, it should be mentioned that Au nanoparticles (NPs) are easy to be aggregated at high temperature, which results in the deactivation of the catalyst. In this regard, the improved catalyst reaction stability and anti-sinter properties for Au NPs are in high demand. Recently, much reported work has focused on the stabilization of metal NPs by encapsulating them with the metal oxide layers because of the excellent chemical stability and versatile functionalization chemistry. Among these oxide shells, SiO2 has been widely applied as the oxide shell due to its excellent chemical stability and versatile functionalization chemistry.17,18 A good example of this strategy was Pt NPs coated with mesoporous SiO2, which were stable and could withstand calcination in air at 750 °C.19

However, silica-based templating methods were ineffective for controlling pore structures, resulting in hollow/yolk-shell mesoporous structures with disordered pore arrangements. In contrast, ordered mesoporous structures are attractive because of their large surface areas, high porosities, and uniform adjustable pore dimensions. All of these desired properties make them interesting materials for the catalysis and biomedical applications.20–22 Furthermore, considering that the core is the sole catalytic component and the permeable shell is only responsible for preventing aggregation from cores, the reported yolk-shell nanoreactors are mainly applied in single-step reactions. Fortunately, hollow mesoporous aluminosilica spheres (designated as HMAS) with ordered pore arrangements have been successfully fabricated by Fang and his co-workers.23 Based on their results, size-controllable HMAS with perpendicular pore channels can be easily obtained by alkaline etching of solid silica spheres in the presence of cationic surfactant and aluminate species. Nevertheless, it should be noted that in this reported literature, the active core was sole, that is to say, only one core was capsulated with silicaalumino spheres. As a matter of fact, this synthetic strategy is expected to be extended as an effective route to produce yolk-shell mesoporous structures with diverse compositions and morphologies. After all, the reaction rate of a chemical reaction is significantly affected by the concentration of active sites. The more active sites, the higher reaction rate. To the best of our knowledge, there are no literatures about the synthesized Au nanocatalysts that combine the advantage of good permeability from mesoporous Si–Al shells and the high activity upon multiple Au cores.

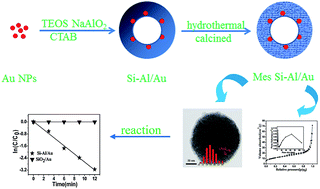
Herein, we report a facile, effective, and scalable route to prepare catalytically active hollow mesoporous silicaalumino spheres with multiple active sites (Fig. 1). In this point, the materials possibly have much advantage regarding the catalytic activity because of high permeability and more active sites.


image file: c5ra05489c-f1.tif
Fig. 1 Schematic illustration of Au colloids, Si–Al loading and calcination procedure for the fabrication of hollow mesoporous silicaalumino spheres with multiple active sites.

2. Experimental

2.1 Materials

Ethanol, isopropanol, sodium borohydride (NaBH4), PVP K30 (Mw ≈ 38[thin space (1/6-em)]000), HAuCl4 (10 mg mL−1), trisodium citrate (TSC), ammonia solution (25–28%), and tetraethyl orthosilicate (TEOS, 98%) were obtained from Sinopharm Chemical Reagent company, Shanghai, China. sodium metaaluminate, sodium carbonate, cetyl trimethyl ammonium bromide (CTAB), p-nitrophenol (p-NPh), deionized (DI) water. All reagents were used without further purification.

2.2 Synthesis

(a) Synthesis of Au colloids. Au NPs were formed by reducing HAuCl4 with TSC. Typically, 1 mL HAuCl4 (10 mg mL−1) was injected into 50 mL DI water. The solution was heated to boil. Then 5 mL TSC (10 mg mL−1) was added. After being kept boiling for 1 h, the solution was cooled to room temperature (RT). Afterwards, 1.5 g PVP was injected into the solution and stirring at RT for 12 h. The product was collected by drying at 25 °C for 12 h.
(b) Synthesis of Si–Al/Au colloids. The obtained Au colloids were dispersed in 50 mL isopropanol. The pH of the solution was adjusted by NaOH (0.1g mL−1) to 11. Sodium metaaluminate (0.68 g) and sodium carbonate (0.51 g) were successively added to the solution. CTAB (1.2 g) was subsequent added after stirred 10 min. 1 mL TEOS was dispersed in 5 mL isopropanol, and then dropped into the solution slowly. The mixed solution reacted for 16 h.
(c) Synthesis of mesoporous Si–Al/Au catalyst. The obtained product was kept in hydrothermal synthesis reactor at 150 °C for 48 h, collected after centrifugation and dried at RT for 12 h. The resulting product was calcined from RT to 550 °C at the rate of 10 °C min−1 under air and maintained at 550 °C for 4 h to remove the organics.
(d) Synthesis of SiO2/Au catalyst. SiO2/Au was prepared through a modified Stöber method.24 The obtained Au colloids were first mixed with ethanol (92 mL) and deionized water (12 mL), and then the resulted product was injected with NH3–H2O (1.68 mL) under vigorous stirring and TEOS (1.15 mL) as-dispersed in ethanol (28 mL) was then added. Another 1.15 mL TEOS was added after 30 min. The resulting SiO2/Au were collected after 12 h and washed three times with ethanol and water, respectively, and dried in air at 25 °C for 12 h. The resulting product was calcined from RT to 550 °C at the rate of 10 °C min−1 under air and maintained for 4 h to remove the organics.

2.3 Characterization

The morphology of the obtained products was characterized using a JEM-2010 transmission electron microscope (TEM) with an energy-dispersive X-ray spectrometer (EDX) and the field emission scanning electron microscopy (FESEM; FEI Inspect F50). The TEM samples were prepared by transferring one drop of sample dispersion in ethanol onto a carbon-coated copper grid and then dried in air. The nitrogen adsorption–desorption isotherms were measured at −196 °C on an ASAP 2020 (Micromertics USA). The specific surface area was determined from the linear part of the BET equation (P/P0 = 0.05–0.25). The pore size distribution was derived from the desorption branch of the N2 isotherm using the Barrett–Joyner–Halenda (BJH) method. UV-Vis spectra analysis was performed on a Shimadzu UV 3600 spectrometer.

2.4 Catalytic evaluation

The catalytic properties of the prepared catalysts were investigated using the reduction of p-NPh to p-APh (p-aminophenol) in the presence of NaBH4 as a model reaction. In a typical experiment, 0.03 mL of p-NPh (0.01 M, aqueous solution) was mixed with 0.5 mL of freshly NaBH4 (0.5 M, aqueous solution) and 1 mL of H2O in a quartz cell (3.0 mL). Then the dispersed aqueous solution of catalyst (1 mL, 0.5 g L−1) was added to the mixture of p-nitrophenol and NaBH4. The reaction progress was monitored with a UV-Vis spectrophotometer at a regular time to measure the extinction of the reaction mixture at 400 nm as a function of time. In all catalytic runs, the experimental conditions were kept constant. For the recycling experiment, the catalysts were collected, washed with deionized water, calcined at 200 °C and reused in the next cycles.

3. Results and discussion

3.1 Characterization of the different catalysts

During the process of catalyst preparation, different treatment condition may affect the dispersion status of Au NPs effectively.25 As for the prepared SiO2/Au sample that undergoes the only calcination treatment (Fig. 2(a)), although the each Au NPs can be covered by SiO2, the particles size distribution of the Au NPs is not uniform. By comparison, the Au NPs with uniform particle size can shift and form the “multiple Au cores” after the hydrothermal treatment (Fig. 2(b)). Additionally, significant differences in nanoparticle size can be found between these two investigated samples. From Fig. 2(a), the size of Au NPs is about 8 nm, while the value can decrease to about 3 nm when the sample undergoes the hydrothermal treatment (Fig. 2(b)). Obviously, this additional treatment inhibits the aggregation of Au NPs effectively, which results in the different crystal-formation. Possibly, in our experiment, the mild hydrothermal treatment (150 °C, liquid environment) and long treatment time (48 h) may provide the conditions for the full dispersion of Au NPs. Furthermore, among the various Au morphologies, it is well-known that the spherical one is the most easy to form. In this way, the shift and formation of the similar “spherical torus” structure for Au NPs is not surprising. Meantime, it can be expected that the increase of metal particle size is not obvious because of the relatively low treatment temperature. In a word, the hydrothermal treatment can facilitate the formation of multiple Au cores and keep the Au nanoparticles at a small size, which may enhance the catalytic activity.
image file: c5ra05489c-f2.tif
Fig. 2 TEM images of different SiO2/Au morphologies by different treat condition: (a) calcination at 550 °C for 4 h, (b) hydro-thermal treatment at 150 °C for 48 h, and then calcined at 550 °C for 4 h. The reduction time for gold precursors for all the sample is 2 hour.

In addition, it should be noted that the formation of cavity inside the SiO2 sphere can also influence the dispersion of Au NPs and reaction performance significantly. To investigate this issue more clearly, during the hydrolysis process of the sample, the treatment time has been extended (24 h). As presented in Fig. 3(a), over the SiO2/Au sample, the Au NPs is successfully capsuled by SiO2 sphere. At this moment, the average size of Au NPs and the thickness of SiO2 shells are about 40 and 50 nm, respectively. Furthermore, unlike common SiO2 sphere, a large cavity can be observed in the inner of SiO2 sphere (Fig. 3(b)). Presumably, this phenomenon may be explained by the fact that the etching of silicon near the Au core can be easily occurred.26 In a consequence, the silicon far away the Au core can be retained, which results in the formation of the cavity. Besides, from Fig. 3(c), the as-synthesized silica spheres possess well-defined, smooth and uniform spherical shells. The diameter of SiO2 sphere is about 200 nm. Actually, the diameter can be well controlled by adjusting the hydrolyzing conditions, such as the pH and the time of hydrolysis. Typically, the big pH and the long hydrolyzing time make the SiO2 sphere become more uniformly, and the cavities are more easy to form. As we all know, the big of reaction space is conducive to diffusion of molecular, which is favorable for the reaction to be carried out.


image file: c5ra05489c-f3.tif
Fig. 3 (a) TEM images of SiO2/Au morphologies (b) the enlarged image (c) FESEM images for SiO2/Au sample (d) the enlarged image. Samples calcined at 550 °C for 4 h.

On the other hand, when comparing with the sample in Fig. 2, the size of Au NPs shown in Fig. 3 is much bigger, which can be related with the changes of preparation conditions. As stated before (Fig. 2), during the calcination process, the absence of hydro-thermal treatment leads to the aggregation of Au nanoparticles. Moreover, it should be mentioned that the hydrolyzing time for this sample is twice as that of the sample in Fig. 2(a). Both of these factors should be responsible for the increase of nanoparticle size. Actually, the Si–Al/Au catalyst is undergoing hydrothermal process to obtain the small Au nanoparticles in the following experimentation.

As expected, the Si–Al/Au catalyst exhibits the small size of Au NPs after hydrothermal treatment. As displayed in Fig. 4(a), many uniform spheres with diameter about 200 nm can be obtained. As regarding the enlarged image (Fig. 4(b)), the SiO2 and NaAlO2 shell can also be clearly seen and the thickness of the outer shell is about 6 nm. In this case, the distribution of Au NPs size is relatively uniform and the mean value is about 3.6 nm, which is consistent with the size of Au NPs shown in Fig. 2(b). Furthermore, over this sample, the mesoporous structure of shell has formed and loose shell structure can be observed, which may offer more channels for reactants to the Au active sites. Apparently, this behavior can be attributed to the thermal degradation of template (CTAB) during the synthesized process. The formation of the mesoporous shell in the Si–Al/Au catalyst may affect the catalytic activities effectively.


image file: c5ra05489c-f4.tif
Fig. 4 (a) TEM images of mesoporous Si–Al/Au sample that calcined at 550 °C for 4 h, (b) the enlarged image. Inset in the image is the Au NP size distribution histogram.

To investigate the different crystalline structure between SiO2/Au and Si–Al/Au catalyst, the XRD diffractions have been carried out. As for the SiO2/Au sample (Fig. 5(a)), three peaks corresponding to diffraction from 38.2° (111), 44.3° (200), 64.6° (220) planes of face centered cubic are observed. In addition, this sample exhibits fcc structure with d-values matching with that of Au metal (JCPDS no. 4-784) (fcc) gold27 and a broad peak for SiO2 in the 2θ = 21.46°. Comparing with this, the diffraction of Si–Al/Au catalyst (Fig. 5(b)) exhibits the structure characteristic of molecular sieve, which was in consistent with the reported structure of NaY zeolite.28 Possibly, this is because the addition of Na2AlO2 during the process of synthesis can not only provide an alkaline environment, but also bring more sodium sources. As a result, the structure of catalyst has been changed effectively. Moreover, as revealed in Fig. 5(a), the characteristic diffraction peak of gold can be found over the Si–Al/Au sample, which suggests that the Au NPs still have the well crystal structure. The ratio of each element can be seen from the right of Fig. 5 and the Au content is 0.8% from the EDX analysis.


image file: c5ra05489c-f5.tif
Fig. 5 Left: XRD pattern for (a) SiO2/Au, (b) the mesoporous Si–Al/Au respectively. Right: the EDX analysis for the Si–Al/Au sample. The samples were treated at 550 °C for 4 h.

The low-temperature nitrogen adsorption–desorption isotherms were commonly used to evaluate the pore structure parameters of materials. In the present work, the pore structure of SiO2/Au and Si–Al/Au samples were confirmed by nitrogen physisorption and the BJH pore size distribution curve calculated from the analysis of the desorption branch of the isotherms (the insets of the N2 adsorption–desorption isotherms). From Fig. 6(a), the SiO2/Au sample presents a relatively broad size distribution and a large amount of pore size concentrated on the range from 40 nm to 90 nm. In other words, this prepared catalyst exhibits more macroporous structure, while reflects less mesoporous structure. It can be suggested that this two kinds of pore structure may be formed from the accumulation of outer SiO2 shells, and no pore structure is produced in the inner of the SiO2/Au catalyst.


image file: c5ra05489c-f6.tif
Fig. 6 N2 adsorption–desorption isotherms, pore size distribution (inset) of the synthesized SiO2/Au (a) mesoporous Si–Al/Au (b) catalysts that calcined at 550 °C for 4 h.

In comparison with this, the decrease of pore size and increased BET surface area are found over the Si–Al/Au sample. In this situation, the pore size distribution is relatively narrow and the pore size is concentrated on 3 nm and 60 nm. Clearly, the Si–Al/Au sample exhibits the micro-mesoporous complex structure. Moreover, as presented in Fig. 6, the SiO2/Au catalyst only shows the hysteresis loops in the relative pressure range of 0.9–1.0, while the Si–Al/Au one exhibits the hysteresis loops not only in the relative pressure range of 0.9–1.0, but also in the range of 0.4–0.8. This finding demonstrates that the Si–Al/Au catalyst has the well-developed pore characteristics. Presumably, the change of catalyst structure may be ascribed to the addition of CTAB and Na2AlO2 during the process of catalyst preparation. As reported previously,29 the narrow pore size distribution, the big BET surface area, result from the enhanced catalytic activities. From this point of view, the Si–Al/Au sample may exhibit the improved catalytic activity than SiO2/Au catalyst.

3.2 Reaction performance

In this study, the reduction of p-NPh to p-APh by an excess amount of NaBH4 has been chosen as a probe reaction to assess the catalytic activity of the SiO2/Au and Si–Al/Au samples. It should be mentioned that this reaction has become one of the model reactions for testing the catalytic activity of various noble metal nanoparticles. Moreover, the yellow fading and eventual bleaching involved in the reduction also provide a simple way to monitor the reaction kinetics by using UV-Vis spectroscopy.30,31 Under neutral or acidic conditions, aqueous p-NPh shows a peak centered at 317 nm. Upon the addition of NaBH4, the alkalinity of the solution increased and p-nitrophenolate ions would become the dominating species, together with a spectral shift to 400 nm of the absorption peak.32,33 Without the presence of catalyst, the maximum absorption peak stayed unaltered, and the mixture remained yellow, meaning the p-NPh was inert to NaBH4 and the reduction would not proceed. After Au-based catalyst was added, the Au NPs acted as an electron relay system and the absorption peak at 400 nm gradually dropped in intensity. Besides, a new absorption peak at 317 nm started to appear with the formation of p-APh. After the completion of the reaction, the peak ascribed to the nitro compound disappeared, which indicated that the catalytic reduction of p-NPh had proceeded completely.

The reaction rate of a chemical reaction can be affected by the concentration of the reacting materials, the temperature and the surface area of the catalyst.34 To compare the catalytic properties of the prepared SiO2/Au and Si–Al/Au samples, we investigate the efficiency of these catalysts in catalyzing the above reduction reaction. Fig. 7(b) shows the normalized concentration of p-NPh (C/C0), at different reaction times when different catalysts are used in catalytic reaction. As can be seen, the concentration of p-NPh remains nearly unchanged when the SiO2/Au sample is added, demonstrating that the SiO2/Au catalyst has little affection on reducing p-NPh under our experimental conditions. In a contrast, when the Si–Al/Au sample is introduced into the reaction system, the conversion of p-NPh to p-APh reaches 96% at a reaction time of 12 min, indicating that Si–Al/Au catalyst has high catalytic activity in the reduction of p-NPh to p-APh. Furthermore, from Fig. 7(b), it is worth noting that the reaction occurs significantly slowly during the initial stage of the catalytic reaction (less than 3 min). This may be attributed to the fact that a period of time is indispensable for the reactants to be adsorbed on the surface of the catalyst before the reduction reaction can occur.35


image file: c5ra05489c-f7.tif
Fig. 7 Successive UV-visible absorption spectra of p-NPh solution reduced by NaBH4 in the presence of Si–Al/Au catalyst calcined at 550 °C for 4 h, comparison of (b) degradation profile, (c) rate constants, (d) conversion with repeated usage.

Since the concentration of NaBH4 largely exceeds the concentration of p-NPh, the reduction rate can be assumed to be independent of NaBH4 concentration. At this point, a pseudo-first-order rate kinetics is regarded to the p-nitrophenolate.33,36,37 In all runs discussed here, a linear relation of ln(C/C0) versus reaction time is observed (Fig. 7(c)). The reaction rate is calculated from the decrease in the concentration of p-NPh from the UV-Vis spectra. In all catalytic runs, the experimental conditions are kept constant at a molar ratio Au[thin space (1/6-em)]:[thin space (1/6-em)]p-NPh[thin space (1/6-em)]:[thin space (1/6-em)]NaBH4 of 1[thin space (1/6-em)]:[thin space (1/6-em)]15[thin space (1/6-em)]:[thin space (1/6-em)]1000. The reaction rate constants are estimated from the slopes of the straight line. As can be seen from Fig. 7(c), the Si–Al/Au sample exhibits the higher catalytic performance and the rate constant is 0.26 min−1. Apparently, this phenomenon can be explained in terms of the following reasons. Firstly, its configuration that with a higher BET surface area and the unique Si–Al mesoporous structure are the major factors. As shown in Fig. 6 the samples with the higher BET surface area and more channels for reactants easily reached the exposed Au NPs. Secondly, the mesoporous structure allowed the diffusion of small molecules in and out of the reactors, which is beneficial to improve the reaction activity.38 During the process of catalyst preparation, the addition of NaAlO2 can not only change the properties of the catalyst but also provide an alkaline environment, which may facilitate the reaction rate. On the other hand, the catalytic efficiency of the metal nanoparticles for the electron-transfer process greatly depends on their size redox properties.29 Owing to the kinetic barrier between the mutually repelling negative BH4 ions and p-NPh, the reduction reaction can not proceed unmediated. With the presence of a catalyst, the electron transfer from BH4 to p-NPh may be relayed by the metal NPs in the catalytic reduction.39,40 Following Plieth's study,41 the redox potential lowers with the decreasing size of small metal nanoparticles. Compared with SiO2/Au sample, Si–Al/Au exhibits the smaller nanoparticle size. Accordingly, the potential barrier height at the interface between the Au NPs and p-NPh is lower. Therefore, the Si–Al/Au sample would exhibit a faster electron transfer rate, resulting in higher catalytic activities. Then last but not least, from the TEM images (Fig. 5), over the Si–Al/Au catalyst, the silica-aluminum barrier surrounds Au NPs, which is beneficial to prevent them from coming together even when the calcination temperature increased to 550 °C. Thus, it can be deduced herein that the Au NPs can be effectively prevented from sintering after the pretreatment in the reaction stage. Furthermore, many small Au NPs are encapsulated in a sphere result from the enrichment of active sites. As a result, the catalytic activity is greatly enhanced.

Besides, the reusability is one of the best advantages of using a heterogeneous catalyst rather than a homogeneous catalyst. In our experiments, the reusability of Si–Al/Au catalyst toward the reduction of p-NPh in the presence of NaBH4 has also been discussed. The experiment is performed by recovering and reusing the Si–Al/Au catalyst and keeping all the other parameters constant. As exhibited in Fig. 7(d), the result indicates that catalyst shows a very good activity for five catalytic cycles without any significant decrease in the p-NPh conversion. In this circumstance, the conversion yield of p-NPh to p-APh is still maintained at 95.8%.

4. Conclusions

In summary, a novel multinuclear mesoporous Si–Al/Au catalyst with a typical size of about 200 nm has been successfully fabricated. This material has been prepared by the capsulation of Si–Al layers on gold sol, and then the Si–Al/Au mesoporous catalyst was calcined at 550 °C to remove the surfactant and other organics. The results demonstrated the Si–Al/Au catalyst with multiple Au cores in the mesoporous Si–Al sphere and the Au nanoparticles could maintain at a small size after the calcination at 550 °C. Furthermore, the Si–Al/Au catalyst exhibited the unique structure because of the addition of NaAlO2 and possessed high catalytic activity in p-NPh reduction. Even after five reaction cycles, this prepared catalyst did not lose catalytic activity significantly.

Acknowledgements

The authors are grateful to the financial supports of National Natural Science Foundation of China (Grant no. 21376051, 21106017 and 21306023), Natural Science Foundation of Jiangsu Province of China (Grant no. BK20131288), Fund Project for Transformation of Scientific and Technological Achievements of Jiangsu Province of China (Grant no. BA2011086), Fund Project for China Scholarship Council (no. 201308320238) and Instrumental Analysis Fund of Southeast University.

References

  1. S. H. Tang, X. Q. Huang, X. L. Chen and N. F. Zheng, Adv. Funct. Mater., 2010, 20, 2442–2447 CrossRef CAS PubMed.
  2. C. B. Gao, Q. Zhang, Z. D. Lu and Y. D. Yin, J. Am. Chem. Soc., 2011, 133, 19706–19709 CrossRef CAS PubMed.
  3. Y. Yao, M. T. McDowell, I. Ryu, H. Wu, N. A. Liu, L. B. Hu, W. D. Nix and Y. Cui, Nano Lett., 2011, 11, 2949–2954 CrossRef CAS PubMed.
  4. K. An and T. Hyeon, Nano Today, 2009, 4, 359–373 CrossRef CAS PubMed.
  5. X. W. Lou, L. A. Archer and Z. C. Yang, Adv. Mater., 2008, 20, 3987–4019 CrossRef CAS PubMed.
  6. J. Liu, S. Z. Qiao, J. S. Chen, X. W. Lou, X. R. Xing and G. Q. Lu, Chem. Commun., 2011, 47, 12578–12591 RSC.
  7. Y. Zhao and L. Jiang, Adv. Mater., 2009, 21, 3621–3638 CrossRef CAS PubMed.
  8. K. M. Yeo, S. Choi, R. M. Anisur, J. Kim and I. S. Lee, Angew. Chem., Int. Ed., 2011, 50, 745–748 CrossRef CAS PubMed.
  9. W. Li, Y. H. Deng, Z. X. Wu, X. F. Qian, J. P. Yang, Y. Wang, D. Gu, F. Zhang, B. Tu and D. Y. Zhao, J. Am. Chem. Soc., 2011, 133, 15830–15833 CrossRef CAS PubMed.
  10. J. Liu, H. Q. Yang, F. Kleitz, Z. G. Chen, T. Y. Yang, E. Strounina, G. Q. Lu and S. Z. Qiao, Adv. Funct. Mater., 2012, 22, 591–599 CrossRef CAS PubMed.
  11. J. Kim, Y. Piao, N. Lee, Y. I. Park, I. H. Lee, J. H. Lee, S. R. Paik and T. Hyeon, Adv. Mater., 2010, 22, 57–60 CrossRef CAS PubMed.
  12. J. Lee, J. C. Park and H. Song, Adv. Mater., 2008, 20, 1523–1528 CrossRef CAS PubMed.
  13. X. Q. Huang, C. Y. Guo, L. Q. Zuo, N. F. Zheng and G. D. Stucky, Small, 2009, 5, 361–365 CrossRef CAS PubMed.
  14. S. H. Joo, J. Y. Park, C. K. Tsung, Y. Yamada, P. D. Yang and G. A. Somorjai, Nat. Mater., 2009, 8, 126–131 CrossRef CAS PubMed.
  15. M. Haruta, N. Yamada, T. Kobayashi and S. Iijima, J. Catal., 1989, 115, 301–309 CrossRef CAS.
  16. J. C. Park and H. Song, Nano Res., 2011, 4, 33–49 CrossRef CAS.
  17. H. Li, K. D. Yuan, Y. Zhang and J. Wang, ACS Appl. Mater. Interfaces, 2013, 5, 5601–5608 CAS.
  18. Z. Y. Sun, H. Y. Zhang, Y. F. Zhao, C. L. Huang, R. T. Tao, Z. M. Liu and Z. D. Wu, Langmuir, 2011, 27, 6244–6251 CrossRef CAS PubMed.
  19. P. M. Arnal, M. Comotti and F. Schuth, Angew. Chem., Int. Ed., 2006, 45, 8224–8227 CrossRef CAS PubMed.
  20. A. Taguchi and F. Schuth, Microporous Mesoporous Mater., 2005, 77, 1–45 CrossRef CAS PubMed.
  21. R. Liu, X. Zhao, T. Wu and P. Y. Feng, J. Am. Chem. Soc., 2008, 130, 14418–14419 CrossRef CAS PubMed.
  22. R. Liu, Y. Zhang, X. Zhao, A. Agarwal, L. J. Mueller and P. Y. Feng, J. Am. Chem. Soc., 2010, 132, 1500–1501 CrossRef CAS PubMed.
  23. X. L. Fang, Z. H. Liu, M. F. Hsieh, M. Chen, P. X. Liu, C. Chen and N. F. Zheng, ACS Nano, 2012, 6, 4434–4444 CrossRef CAS PubMed.
  24. Z. W. Zhang, Y. M. Zhou, Y. W. Zhang, S. J. Zhou, J. J. Shi, J. Kong and S. C. Zhang, Dalton Trans., 2013, 42, 5004–5012 RSC.
  25. Z. W. Seh, S. H. Liu, S. Y. Zhang, M. S. Bharathi, H. Ramanarayan, M. Low, K. W. Shah, Y. W. Zhang and M. Y. Han, Angew. Chem., Int. Ed., 2011, 50, 10140–10143 CrossRef CAS PubMed.
  26. X. L. Fang, C. Chen, Z. H. Liu, P. X. Liu and N. F. Zheng, Nanoscale, 2011, 3, 1632–1639 RSC.
  27. Y. W. Zhang, Y. M. Zhou, Z. W. Zhang, S. M. Xiang, X. L. Sheng, S. J. Zhou and F. Wang, Dalton Trans., 2014, 43, 1360–1367 RSC.
  28. X. M. Liu, T. T. Yang, P. Bai and L. Han, Microporous Mesoporous Mater., 2013, 181, 116–122 CrossRef CAS PubMed.
  29. P. H. Zhang, Y. M. Sui, G. J. Xiao, Y. N. Wang, C. Z. Wang, B. B. Liu, G. T. Zou and B. Zou, J. Mater. Chem. A, 2013, 1, 1632–1638 CAS.
  30. J. Wang, X. B. Zhang, Z. L. Wang, L. M. Wang, W. Xing and X. Liu, Nanoscale, 2012, 4, 1549–1552 RSC.
  31. S. Xiang, Y. Zhou, Y. Zhang, Z. Zhang, X. Sheng, S. Zhou and Z. Yang, Dalton Trans., 2014, 43, 11039–11047 RSC.
  32. J. Q. Ma, X. H. Guo, Y. Y. Zhang and H. G. Ge, Chem. Eng. J., 2014, 258, 247–253 CrossRef CAS PubMed.
  33. H. Li, J. Y. Liao and Z. Xibin, J. Mater. Chem. A, 2014, 2, 17530–17535 CAS.
  34. M. A. Mahmoud, F. Saira and M. A. El-Sayed, Nano Lett., 2010, 10, 3764–3769 CrossRef CAS PubMed.
  35. P. Herves, M. Perez-Lorenzo, L. M. Liz-Marzan, J. Dzubiella, Y. Lu and M. Ballauff, Chem. Soc. Rev., 2012, 41, 5577–5587 RSC.
  36. A. A. Ismail, A. Hakki and D. W. Bahnemann, J. Mol. Catal. A: Chem., 2012, 358, 145–151 CrossRef CAS PubMed.
  37. S. Wunder, F. Polzer, Y. Lu, Y. Mei and M. Ballauff, J. Phys. Chem. C, 2010, 114, 8814–8820 CAS.
  38. N. R. Jana and T. Pal, Langmuir, 1999, 15, 3458–3463 CrossRef CAS.
  39. M. Miranzadeh and M. Z. Kassaee, Chem. Eng. J., 2014, 257, 105–111 CrossRef CAS PubMed.
  40. Y. Chen, Q. H. Wang and T. M. Wang, Dalton Trans., 2013, 42, 13940–13947 RSC.
  41. W. J. Plieth, J. Phys. Chem., 1982, 86, 3166–3170 CrossRef CAS.

This journal is © The Royal Society of Chemistry 2015
Click here to see how this site uses Cookies. View our privacy policy here.