
Study of FePt deposited reduced graphene oxide's utility as a catalyst towards oxygen reduction and methanol oxidation reactions†
R. Kannan*a,
A. A. Silvaa,
F. M. Cardosoa,
G. Guptaa,
Z. Aslamb,
S. Sharmaa and
R. Steinberger-Wilckensa
aCentre for Fuel Cell and Hydrogen Research, School of Chemical Engineering, University of Birmingham, Birmingham, UK. E-mail: chemkannan@yahoo.com
bLENNF, University of Leeds, Leeds, UK
First published on 14th April 2015
Abstract
Hydrogen and methanol fuelled polymer electrolyte fuel cell's (PEFC) penetration in the commercial market is slowed by the use of expensive Pt and PtRu as electrocatalysts. Transition metal based Pt alloy catalysts have historically struggled for durability in acidic environments. Reduced graphene oxide (RGO) supported Pt alloy catalysts have gained significant interest recently due to improvements in catalyst–support interaction that lead to better durability and performance. In this report we investigate the performance and durability aspects of FePt supported on RGO towards oxygen reduction and methanol oxidation reactions. PXRD and TEM results show that the FePt nanoparticle size is in the range of 4–7 nm and TGA measurements show that the metal loading of the catalyst is ∼55%. Electrochemical measurements towards ORR reveal a significant improvement in activity and durability for FePtGO over commercial PtC and FePtC. The utilization of RGO as a support certainly increases the lifetime of transition metal–Pt alloys that are generally susceptible to durability issues under acidic environments in fuel cells.
Introduction
Among the energy conversion technologies, polymer electrolyte membrane fuel cells (PEFCs) fuelled by hydrogen and methanol are one of the front runners to replace the incumbent combustion engines mainly in transportation applications.1 This is primarily due to their low temperature operation that allows quicker start-ups and ease of handling. However, the cost and durability of the technology still remains an issue despite significant effort for the past two decades, chiefly due to the use of expensive Pt as electrocatalyst for the sluggish oxygen reduction reaction (ORR). Further, in direct methanol fuel cells (DMFCs), catalyst poisoning by methanol crossover to the cathode is another major issue for ORR catalysts. Efforts to reduce the Pt use in the electrode involves: (1) reducing the Pt particle sizes and controlling their shape, (2) alloying with transition metal ions to modify the electronic structure of the Pt, (3) core–shell structures with cheap metals as core and Pt as shell and (4) alternative non-precious catalysts that replace Pt altogether in the catalyst layer.2–15 For example, Pt nanocubes have shown 4 times higher catalytic activity than Pt polyhedron towards ORR in sulphuric acid medium as the preferential attachment of sulphite ions on Pt (111) hinders its activity toward oxygen reduction.16 However, in perchloric acid medium Pt (111) has shown better catalytic activity than Pt (100).Pt–M alloy catalysts have shown promise to increase the catalytic activity of Pt towards ORR especially when M is Fe, Co or Ni.3,5,17 Volcano plots describing specific activity as a function of Pt's d-band value suggests Co as the best alloying transition metal while Fe is not far behind with superior abundance than Co.18 However, when transition metals such as Fe, Co or Ni are used for alloying with carbon as the support, they are etched and dissolved in the highly acidic PEFC operating conditions leading to performance loss. Further, Fe and Co ions generated during operation are known to damage the polymer electrolyte membranes by producing hydrogen peroxide through Fenton's reaction.19,20 Structural modifications in the FePt alloy from a face centred cubic (FCC) structure to face centred tetragonal (FCT) structure has resulted in improved durability under acidic conditions while issues associated with scaling up and supporting on a carbon support remain unsolved.21 However, the discovery of graphene and its evolution as a better support for catalysts have rejuvenated this section of research and recent reports suggest an increase in durability for transition metal based Pt alloy catalysts under previously harsh fuel cell operating conditions.17,22–27 For example, Guo et al. have self-assembled FePt nanoparticles, which were grown separately, on a graphene support and observed improved catalytic activity and durability.17 However, the catalysts prepared in these studies are normally bigger than commercial catalysts and results in a loss of electrochemical surface area. Hence, it is imperative to study the catalytic activity of differently sized FePt nanoparticles supported in RGO to investigate RGO's role as support for varying particle sizes.
Here we present the results of a new preparation method and its effectiveness for the preparation of FePt/RGO catalysts. We decided a step-wise addition of iron and platinum in order to use Fe nanoparticle as nucleating sites for the Pt nanoparticle formation. The purpose of this procedure is to study the effect of a strong reducing agent in reducing the particle size and improving the performance. We have used cyclic voltammetry and linear sweep voltammetry under various rotation rates for the catalysts. Further, the catalytic activity of FePtGO towards methanol oxidation was also studied to analyse its suitability as ORR catalyst in direct methanol fuel cells.
Experimental
Synthesis of FePtGO and FePtC
Iron(II) acetate Fe(OAc)2, K2PtCl6, NaBH4, were all procured from Sigma Aldrich UK. Solvents and other chemicals used in the experiments were of analytical grade purchased from Sigma Aldrich. 5% Nafion was procured from Electrochem Inc. Graphene oxide (GO) was prepared in-house by a modified Hummers method.28 Detailed procedures can be found in the ESI.† 100 mg of GO was dispersed in 50 mL of ethanol in a round bottom flask (RBF). 50 mg of 1,10-phenanthroline (Sigma Aldrich UK) dispersed in 50 mL of ethanol was added to the GO solution. 78 mg of iron(II) acetate dispersed in 50 mL ethanol was slowly added to the solution via a burette with continuous stirring and a deep red colour indicating the formation of Fe–phenanthroline complex was observed. An excess of NaBH4 dissolved in DI water was added slowly to this mixture and stirring was continued for another two hours. The mixture was filtered, washed with plenty of DI water, dried in a vacuum oven at 40 °C for 2 days and stored for further experiments. The sample was labelled as FeGO. For FePtGO preparation, 60 mg of FeGO was dispersed in DI water and 100 mg of K2PtCl6 was added into this mixture. To this mixture an excess of NaBH4 was added slowly and stirring continued for another 2 hours. The resulting solution was filtered, washed and dried in a vacuum oven at 40 °C for 2 days and the sample was labelled as FePtGO. Similarly FeC and FePtC were also prepared by using graphitic carbon support. Commercial PtC (46 wt%) obtained from Tanaka (PtC-TKK) was used for comparison. Prepared catalysts were characterized by PXRD, XPS (VG Escalab 25), TEM (Philips CM200 FEGTEM operated at 200 kV) and TGA (TG 209 F1 Libra, NETZSCH). PXRD measurements were carried out in D2 phase analyser with a cobalt source.Electrochemical experiments
The catalyst ink was prepared by dispersing 3.4 mg of the catalyst, 16.66 μL of 5% Nafion solution, 3.153 mL of DI water and 1 mL of IPA through probe sonication for 10 minutes on a 5 s on/off cycle.29 10 μL of this ink was dispensed on the clean glassy carbon electrode (5 mm diameter) and dried in an oven at 50 °C. ORR experiments were carried out in 0.1 M HClO4 electrolyte with a reversible hydrogen electrode (RHE) as reference electrode and Pt mesh as counter electrode. Methanol oxidation studies were carried out in 0.5 M CH3OH in 0.5 M H2SO4 electrolyte. A Ag/AgCl electrode was used as the reference electrode and Pt mesh as the counter electrode. Pt mesh was heated to red hot condition before each fresh measurement to ensure it was free of contaminants. The commercial PtC used in this work for comparison is TEC10E50E (supplied by TKK and referred from here as PtC-TKK). Cyclic voltammetry, linear sweep voltammetry experiments were performed using an Autolab PGSTAT12/30/302. A pine rotation controller was used for the rotating disc electrode measurements.Results and discussion
PXRD measurements on FePtGO and FePtC revealed the formation of polycrystalline Pt nanoparticles with (111) as the major phase (Fig. 1a). This is the dominant phase under both supports (GO and graphitic carbon) and it is clear that the support material does not play a role in phase formation here. Intensities (I111/I110) are in similar range for both catalysts making it suitable for comparing their catalytic activity. The particle size calculated by the Scherer equation is in the range of 4–6 nm for FePtGO while it is in the range of 5–7 nm for FePtC. | ||
| Fig. 1 (a) PXRD patterns obtained for commercial PtC-TKK, in house prepared FePtGO and FePtC catalysts. (b) TGA plots obtained for FePtGO, FePtC, FeGO and FeC. | ||
Commercial PtC-TKK has particles in the range of 2–3 nm. An impurity peak is observed with FePtC at 2 theta value of ∼65° despite the cleaning procedures undertaken while no such impurity peak was observed in FePtGO. TGA measurement shown in Fig. 1b revealed the overall metal content of the prepared catalysts were around 52% in FePtC and 60% in FePtGO. The Fe content in the FeGO and FeC is ∼25% indicating a net Pt content of 27 and 35% in the final FePtGO and FePtC catalysts, respectively. TGA results further reveal that despite the use of NaBH4 as the reducing agent, a significant amount of functional groups remained in the GO after reduction. About 25% and 10% weight loss are observed below 200 °C for FeGO and FePtGO respectively that could be attributed to water molecules and hydroxyl groups attached to GO surface functional groups.30–32
Bright field transmission electron microscopic (TEM) images of both catalysts were obtained to study their nanoscale morphologies. Representative images obtained for FePtGO and FePtC are given in Fig. 2. FePt nanoparticles show a narrow distribution in size in the range of 4–7 nm on both supports. However, due to the high metal content (55–60%) agglomeration and clustering of the nanoparticles is found in few places and could not be avoided in the solution reduction method with a strong reducing agent such as NaBH4. Nevertheless, the particle size observed from TEM analysis is in accordance with the PXRD results. Further, no FePt particle is detected on the TEM grids outside RGO suggesting a better interaction between the nanoparticle and its support. The particle sizes observed for our catalysts or slightly bigger than the commercial PtC catalyst (2–3 nm) while FePt particles reported in the literature vary from 2–8 nm.6,21,33,34
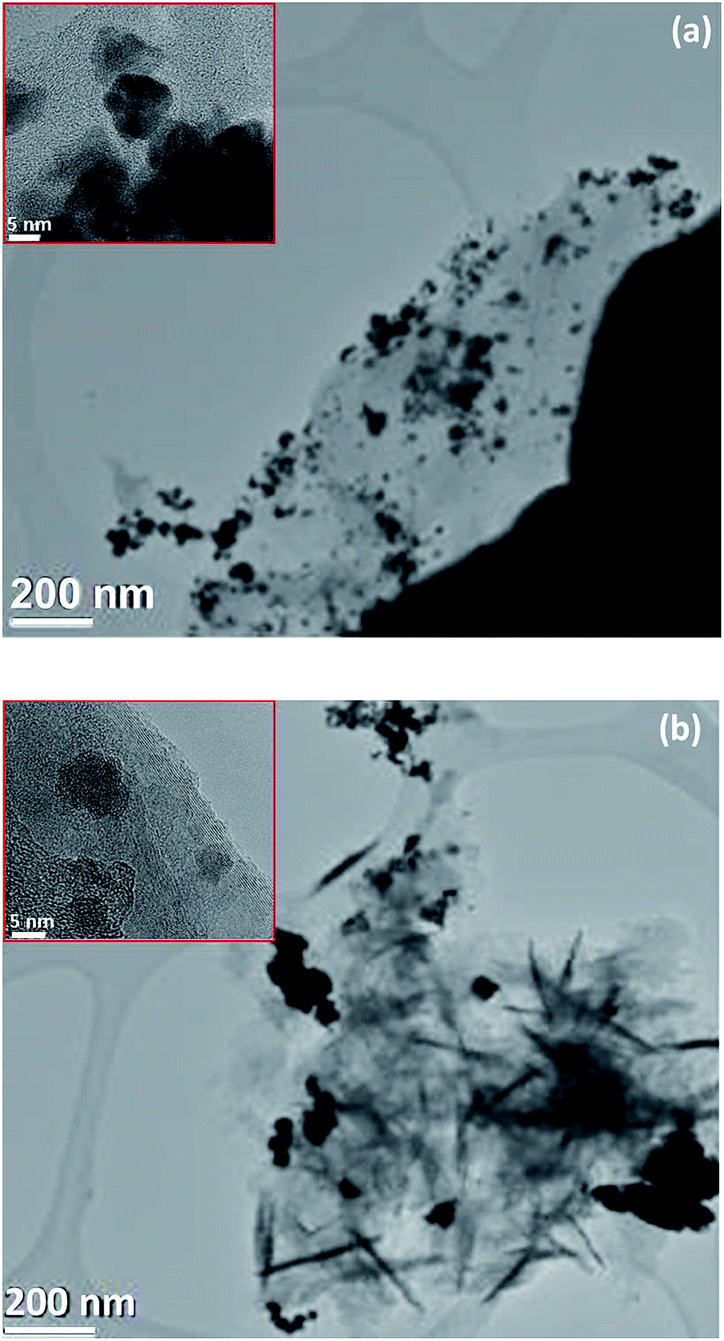 | ||
| Fig. 2 TEM images of the as prepared (a) FePtGO and (b) FePtC. Insets show the particles in the size range of 4–6 nm. | ||
Electrocatalytic properties of the prepared catalysts were analysed through cyclic voltammograms (CVs) which are shown in Fig. S1a.† The normalized CVs show a higher double layer region for FePtGO indicating the higher surface area of RGO along with displaying the characteristic peaks of Pt nanoparticles. Linear sweep voltammograms (LSV) obtained at a rotation rate of 2000 rpm normalized with the electrochemical surface area (ECSA) are shown in Fig. 3a. FePtGO showed enhanced performance to that of PtC-TKK and FePtC. At 0.9 V, the current density observed with FePtGO is 5 and 3.5 times higher than that of currents obtained with PtC-TKK and FePtC respectively. Further, at a current density of 0.5 mA cm−2, about 77 mV less overpotential is observed for FePtGO in comparison to that of FePtC. The catalytic activity per gram of Pt calculated for FePtGO is comparable to that of the commercial catalyst despite its larger size (∼5 nm against ∼2.5 nm) which clearly indicates the superior catalytic activity of FePtGO (Fig. S1b†). This could further assist in improving the durability of the catalyst as smaller particles are known to agglomerate during fuel cell operation. A maximum current density of 0.425 A g−1 at 0.7 V was obtained with FePtGO which is comparatively higher than the 0.25 A g−1 reported for the FePt nanoparticles supported on graphene by Guo et al. and others.17,21,35,36 However, Chen et al. has reported higher mass activity values for FePt nanoparticles prepared by a one pot synthesis that involves heating up to 160 °C although durability studies are available only for 750 cycles.37 Koutcheky–Levich (KL) plots obtained for FePtGO are presented in Fig. 3b. The ‘n’ values obtained from these plots are close to 4 suggesting a direct conversion of oxygen to water (eqn (1)). However, FePt supported on carbon has shown an ‘n’ value close to 3 indicating a partial formation of hydrogen peroxide as well (eqn (2)). The KL plots obtained for all three catalysts at 0.78 V are shown in Fig. S1c† for comparison. These results reveal the significant role played by the support in improving the 4 electron reduction of oxygen to water.
| O2 + 4H+ + 4e− → 2H2O | (1) |
| O2 + 2H+ + 2e− → H2O2 | (2) |
 | ||
| Fig. 3 (a) Linear sweep voltammograms obtained for FePtGO, FePtC and commercial PtC-TKK at a rotation rate of 2000 rpm (b) KL plots obtained for FePtGO catalyst at various potentials. | ||
The durability of FePt catalysts–support system has been a concern as the Fe particles corrode in the highly acidic operating conditions of PEFCs. We cycled the prepared catalysts between 1.1–0.6 V for 20![[thin space (1/6-em)]](https://www.rsc.org/images/entities/char_2009.gif) 000 cycles and the results presented in Fig. 4a evidently reveal the enhanced durability of FePtGO over FePtC and PtC-TKK. For example, after 10000 cycles FePtGO lost only 20% of its initial catalytic activity whereas PtC-TKK and FePtC lost 47% and 70% respectively. Even after 20000 cycles FePtGO retained 67% activity against 45% of PtC-TKK. The corresponding CVs obtained during stability tests are given in Fig. S2.† While the CVs of PtC-TKK and FePtGO retain their Pt peak features, the FePtC CV shows a significant reduction in Pt peaks suggesting Pt detachment from the carbon support along with peak position shift. The oxygen defect sites in RGO could have played a crucial role, as nucleating sites for Fe and in turn to Pt, in strongly binding the catalyst particles to the support. During electrochemical treatment, Pt is known to form a skin on the FePt catalyst surface that could further be attributed to the increased stability of FePtGO.38,39 However, no such enhancement in durability was observed with the FePtC catalyst. The reduced stability of the commercial catalyst could be attributed to the agglomeration of catalyst as many reports suggest. Polarization plots obtained from the electrochemical measurements shown in Fig. 4b reveal that FePtGO and PtC-TKK have better catalytic activity than FePtC. Further, the activation drop is significantly higher for FePtC than the other two catalysts.
000 cycles and the results presented in Fig. 4a evidently reveal the enhanced durability of FePtGO over FePtC and PtC-TKK. For example, after 10000 cycles FePtGO lost only 20% of its initial catalytic activity whereas PtC-TKK and FePtC lost 47% and 70% respectively. Even after 20000 cycles FePtGO retained 67% activity against 45% of PtC-TKK. The corresponding CVs obtained during stability tests are given in Fig. S2.† While the CVs of PtC-TKK and FePtGO retain their Pt peak features, the FePtC CV shows a significant reduction in Pt peaks suggesting Pt detachment from the carbon support along with peak position shift. The oxygen defect sites in RGO could have played a crucial role, as nucleating sites for Fe and in turn to Pt, in strongly binding the catalyst particles to the support. During electrochemical treatment, Pt is known to form a skin on the FePt catalyst surface that could further be attributed to the increased stability of FePtGO.38,39 However, no such enhancement in durability was observed with the FePtC catalyst. The reduced stability of the commercial catalyst could be attributed to the agglomeration of catalyst as many reports suggest. Polarization plots obtained from the electrochemical measurements shown in Fig. 4b reveal that FePtGO and PtC-TKK have better catalytic activity than FePtC. Further, the activation drop is significantly higher for FePtC than the other two catalysts.
 | ||
| Fig. 4 (a) Durability of the studied catalysts measured by the loss of ECSA against the cycle number. (b) Polarization data obtained for FePtGO, FePtC and PtC-TKK through RDE measurements. | ||
XPS results obtained for FePtGO are shown in Fig. 5a–d while additional XPS plots of FePtC, FeGO and FeC are given in Fig. S3–S5 and Table S1.† The C 1s spectrum of FePtGO reveals the presence of C![[double bond, length as m-dash]](https://www.rsc.org/images/entities/char_e001.gif) C, C–O and CO through peaks at 284.6, 286.7 and 288.4 eV respectively with ∼40% of carbon atoms attached to oxygen by either a single or double bond. This significantly proves the higher retention of functional groups in the RGO matrix along with TGA results where close to 15% weight loss is observed due to hydroxyl functional groups. The O 1s spectrum further reveals the presence of metal oxides (M–O) at 530.1 eV, carbonyl groups (CO) at 531.9 eV and ether type oxygen atoms at 533.3 eV indicating the large range of functional groups present in the RGO.40,41 The Fe 2p XPS spectrum reveals that most of the Fe is in the oxidized (Fe2+) state despite the double reduction procedure. FePt alloys with varying sizes and thin films have been reported to form Fe2+ even under air exposure through oxidation especially severe for small nanoparticles ca. 5 nm in size.42,43 Further, Pt(II) is also observed in small quantities in comparison to Pt(0) that suggests somewhat partial reduction. Interestingly, the amount of Fe observed through XPS analysis is significantly lower in the FePtGO in comparison to the TGA results. Since XPS is a surface analysis technique with an X-ray penetration of not more than 1 micro metre, it is not uncommon to observe differences between metal loading values obtained from XPS and TGA. TGA based values provide a more accurate analysis of total metal loading in such samples while XPS indicate the surface composition. However, to investigate this discrepancy in Fe content between the measurements, we analysed the energy dispersive spectroscopy (EDS) mapping of the samples and the images obtained are given in Fig. S6 and S7.† EDS mapping of FePtGO show a predominant coverage of Pt over Fe with Fe observed at Pt particles edges suggesting Fe might be buried under the Pt cover while FePtC show the presence of both Fe and Pt in equal amounts adjacent to each other. This could also explain the poor durability of FePtC as these exposed Fe particles can dissolve easily in the acidic electrolyte. Nevertheless, inductively coupled plasma-atomic emission spectroscopy would give the most reliable data on composition although we could not do it due to unavailability of the instrument in our lab. The level of Pt wt% observed through XPS is ∼25% which is lower than the weight percentage calculated from TGA results.
C, C–O and CO through peaks at 284.6, 286.7 and 288.4 eV respectively with ∼40% of carbon atoms attached to oxygen by either a single or double bond. This significantly proves the higher retention of functional groups in the RGO matrix along with TGA results where close to 15% weight loss is observed due to hydroxyl functional groups. The O 1s spectrum further reveals the presence of metal oxides (M–O) at 530.1 eV, carbonyl groups (CO) at 531.9 eV and ether type oxygen atoms at 533.3 eV indicating the large range of functional groups present in the RGO.40,41 The Fe 2p XPS spectrum reveals that most of the Fe is in the oxidized (Fe2+) state despite the double reduction procedure. FePt alloys with varying sizes and thin films have been reported to form Fe2+ even under air exposure through oxidation especially severe for small nanoparticles ca. 5 nm in size.42,43 Further, Pt(II) is also observed in small quantities in comparison to Pt(0) that suggests somewhat partial reduction. Interestingly, the amount of Fe observed through XPS analysis is significantly lower in the FePtGO in comparison to the TGA results. Since XPS is a surface analysis technique with an X-ray penetration of not more than 1 micro metre, it is not uncommon to observe differences between metal loading values obtained from XPS and TGA. TGA based values provide a more accurate analysis of total metal loading in such samples while XPS indicate the surface composition. However, to investigate this discrepancy in Fe content between the measurements, we analysed the energy dispersive spectroscopy (EDS) mapping of the samples and the images obtained are given in Fig. S6 and S7.† EDS mapping of FePtGO show a predominant coverage of Pt over Fe with Fe observed at Pt particles edges suggesting Fe might be buried under the Pt cover while FePtC show the presence of both Fe and Pt in equal amounts adjacent to each other. This could also explain the poor durability of FePtC as these exposed Fe particles can dissolve easily in the acidic electrolyte. Nevertheless, inductively coupled plasma-atomic emission spectroscopy would give the most reliable data on composition although we could not do it due to unavailability of the instrument in our lab. The level of Pt wt% observed through XPS is ∼25% which is lower than the weight percentage calculated from TGA results.
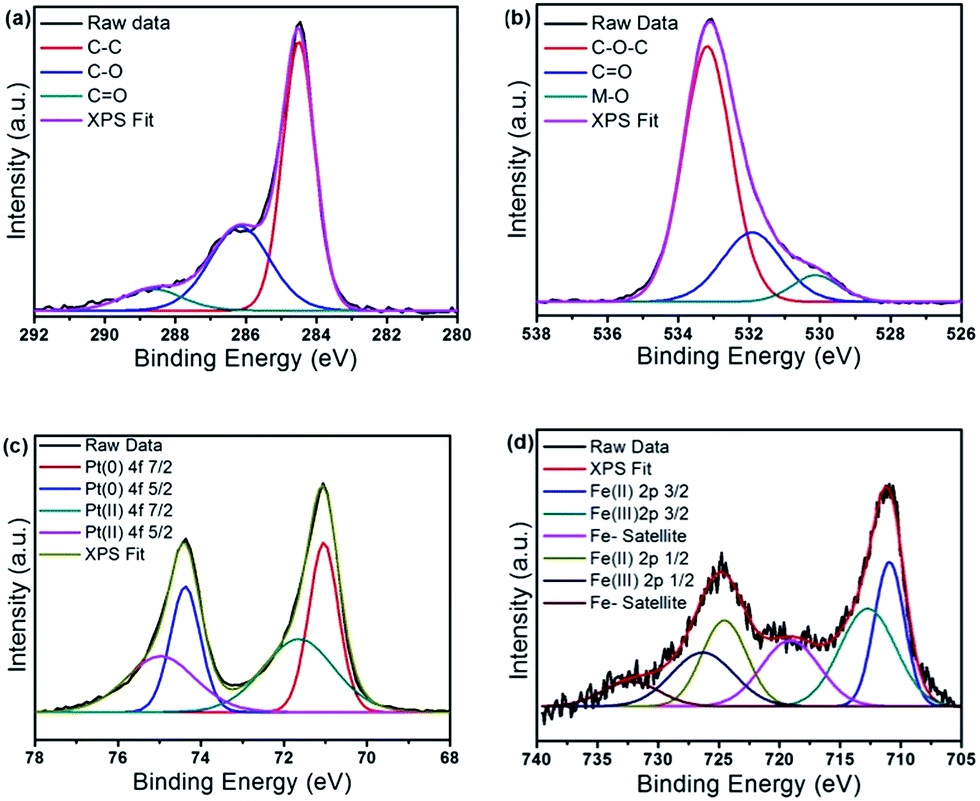 | ||
| Fig. 5 XPS obtained for FePtGO (a) C 1s (b) O 1s (c) Pt 4f and (d) Fe 2p revealing the presence of surface functional groups in RGO and Fe(II) and Pt(II) along with Pt(0). | ||
While the FePtGO catalyst prepared in this study is slightly bigger than the commercial PtC catalysts, it showed ∼160% improvement in mass activity over PtC towards ORR. Similarly, FePtGO's mass activity of 0.45 A g−1 is significantly higher than that of the ∼0.25 A g−1 obtained with G/FePts of 7 nm size which further involves the synthesis of FePt in a separate step at 220 °C followed by their assembly over the graphene support.17 Similarly, the one pot synthesis of FePt/RGO with ∼2 nm particle size also involved reducing the catalyst at 160 °C in an autoclave whereas FePtGO catalysts reported in this study are all prepared under room temperature conditions and are easy to scale up.37
We also studied the catalytic activity of FePtGO catalysts towards methanol oxidation reaction (MOR) as the residual hydroxyl group in rGO has been reported to improve the methanol tolerance of Pt based catalysts.22,23 Cyclic voltammograms obtained for these catalysts towards MOR are given in Fig. 6. PtRuC shows maximum conversion of methanol followed by PtC-TKK, FePtGO and FePtC. In general, the peak intensity observed in the forward scan suggests the amount of methanol oxidized while the reverse peak intensity indicates the oxidation of partially oxidized species that are attached to the catalyst surface (eqn (3) and (4)).
| Pt + CH3OH → δCO2 + δPt–COads + H2O | (3) |
| Pt–COads + OHads → Pt–H + CO2 | (4) |
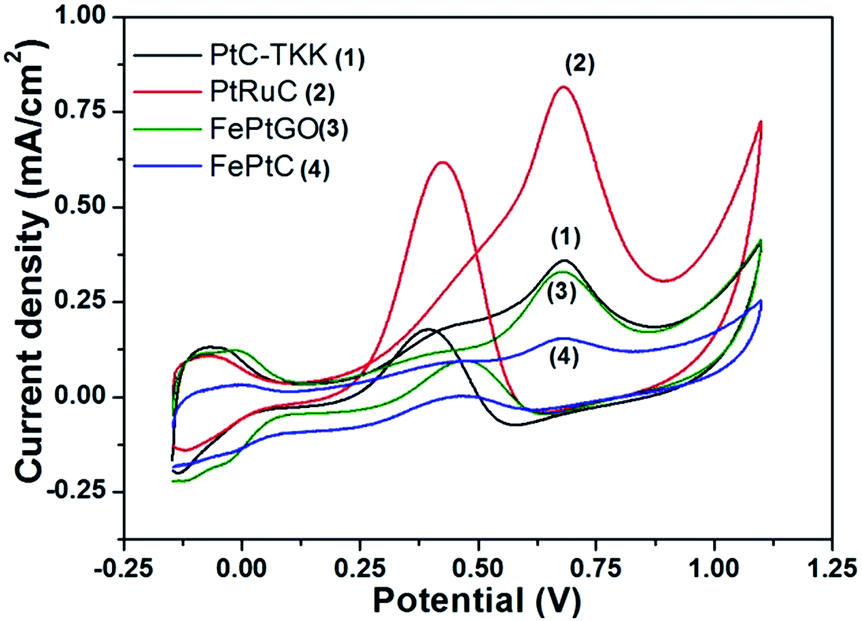 | ||
| Fig. 6 Cyclic voltammograms obtained for FePtGO, FePtC, PtC-TKK and PtRuC towards methanol oxidation at a scan rate of 100 mV s−1. | ||
The ratio between forward and reverse peak intensities normally indicates the tolerance of the catalyst towards CO poisoning.28 This is 2–3 times higher for the FePtGO catalyst than for PtRuC and PtC-TKK indicating a better tolerance towards CO despite poor catalytic activity towards methanol oxidation thus making it a suitable catalyst for ORR in DMFCs as well.
Conclusions
FePt nanoparticles supported on RGO have been successfully synthesized and studied for their catalytic activity towards ORR and MOR. The catalytic activity per ECSA is significantly higher for the alloy catalysts than the commercial PtC-TKK catalyst. RGO plays a crucial role in improving the catalytic activity of FePt nanoparticles with a direct 4e− reduction mechanism while FePt nanoparticles supported on carbon show a mixed two and four electron mechanisms. However, there is no significant improvement in catalytic activity towards MOR despite the presence of Fe and RGO. This is in contrast with reported results. Further experiments are needed to confirm this observation and also to study the role of RGO in improving the catalytic activity of FePt particles of sizes smaller than 4 nm.Acknowledgements
RK thanks the European Union Marie Skłodowska – Curie actions for funding this work through an FP7 fellowship (Project number 300983 – NECPEM). We also thank EPSRC and University of Leeds (LENNF) for TEM and XPS (Dr Benjamin Johnson) measurements.Notes and references
- J. D. Hughes, Nature, 2013, 494, 307 CrossRef CAS PubMed.
- M. Subhramannia, K. Ramaiyan and V. K. Pillai, Langmuir, 2008, 24, 3576 CrossRef CAS PubMed.
- S. Mukerjee and S. Srinivasan, J. Electroanal. Chem., 1993, 357, 201 CrossRef CAS.
- N. Markovic, H. Gasteiger and P. N. Ross, J. Electrochem. Soc., 1997, 144, 1591 CrossRef CAS PubMed.
- D. Wang, H. L. Xin, R. Hovden, H. Wang, Y. Yu, D. A. Muller, F. J. DiSalvo and H. D. Abruña, Nat. Mater., 2013, 12, 81 CrossRef CAS PubMed.
- J.-H. Jang, E. Lee, J. Park, G. Kim, S. Hong and Y.-U. Kwon, Sci. Rep., 2013, 3, 2872 Search PubMed.
- L. Zhang, R. Iyyamperumal, D. F. Yancey, R. M. Crooks and G. Henkelman, ACS Nano, 2013, 7, 9168 CrossRef CAS PubMed.
- C. Wang, N. M. Markovic and V. R. Stamenkovic, ACS Catal., 2012, 2, 891 CrossRef CAS.
- Y. Wu, Q. Shi, Y. Li, Z. Lai, H. Yu, H. Wang and F. Peng, J. Mater. Chem. A, 2015, 3, 1142 CAS.
- D. Deng, L. Yu, X. Chen, G. Wang, L. Jin, X. Pan, J. Deng, G. Sun and X. Bao, Angew. Chem., Int. Ed., 2013, 52, 371 CrossRef CAS PubMed.
- Y. Hu, J. O. Jensen, W. Zhang, L. N. Cleemann, W. Xing, N. J. Bjerrum and Q. Li, Angew. Chem., Int. Ed., 2014, 53, 3675 CrossRef CAS PubMed.
- N. Jha, P. Ramesh, E. Bekyarova, X. Tian, F. Wang, M. E. Itkis and R. C. Haddon, Sci. Rep., 2013, 3, 2257 Search PubMed.
- I. E. L. Stephens, A. S. Bondarenko, U. Gronbjerg, J. Rossmeisl and I. Chorkendorff, Energy Environ. Sci., 2012, 5, 6744 CAS.
- S. Zhang, Y. Shao, G. Yin and Y. Lin, J. Mater. Chem. A, 2013, 1, 4631 CAS.
- H.-L. Liu, F. Nosheen and X. Wang, Chem. Soc. Rev., 2015 10.1039/c4cs00478g.
- C. Wang, H. Daimon, T. Onodera, T. Koda and S. Sun, Angew. Chem., Int. Ed., 2008, 47, 3588 CrossRef CAS PubMed.
- S. Guo and S. Sun, J. Am. Chem. Soc., 2012, 134, 2492 CrossRef CAS PubMed.
- V. R. Stamenkovic, B. S. Mun, M. Arenz, K. J. J. Mayrhofer, C. A. Lucas, G. Wang, P. N. Ross and N. M. Markovic, Nat. Mater., 2007, 6, 241 CrossRef CAS PubMed.
- F. A. de Bruijn, V. A. T. Dam and G. J. M. Janssen, Fuel Cells, 2008, 8, 3 CrossRef CAS PubMed.
- S. Hsieh and P.-Y. Lin, J. Nanopart. Res., 2012, 14, 1 CrossRef.
- J. Kim, Y. Lee and S. Sun, J. Am. Chem. Soc., 2010, 132, 4996 CrossRef CAS PubMed.
- Z. Ji, G. Zhu, X. Shen, H. Zhou, C. Wu and M. Wang, New J. Chem., 2012, 36, 1774 RSC.
- Y. Li, W. Gao, L. Ci, C. Wang and P. M. Ajayan, Carbon, 2010, 48, 1124 CrossRef CAS PubMed.
- S. Bong, Y.-R. Kim, I. Kim, S. Woo, S. Uhm, J. Lee and H. Kim, Electrochem. Commun., 2010, 12, 129 CrossRef CAS PubMed.
- J.-J. Lv, S.-S. Li, A.-J. Wang, L.-P. Mei, J.-J. Feng, J.-R. Chen and Z. Chen, J. Power Sources, 2014, 269, 104 CrossRef CAS PubMed.
- L. Dong, R. R. S. Gari, Z. Li, M. M. Craig and S. Hou, Carbon, 2010, 48, 781 CrossRef CAS PubMed.
- M. Liu, R. Zhang and W. Chen, Chem. Rev., 2014, 114, 5117 CrossRef CAS PubMed.
- S. Sharma, A. Ganguly, P. Papakonstantinou, X. Miao, M. Li, J. L. Hutchison, M. Delichatsios and S. Ukleja, J. Phys. Chem. C, 2010, 114, 19459 CAS.
- I. Takahashi and S. S. Kocha, J. Power Sources, 2010, 195, 6312 CrossRef CAS PubMed.
- J. Zhu, T. Zhu, X. Zhou, Y. Zhang, X. W. Lou, X. Chen, H. Zhang, H. H. Hng and Q. Yan, Nanoscale, 2011, 3, 1084 RSC.
- W. Shi, J. Zhu, D. H. Sim, Y. Y. Tay, Z. Lu, X. Zhang, Y. Sharma, M. Srinivasan, H. Zhang, H. H. Hng and Q. Yan, J. Mater. Chem., 2011, 21, 3422 RSC.
- N. R. Wilson, P. A. Pandey, R. Beanland, R. J. Young, I. A. Kinloch, L. Gong, Z. Liu, K. Suenaga, J. P. Rourke, S. J. York and J. Sloan, ACS Nano, 2009, 3, 2547 CrossRef CAS PubMed.
- Z. Yan, M. Wang, J. Liu, R. Liu and J. Zhao, Electrochim. Acta, 2014, 141, 331 CrossRef CAS PubMed.
- W. Li, W. Zhou, H. Li, Z. Zhou, B. Zhou, G. Sun and Q. Xin, Electrochim. Acta, 2004, 49, 1045 CrossRef CAS PubMed.
- A. R. Malheiro, J. Perez and H. M. Villullas, J. Electrochem. Soc., 2009, 156, B51 CrossRef CAS PubMed.
- Y.-H. Chung, D. Y. Chung, N. Jung, H.-Y. Park, Y.-E. Sung and S. J. Yoo, Int. J. Hydrogen Energy, 2014, 39, 14751 CrossRef CAS PubMed.
- D. Chen, X. Zhao, S. Chen, H. Li, X. Fu, Q. Wu, S. Li, Y. Li, B.-L. Su and R. S. Ruoff, Carbon, 2014, 68, 755 CrossRef CAS PubMed.
- W. Chen, J. Kim, S. Sun and S. Chen, Langmuir, 2007, 23, 11303 CrossRef CAS PubMed.
- H. Igarashi, T. Fujino, Y. Zhu, H. Uchida and M. Watanabe, Phys. Chem. Chem. Phys., 2001, 3, 306 RSC.
- N. G. Akalework, C.-J. Pan, W.-N. Su, J. Rick, M.-C. Tsai, J.-F. Lee, J.-M. Lin, L.-D. Tsai and B.-J. Hwang, J. Mater. Chem., 2012, 22, 20977 RSC.
- A. Ganguly, S. Sharma, P. Papakonstantinou and J. Hamilton, J. Phys. Chem. C, 2011, 115, 17009 CAS.
- L. Han, U. Wiedwald, B. Kuerbanjiang and P. Ziemann, Nanotechnology, 2009, 20, 285706 CrossRef PubMed.
- P. N. Duchesne, G. Chen, X. Zhao, N. Zheng and P. Zhang, J. Phys. Chem. C, 2014, 118, 28861 CAS.
Footnote |
| † Electronic supplementary information (ESI) available: Detailed synthesis of graphene oxide, CV data and XPS results. See DOI: 10.1039/c5ra05418d |
| This journal is © The Royal Society of Chemistry 2015 |