NiO–ZrO2 nanocomposite modified electrode for the sensitive and selective determination of efavirenz, an anti-HIV drug

Neeta Thapliyala, Nadir S. E. Osmanb, Harun Patela, Rajshekhar Karpoormath*a, Rajendra N. Goyalc, Thomas Moyob and Rajkumar Pateld
aDepartment of Pharmaceutical Chemistry, College of Health Sciences, University of KwaZulu-Natal, Durban 4000, South Africa. E-mail: karpoormath@ukzn.ac.za; Fax: +27 31 260 7792; Tel: +27 31 260 7179
bSchool of Chemistry and Physics, University of KwaZulu-Natal, Westville campus, Durban 4000, South Africa
cDepartment of Chemistry, Indian Institute of Technology Roorkee, Roorkee 247667, India
dDivision of Physics & Semiconductor Science, Dongguk University, Seoul 100-715, South Korea

Received 25th March 2015 , Accepted 24th April 2015

First published on 27th April 2015


Abstract

The present study reports the synthesis of NiO–ZrO2 nanocomposites followed by their characterization using X-ray powder diffraction, high-resolution scanning electron microscopy, high-resolution transmission electron microscopy and energy dispersive X-ray spectroscopy. A new chemically modified glassy carbon electrode was fabricated based on the synthesized nanocomposite and used as a highly sensitive electrochemical sensor for the determination of efavirenz, an anti-HIV drug. The modification increased the effective surface area of the sensor ten times in comparison to the bare glassy carbon electrode. Cyclic voltammograms revealed that the modified electrode exhibits excellent electrocatalytic activity towards oxidation of the drug. The current displayed a wide linear response ranging from 0.01 to 10 μM with a detection limit of 1.36 nM. The effect of interferents on the peak current response was studied. The electrode displayed advantages such as simple preparation, appreciable stability, reproducibility and high sensitivity. The feasibility of the proposed method was successfully demonstrated by determining efavirenz in commercial pharmaceutical formulations and human urine samples.

1. Introduction

Efavirenz (EFV, Scheme 1) is a well-known human immunodeficiency virus (HIV) type 1 specific non-nucleoside reverse transcriptase inhibitor.1 Chemically, EFV (marketed as Sustiva) is known as 6-chloro-4-(2-cyclopropylethynyl)-4-(trifluoromethyl)-2,4-dihydro-1H-3,1-benzoxazin-2-one. The drug is a vital part of highly active antiretroviral therapy (HAART) and is usually prescribed in combination with other anti-HIV drugs for the management of the disease as a first line of treatment in HIV-infected patients.2 Approved by the FDA in 1998, EFV functions via suppressing reverse transcriptase activity by binding to the catalytic site of the enzyme, thus prohibiting it from transcribing viral RNA into DNA and infect more cells.3 It is a poorly water soluble BCS (Biopharmaceutics Classification System) class-II drug which metabolizes in the liver, and may interact with other liver-metabolized drugs necessitating change in the administered dose.4 Though well tolerated, EFV is associated with a range of mild to moderate adverse effects, which include skin rash, dizziness, headache, insomnia, light-headedness, impaired concentration, subclinical hearing loss, aggression, anxiety, hallucinations and depression.5–8 High level of drug overdose may induce toxicity with more pronounced side effects. Recently, reports on misuse of EFV for recreational purpose have surfaced due to its psychedelic effects allegedly similar to LSD.8 EFV analysis is thus considered essential for quality control, drug screening and to attain optimum therapeutic concentration, while minimizing the risk of overdosage. Hence, the development of a simple and sensitive method for the determination of EFV is of high importance and interest. Various chromatographic, spectrophotometric and spectrometric methods have been developed for the quantification of EFV.9–16 These methods are expensive and involve time-consuming derivatization steps. Electrochemical methods have attracted considerable interest in the field of drug analysis because of their simplicity, low cost, fast response and high sensitivity in detecting drugs without requiring tedious extraction or pre-treatment processes. However, to date only two electroanalytical methods have been reported for the analysis of the drug. Dogan-Topal et al. investigated the differential pulse voltammetric behavior of EFV at a dsDNA modified disposable pencil graphite electrode and quantified the drug in commercial tablets.17 Later, Castro et al. developed a differential pulse adsorptive stripping voltammetric method at the mercury film electrode to measure EFV concentration.18
image file: c5ra05286f-s1.tif
Scheme 1 Chemical structure of efavirenz.

The modification of conventional electrodes with nanoparticles has been the focus of attention in recent decades since it conveys unique physical and chemical properties of the nanoparticles to the electrode surface, exhibiting obvious advantages in the field of electroanalysis and electrocatalysis.19 In recent years, various transition metal oxide nanoparticles, such as zinc oxide, copper(II) oxide, nickel oxide and cobalt oxide, have been used for electrode fabrication in order to improve the selectivity and sensitivity of the electrochemical sensor. Among these, nickel oxide (NiO) is one of the most promising metal oxide nanoparticle having diverse applications in electrochemical supercapacitors, magnetic materials, electrocatalysis and biosensors due to its abundance, low cost, high electrical conductivity and exceptional catalytic activities.20,21 Zirconia (ZrO2) nanoparticles are also of great interest due to their appreciable chemical inertness, thermal stability, adaptable structure, high electrical conductivity along with the property to enhance strength and toughness leading to application in optics, catalysis, adsorption, catalytic support, sensors, electrical, thermal and magnetic fields of interest.22,23 It is well-known that the properties of nanoparticles could be effectively tuned by mixing two or more elements/oxides together. NiO and ZrO2 nanoparticles offer various functions for electroanalysis, with these nanoparticles being reported for their enhanced catalytic and conductivity properties owing to the nano dimensions that facilitate the electrical contact of redox-sites in analyte with the electrode surface. High probability of amplification of the electrochemical response in presence of both these nanoparticles motivated us to combine NiO and ZrO2 nanoparticles and use the nanocomposite to modify the electrode for detection of the analyte. Thus, the combination of NiO and ZrO2 nanoparticles provides an attractive approach to fabricate the electrode surface with an aim to achieve enhanced sensitivity and selectivity. The present work reports the synthesis and characterization of NiO–ZrO2 nanocomposite followed by its immobilization on the surface of a glassy carbon electrode (GCE) to develop a voltammetric sensor to determine the anti-HIV drug, EFV. The method displays a novel efficient protocol for the sensitive and selective quantification of the drug in real samples.

2. Experimental

2.1 Materials and reagents

Pure powdered EFV, NiO and ZrO2 was purchased from Sigma-Aldrich. Other chemicals used were of analytical grade and obtained from Merck. 0.1 M phosphate buffer solutions (PBS), used as a supporting electrolyte, were prepared by mixing solutions of Na2HPO4 and NaH2PO4 according to the method given by Christian and Purdy.24 Standard stock solution of EFV (1 mM) was prepared by dissolving it in pure methanol and stored in the dark when not in use. The solubility of EFV in water is relatively poor, i.e. <10 μg mL−1. In the reported study, the drug concentration was detected upto 10 μM, which is considerably less than <10 μg mL−1. Also, the standard stock solution of EFV was prepared in pure methanol, in which the drug was highly soluble, thus eliminating the chances of precipitation. Double distilled water was used throughout the experiments. Prior to each measurement, pure nitrogen gas was purged into the EFV containing solution for 5 min in order to remove dissolved oxygen from the solution.

2.2 Apparatus

The electrochemical experiments were performed using electrochemical analyzer (Model 800B Series, CH Instruments, Inc.) arranged in conjunction with a computer for data storage and processing along with a conventional three-electrode system. The three-electrode system comprised of an Ag/AgCl reference electrode, a platinum counter electrode and a bare/modified glassy carbon working electrode (3 mm diameter). All the three electrodes (working, reference and counter) were provided by CH Instruments, Inc. (USA). The pH of the buffer solutions was checked using CyberScan pH 510 bench pH meter (Eutech Instruments). The applicability of the proposed method for analysis of the drug in commercial pharmaceutical preparations was verified using a Shimadzu UV spectrophotometer (Model UV-1800, Shimadzu Corporation, Japan) with a quartz cell (optical path of 1 cm). Bruker D8 advance X-ray powder diffractometer (XRD) using CuKα radiation was used for X-ray diffraction measurement of the sample. High-resolution scanning electron microscopy (HRSEM) and high-resolution transmission electron microscopy (HRTEM) measurements were performed on a Carl Zeiss Ultra Plus ZEISS-FEG and Jeol_JEM-1010 instruments, respectively.

2.3 Synthesis of nanoparticles

The NiO–ZrO2 nanoparticles mixture was in mole proportion of 2[thin space (1/6-em)]:[thin space (1/6-em)]1 and produced from high purity metal oxides (NiO: 99% and ZrO2: 99%) by high energy mechanical milling in an atmosphere of air for 10 hours using a Retch planetary ball mill (type: PM 400) operated at 300 rpm. The ball to mass ratio in milling the sample was 10[thin space (1/6-em)]:[thin space (1/6-em)]1.

2.4 Preparation of modified electrode

Prior to the electrode modification, the GCE surface was cleaned by polishing with 0.05 mm alumina slurry on a polishing cloth until the surface had a shiny appearance. The polished electrode was then rinsed thoroughly with double-distilled water and then dried in air at room temperature. 5.0 μL of an aqueous suspension of the NiO–ZrO2 nanoparticles (0.02 mg mL−1) was drop coated onto the cleaned GCE surface and dried. A uniform adherent dark red coating of the synthesized nanoparticles was formed on the GCE surface and the resultant electrode was denoted as NiO–ZrO2/GCE.

2.5 Sample preparation

The commercially available EFV tablet was grounded to a homogeneous fine powder and then each of the pharmaceutical formulations (tablet and capsule powder) was diluted with methanol. Appropriate solutions were prepared by taking suitable diluted aliquots and the proposed procedure was applied for analysis of the drug in the respective pharmaceutical samples under similar conditions as used to attain the calibration plot.

The urine samples were obtained from laboratory personnel and diluted 100 times by phosphate buffer of pH 7.2, with the dilution process greatly reducing the matrix effect. The cyclic voltammetric method was then applied to quantify the drug in spiked human urine samples.

3. Results and discussion

3.1 Characterization of synthesized NiO–ZrO2 nanocomposite

Fig. 1 shows the XRD patterns for NiO–ZrO2 nanocomposite. The average crystallite size (D) was calculated from the highest peaks using the Scherrer formula: D = 0.9λ/(whkl[thin space (1/6-em)]cos[thin space (1/6-em)]θ), where whkl is the full-width at half-maximum of the highest intensity peaks, θ is the Bragg angle and λ is the wavelength of the XRD radiation.25 The average crystallite sizes are displayed in Fig. 1. There is contrast in the crystallite sizes among the NiO and ZrO2 nanocomposite particles. The average crystallite sizes of NiO appear to be greater than ZrO2. The morphology of the NiO nanoparticles, ZrO2 nanoparticles and the synthesized nanocomposite was studied using HRSEM and HRTEM, as depicted in Fig. 2 and 3, respectively. The NiO–ZrO2 nanocomposite shows a low degree of agglomeration since the boundaries between the particles are well-defined (Fig. 2(C)). Furthermore, it is anticipated that smaller particles represent ZrO2 particles whilst the larger ones show the average particle size of NiO. Fig. 3(D) displays the HRTEM images of NiO–ZrO2 nanocomposite in the magnification on a 10 nm scale. The image displays lattice fringes, which indicate that the particles are crystalline. Qualitatively, the elemental composition of the nanoparticles composite was determined by EDX, revealing the presence of only Ni, Zr and O2 in the sample, which is consistent with the composition of the starting materials. The EDX measurement for NiO–ZrO2 nanocomposite is depicted in Fig. 4. The nanoparticles do not interact chemically since no secondary phase was detected between NiO and ZrO2 nanoparticles. However, there are attractive forces such as van der Waals and electrostatic forces present between the particles that lead to their agglomeration.
image file: c5ra05286f-f1.tif
Fig. 1 XRD patterns of NiO–ZrO2 nanocomposite.

image file: c5ra05286f-f2.tif
Fig. 2 HRSEM images of (A) NiO, (B) ZrO2, (C) NiO–ZrO2 nanocomposite (low magnification) and (D) NiO–ZrO2 nanocomposite (high magnification).

image file: c5ra05286f-f3.tif
Fig. 3 HRTEM images of (A) NiO, (B) ZrO2, (C) NiO–ZrO2 nanocomposite (low magnification) and (D) NiO–ZrO2 nanocomposite (high magnification).

image file: c5ra05286f-f4.tif
Fig. 4 EDX image for NiO–ZrO2 nanocomposite.

3.2 Electrochemical behaviour of NiO–ZrO2/GCE

The electrochemical behaviour of NiO–ZrO2/GCE was investigated using potassium ferricyanide, K3[Fe(CN)6], as the redox probe. The cyclic voltammograms for the bare GCE, ZrO2 nanoparticles modified GCE (ZrO2/GCE), NiO nanoparticles modified GCE (NiO/GCE) and NiO–ZrO2/GCE were observed in the presence of 1 mM K3[Fe(CN)6] in 0.1 M KCl solution, exhibiting well-defined redox peaks, as depicted in Fig. 5(A). Both the ZrO2/GCE and NiO/GCE displayed an improved peak current response as compared to the bare electrode, with the latter also showing a slight reduction in peak potential (Ep). However, a significant increase in peak current accompanied with a noticeable shift in Ep was observed at the NiO–ZrO2/GCE, which suggests that the presence of the nanoparticles composite accelerate the rate of electron transfer at the electrode/electrolyte interface. This is attributed to the synergistic influence of NiO and ZrO2 nanoparticles leading to good stability, strong adherence, high surface area and superior electrical conductivity of the synthesized nanoparticles.
image file: c5ra05286f-f5.tif
Fig. 5 (A) Typical cyclic voltammograms of 1 mM K3[Fe(CN)6] in 0.1 M KCl solution at (a) bare GCE, (b) ZrO2/GCE, (c) NiO/GCE and (d) NiO–ZrO2/GCE at a scan rate of 50 mV s−1. (B) Cyclic voltammograms of 1 mM K3[Fe(CN)6] in 0.1 M KCl solution at various scan rates (5 mV s−1 to 250 mV s−1) using NiO–ZrO2/GCE. The inset shows the plot of dependence of ip on v1/2 at NiO–ZrO2/GCE.

To determine the electroactive surface area (A) of NiO–ZrO2/GCE, cyclic voltammograms of 1 mM K3[Fe(CN)6] in 0.1 M KCl solution were recorded at varying scan rates (Fig. 5(B)). A was determined using the Randles–Sevcik equation:26 ip = 2.69 × 10⁵n3/2AD1/2Cv1/2, where ip is the peak current (in amperes), n is the number of electrons transferred, C is the concentration of the electroactive species (in mol cm−3), v is the scan rate (in V s−1), D is the diffusion coefficient (in cm2 s−1), which is 7.6 × 10⁻⁶ cm2 s−1 for [Fe(CN)6]3−. Based on the slope of the ipa versus v1/2 plot (inset of Fig. 5(B)), the effective surface area of the modified electrode was calculated to be 0.651 cm2, which is almost ten times more than that at bare GCE.

3.3 Electrochemical behavior of EFV at NiO–ZrO2/GCE

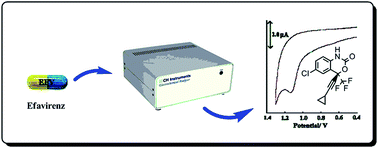
The electrochemical behavior of 10 μM EFV at bare electrode and NiO–ZrO2/GCE was investigated at physiological pH of 7.2 using cyclic voltammetry (CV), with a weak irreversible oxidation peak being observed at 1.2 V at bare GCE. However, under similar conditions and using the modified electrode in the same solution, a well-defined oxidation peak was noticed at 1.1 V. The enhanced peak current response along with a simultaneous negative shift in peak potential clearly indicate that the NiO–ZrO2 nanoparticle composite expresses strong electrocatalytic activity towards EFV oxidation. This is attributed to the increased surface area and improved conductivity provided by the nanocomposite leading to a significant increase in the electron transfer. Cyclic voltammograms obtained for electrochemical oxidation of 10 μM EFV are illustrated in Fig. 6(A). Since no peak was noticed in the reverse scan, it suggests that the electrode process is irreversible in nature.
image file: c5ra05286f-f6.tif
Fig. 6 (A) Cyclic voltammograms observed (a) in absence of EFV at NiO–ZrO2/GCE and in presence of 10 μM EFV at (b) bare GCE and (c) NiO–ZrO2/GCE in 0.1 M PBS (pH 7.2) at a scan rate of 100 mV s−1; (B) observed dependence of peak current on scan rate for 10 μM EFV at pH 7.2; (C) variation of the logarithm of peak current with the logarithm of scan rate; (D) plot of Ep vs. logarithm of scan rate for 10 μM EFV at pH 7.2.

The influence of scan rate on the voltammetric response of EFV was investigated at the modified electrode under similar experimental conditions. The ip was found to be proportional to v in the range of 5 mV s−1 to 250 mV s−1 (Fig. 6(B)), with the linear equation being ip = 0.019v + 0.1274 (R2 = 0.9969), indicating an adsorption-controlled electrochemical process.27 This is further confirmed by plotting log[thin space (1/6-em)]ip against log[thin space (1/6-em)]v (Fig. 6(C)) that exhibited a straight line with a slope of 0.9, which is close to the theoretical value of 1.0 for an ideal adsorption-controlled process.28 It was also observed that the Ep shifted towards more positive values with an increase in scan rate (Fig. 6(D)), confirming the irreversibility of the oxidation process.29 The linear relationship between Ep and log[thin space (1/6-em)]v is represented by the following equation: Ep = 0.0485[thin space (1/6-em)]log[thin space (1/6-em)]v + 1.0334, with a correlation coefficient of 0.9957.

According to Laviron, for an irreversible electrode process, Ep can be expressed by the following equation, image file: c5ra05286f-t1.tif, where α is the transfer coefficient, k0 is the standard heterogeneous rate constant of the reaction, E0′ is the formal redox potential.30 The other mentioned symbols have their usual meanings. Thus, the value of αn can be calculated from the slope of Ep versus log[thin space (1/6-em)]v by considering T = 298 K, R = 8.314 J K−1 mol−1, and F = 96[thin space (1/6-em)]480 C mol−1. The αn value was then employed to calculate n using the equation, image file: c5ra05286f-t2.tif mV, where Ep/2 is the half-peak potential.31 The number of electrons exchanged (n) was found to be one suggesting that one electron was involved in the oxidation of EFV at NiO–ZrO2/GCE.

3.4 Influence of pH

The effect of pH on electro-oxidation of 5 μM EFV at NiO–ZrO2/GCE in 0.1 M PBS was investigated with pH values ranging from 4.0 to 11.0. It was observed that the Ep shifted negatively with increase in the pH value. A linear relationship was observed between Ep and pH, which was expressed by the equation: Ep (mV) = 1.549–0.0597 pH, with a correlation coefficient of 0.9911.

A slope value of 0.0597 V pH−1 was obtained, which is almost equal to the theoretical Nernstian value characteristic for an electrode reaction involving same number of electrons and protons.32 This suggests that equal number of protons and electrons participate in the electro-oxidation of the drug. It is anticipated that the oxidation of the nitrogen atom occurs, involving one electron and one proton and producing a free radical species, as depicted in Scheme 2.


image file: c5ra05286f-s2.tif
Scheme 2 Proposed electro-oxidation mechanism of EFV.

3.5 Analytical performance

Under optimum experimental conditions, the anodic peak current (peak height) was found to have a linear relationship with EFV concentration in the range 1.0 × 10⁻⁸ to 1.0 × 10⁻⁵ mol L−1 (Fig. 7) and the linear regression equation is expressed as: ip (μA) = 220.49C, with a correlation coefficient of 0.9989, and where C is the concentration of EFV in mM. The detection limit for the determination of EFV was calculated to be 1.36 nM (based on three times signal-to-noise ratio). The proposed method exhibited wide linear range, high sensitivity and low detection limit.
image file: c5ra05286f-f7.tif
Fig. 7 Calibration plot observed for EFV at NiO–ZrO2/GCE at pH 7.2.

The stability of NiO–ZrO2/GCE was investigated by storing the electrode for 15 days and later using it to determine 10 μM EFV. A slight decrease in the peak current was observed with a relative standard deviation (RSD) of 3.6% suggesting that the modified electrode has good stability. The reproducibility of NiO–ZrO2/GCE was checked by analysing the voltammetric response of 10 μM EFV using six electrodes prepared independently and the RSD was found to be 2.7%. Minute variation in ip was observed when six replicate measurements were recorded for 10 μM EFV using the same electrode (RSD = 2.11%). These results indicate that the modified electrode possesses significant stability, reproducibility and repeatability.

3.6 Interferences

In order to evaluate the selectivity of the proposed method, the influence of some common interfering species on the determination of 10 μM EFV in pH 7.2 PBS was investigated. The tolerance limit was considered as the maximum concentration of the interferents causing ±5% variation in the peak current of the drug. No noticeable change in ip was observed in the presence of 500 fold excess of Mg2+, Na+, K+, NH4+, NO3, glucose, citric acid, oxalic acid, glucose or caffeine. A 25 fold excess of ascorbic acid and uric acid also did not affect the voltammetric response of the drug. These results indicate that the proposed method had appreciable selectivity and could be applied for the determination of EFV in real samples.

3.7 Sample analysis

In order to evaluate the practical utility of the proposed method, the amount of EFV was quantified in three commercial pharmaceutical samples, one 600 mg tablet and two (50 mg and 200 mg) capsules. UV spectrophotometry was employed as the reference technique. Prior to the determination of EFV, the samples were dissolved in methanol and then diluted by water, so that the concentration of the drug was in the working concentration range. Cyclic voltammograms were then recorded using NiO–ZrO2/GCE. The results were found to be accurate and in good agreement with the claimed amount stated by the manufacturer (as demonstrated in Table 1). It was also observed that presence of excipients in the tablet did not interfere in the quantification of the drug. Thus, the proposed method presented good accuracy and precision for determination of EFV in pharmaceutical preparations.
Table 1 Determination of EFV in pharmaceutical preparations at NiO–ZrO2/GCE and using UV-visible spectrophotometerb
Sample Stated content (g per tablet) Detected content (g per tablet) Bias valuea R.S.D. (%) (n = 3)
Proposed methoda Reference methodb Proposed methoda Reference methodb
a Using NiO–ZrO2/GCE.b Using UV-visible spectrophotometer.    
Capsule-1 0.050 0.049 0.048 −0.001 1.22 0.88
Capsule-2 0.200 0.197 0.204 −0.003 1.47 1.70
Tablet 0.600 0.602 0.602 +0.002 1.03 0.75


Analytical utility of NiO–ZrO2/GCE was also examined for drug analysis in two human urine samples. Urine samples were spiked with different quantities of EFV and the recovery study of the drug was then performed using the standard addition method. The observed results of the recovery studies are summarized in Table 2. The recovery rates of the spiked samples were found to be between 97.6 and 102.8%, indicating that the accuracy of the proposed method is excellent. Fig. 8 depicts the cyclic voltammograms of blank and EFV spiked human urine (sample 1), where the peak at 1.1 V is due to the presence of EFV, while the peak at ∼0.4 V suggests the existence of uric acid in the sample, eventually establishing that the presence of biological substances in urine did not interfere in the determination of the drug. Hence, it is clear that NiO–ZrO2/GCE has great potential for the determination of EFV in human body fluids. A comparison of the electrochemical methods reported to determine EFV (depicted in Table 3) indicates that the proposed method is superior to other methods, particularly in terms of detection limit and practical analytical applicability.

Table 2 Recovery results obtained for EFV in human urine sample at NiO–ZrO2/GCE
Sr. no. Added (μM) Found (μM) Bias value (μM) Recoveries (%)
Sample 1 Sample 2 Sample 1 Sample 2 Sample 1 Sample 2 Sample 1 Sample 2
1 1.00 1.00 0.984 0.976 −0.016 −0.024 98.4 97.6
2 3.00 3.00 2.980 3.030 −0.020 +0.030 99.3 101.0
3 5.00 5.00 4.990 5.020 −0.010 +0.020 99.8 100.4
4 7.00 7.00 7.080 7.200 +0.080 +0.200 101.1 102.8
5 10.00 10.00 9.890 10.100 −0.110 +0.100 98.9 101.0


image file: c5ra05286f-f8.tif
Fig. 8 Cyclic voltammograms of (a) blank urine sample 1 and (b) urine sample 1 spiked with 10 μM standard solution of EFV, other conditions being same as in Fig. 6A.
Table 3 A comparison of electrochemical methods reported for determination of EFVa
Electrode Concentration range (in M) LOD (in M) Applicability Ref. no.
a LOD: limit of detection; PGE: pencil graphite electrode; dsDNA/PGE: dsDNA modified PGE; TFME: thin film mercury electrode; NiO–ZrO2/GCE: NiO–ZrO2 mixed nanoparticles modified glassy carbon electrode; N/R: not reported.
PGE 5.70 × 10⁻⁸ to 8.11 × 10⁻⁶ 1.33 × 10⁻⁸ In pharmaceutical preparations 17
dsDNA/PGE 6.33 × 10⁻⁶ to 7.60 × 10⁻⁵ 1.90 × 10⁻⁶ In pharmaceutical preparations 17
TFME 3.17 × 10⁻⁸ to 7.92 × 10⁻⁷ 3.00 × 10⁻⁹ N/R 18
NiO–ZrO2/GCE 1.00 × 10⁻⁸ to 1.00 × 10⁻⁵ 1.36 × 10⁻⁹ In pharmaceutical preparations and human urine Present work


4. Conclusion

A simple and sensitive voltammetric sensor for determination of EFV using NiO–ZrO2/GCE was developed. The increase in peak current at modified sensor is assigned to electrocatalytic activity and can be attributed to the combined effects of the high surface area and conductivity of NiO and ZrO2 nanoparticles in the nanocomposite. The tentative oxidation mechanism of EFV was suggested by electrochemical studies. The proposed method displayed high sensitivity, selectivity and a low detection limit. The modified electrode was then successfully applied for determination of EFV in pharmaceutical preparations and human urine samples. The NiO–ZrO2/GCE can thus be considered as a novel and promising tool for the electrochemical analysis of a range of analytes, including EFV.

Acknowledgements

Neeta Thapliyal is grateful to the Department of Pharmaceutical Chemistry, College of Health Sciences, University of KwaZulu-Natal, South Africa, for financial support. The authors would like to thank King Edward Hospital Pharmacy, Durban, South Africa for providing the pharmaceutical samples.

References

  1. S. D. Young, S. F. Britcher, L. O. Tran, L. S. Payne, W. C. Lumma, T. A. Lyle, J. R. Huff, P. S. Anderson, D. B. Olsen and S. S. Carroll, Antimicrob. Agents Chemother., 1995, 39, 2602–2605 CrossRef CAS.
  2. S. Sungkanuparph, A. Vibhagool, P. Mootsikapun, P. Chetchotisakd, S. Tansuphaswaswadikul, C. Bowonwatanuwong and W. Chantratita, J. Acquired Immune Defic. Syndr., 2003, 33, 118–119 CrossRef PubMed.
  3. E. J. Arts and D. J. Hazuda, Cold Spring Harbor Perspect. Med., 2012, 2, 1–23 Search PubMed.
  4. I. F. Metzger, T. C. Quigg, N. Epstein, A. O. Aregbe, N. Thong, J. T. Callaghan, D. A. Flockhart, A. T. Nguyen, C. K. Stevens, S. K. Gupta and Z. Desta, Curr. Ther. Res., 2014, 76, 64–69 CrossRef CAS PubMed.
  5. P. D. C. Leutscher, C. Stecher, M. Storgaard and C. S. Larsen, Scand. J. Infect. Dis., 2013, 45, 645–651 CrossRef CAS PubMed.
  6. K. Khoza-Shangase, J. Pharm. BioAllied Sci., 2011, 3, 142–153 CrossRef PubMed.
  7. D. A. Cooper, J. Heera, P. Ive, M. Botes, E. Dejesus, R. Burnside, N. Clumeck, S. Walmsley, A. Lazzarin, G. Mukwaya, M. Saag and E. van Der Ryst, AIDS, 2014, 28, 717–725 CrossRef CAS PubMed.
  8. M. B. Gatch, A. Kozlenkov, R. Q. Huang, W. Yang, J. D. Nguyen, J. Gonzalez-Maeso, K. C. Rice, C. P. France, G. H. Dillon, M. J. Forster and J. A. Schetz, Neuropsychopharmacology, 2013, 38, 2373–2384 CrossRef CAS PubMed.
  9. S. Ramesh, S. Alexandar and S. Muniyappan, World J. Pharm. Pharm. Sci., 2013, 2, 2003–2010 CAS.
  10. B. Prathap, A. Dey and G. H. S. Rao, J. Global Trends Pharm. Sci., 2014, 5, 1634–1640 CAS.
  11. R. Heydari, M. Rashidipour and N. Naleini, Curr. Anal. Chem., 2014, 10, 280–287 CrossRef CAS.
  12. Y. A. Kumar and N. R. Rao, J. Chem., 2010, 7, 856–860 Search PubMed.
  13. S. B. Gurav, D. Prakash, A. N. Deshpande and S. D. Walsangikar, Asian J. Res. Chem., 2011, 4, 754–756 Search PubMed.
  14. A. Smith, G. Maruthi, A. Velmurugan and S. Parimalakrishnan, Chem. Sin., 2013, 4, 144–149 Search PubMed.
  15. A. Theron, D. Cromarty, M. Rheeders and M. Viljoen, J. Chromatogr. B: Anal. Technol. Biomed. Life Sci., 2010, 878, 2886–2890 CrossRef CAS PubMed.
  16. P. Srivastava, G. S. Moorthy, R. Gross and J. S. Barrett, PLoS One, 2013, 8, 1–9 CrossRef.
  17. B. Dogan-Topal, B. Uslu and S. A. Ozkan, Biosens. Bioelectron., 2009, 24, 2358–2364 CrossRef CAS PubMed.
  18. A. Castro, M. V. N. de Souza, N. A. Rey and P. A. M. Farias, J. Braz. Chem. Soc., 2011, 22, 1662–1668 CAS.
  19. C. M. Sanchez-Sanchez, J. Solla-Gullon and V. Montiel, Electrochemistry, 2013, 11, 34–70 CAS.
  20. A. Maringa, T. Mugadza, E. Antunes and T. Nyokong, J. Electroanal. Chem., 2013, 700, 86–92 CrossRef CAS PubMed.
  21. R. S. Babu, P. Prabhu and S. S. Narayanan, Talanta, 2013, 110, 135–143 CrossRef PubMed.
  22. X. M. Huang, R. Yuan, Y. Q. Chai and J. F. Wang, Chem. Res. Appl., 2009, 21, 1687–1692 CAS.
  23. J. Qu, Y. Wang, J. Guo, T. Lou and Y. Dong, Anal. Lett., 2014, 47, 2537–2547 CrossRef CAS PubMed.
  24. G. D. Christian and W. C. Purdy, J. Electroanal. Chem., 1962, 3, 363–367 CAS.
  25. M. G. Naseri, E. B. Saion, H. A. Ahangar, M. Hashim and A. H. Shaari, J. Magn. Magn. Mater., 2011, 323, 1745–1749 CrossRef PubMed.
  26. B. Rezaei and S. Damiri, Sens. Actuators, B, 2008, 134, 324–331 CrossRef CAS PubMed.
  27. E. Laviron, A. Vallat and R. Maunier-Prest, J. Electroanal. Chem., 1994, 379, 427–435 CrossRef.
  28. D. K. Gosser, in Cyclic Voltammetry: Simulation and Analysis of Reaction Mechanisms, VCH, New York, 1993, p. 43 Search PubMed.
  29. J. I. Gowda and S. T. Nandibewoor, Asian J. Pharm. Sci., 2014, 9, 42–49 CrossRef PubMed.
  30. E. Laviron, J. Electroanal. Chem., 1979, 101, 19–28 CrossRef CAS.
  31. A. J. Bard and L. R. Faulkner, in Electrochemical methods: fundamentals and applications, Wiley, New York, 2nd edn, 2004, p. 236 Search PubMed.
  32. L. Fotouhi, M. Fatollahzadeh and M. M. Heravi, Int. J. Electrochem. Sci., 2012, 7, 3919–3928 CAS.

This journal is © The Royal Society of Chemistry 2015
Click here to see how this site uses Cookies. View our privacy policy here.