Sagar Ganguli,
Chanchal Hazra,
Tuhin Samanta and
Venkataramanan Mahalingam*
Department of Chemical Sciences, Indian Institute of Science Education and Research (IISER), Mohanpur, Kolkata, West Bengal 741252, India. E-mail: mvenkataramanan@yahoo.com
First published on 13th May 2015
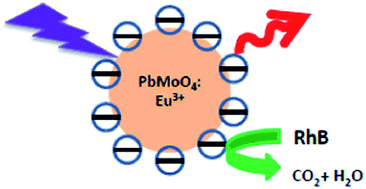
In this article, we have shown a synthetic strategy to prepare ligand-free colloidal Eu3+-doped PbMoO4 nanocrystals that form a stable dispersion in polar solvents. The surface of the nanocrystals is designed to have excess residual ions (Pb2+ or MoO42−) compared to the counter-ionic species, thereby providing a partially charged nanocrystal surface. These charged nanocrystal surfaces cause electrostatic repulsion, providing colloidal stability in polar solvents. Microscopic measurements suggest the formation of spherical shaped nanocrystals with an average size of 10 nm. Upon UV excitation, aqueous dispersions of the Eu3+-doped PbMoO4 nanocrystals display intense red emission characteristic of Eu3+ ions. Furthermore, under UV irradiation, the nanocrystals exhibit strong photocatalytic activity, which is verified from the degradation of rhodamine B dye. The rhodamine B dye is significantly degraded by ∼70% under UV illumination within 3 h at pH 5.5. The strong luminescence efficiency and photocatalytic activity make the water dispersible Ln3+-doped PbMoO4 nanocrystals a potential material for dual applications like luminescence and photocatalysts.
Synthesis of colloidal Ln3+-doped NCs are generally achieved using capping ligands with various functional groups like COOH, PO42−, SO42− etc.14 The ligands play a dual role such as controlling the size as well as enhancing the dispersibility of the NCs in various solvents. However, the presence of strong vibrational modes of the ligands such as C–H, O–H or N–H can in principle enhance the non-radiative relaxation of excited Ln3+ ions leading to reduction in luminescence efficiency. Moreover, for photocatalytic applications, the capping ligands act as an inhibitor as they reduce the chances of electron and hole transfers from the catalyst to oxygen or substrate. To overcome these problems, a post synthesis modification of the nanocrystal surface is generally performed to get rid of the insulating ligands prior to their use in electronic and optoelectronic devices.15–20 This process could be tedious as the ligand removal may lead to particle coagulation. An alternative to this technique is to prepare partially charged surfaces using non-stoichiometric amount of precursors. The residual charge on the NCs' surface will assist to prepare stable colloidal solutions in polar solvents (by electrostatic interaction). Similar concept of colloidal stabilization was first reported more than a century ago when I− ions were employed to stabilize AgI colloids.21 Recently, Nag et al. have reported the synthesis of ligand free metal sulfide NCs following the same approach.22 Addition of non-stoichiometric amount of precursors generated a nanocrystal surface bearing excess of sulfide (CdS1+x) ions leading to negatively charged nanocrystal surface. Most of the studies on ligand free nanocrystal synthesis were restricted to semiconductors. However, such studies are not much explored to prepare other NCs, particularly Ln3+-doped oxide NCs which can be challenging. For example, Rao et al. have extensively investigated the photocatalytic activity of electron rich and electron deficient TiO2–graphene composites without ligands. They have correlated the results with the nature of interaction between the composites and adsorbed dye molecules.23 The same group has also investigated the role of defects on laser excited photoluminescence of various ZnO nanostructures.24 Our idea is to develop synthetic routes to prepare ligand free oxide NCs which can be used for luminescent as well as photocatalytic applications. We have chosen PbMoO4 for this purpose.
Among the various molybdates, PbMoO4 has drawn much attention due to their wide use in optical instrument engineering, photoconductivity, etc.25,26 The lower band gap energy of PbMoO4 nanomaterials compared to other metal molybdates make them potential candidate for UV light induced photocatalytic activity and water splitting applications.27 There are quite a few reports available on the synthesis of PbMoO4 via high temperature solid-state methods.28 In recent years, few solution-phase routes have been employed to synthesize PbMoO4 nanomaterials and microcrystals. For example, Uresti et al. have investigated the photocatalytic activity of PbMoO4 NCs prepared through microwave procedure. The material prepared through this method shows better photocatalytic activity than the one prepared from solid state method. The same group investigated the effect of pH on the photocatalytic activity of PbMoO4 NCs. The as synthesized photocatalyst achieved degradation of 30% for rhodamine B (RhB) dye at pH 5.5, while at pH 4, dye degradation was recorded close to 100%.29 Shen et al. have reported a facile CTAB-assisted hydrothermal process to prepare PbMoO4 microcrystals with preferentially exposed (001) facets.30
In this article, we report the synthesis of water dispersible ligand free Eu3+-doped PbMoO4 NCs using microwave procedure for the first time. The water dispersibility is achieved through preparation of non-stoichiometric surfaces. Excess residual ions on the surface of the nanocrystal cause repulsive interaction between the NCs, thereby providing colloidal stability. These NCs show intense luminescence signals in water. Furthermore, the NCs display strong photocatalytic activity, which is verified through the degradation of RhB dye. We observed ∼70% degradation of RhB under UV illumination at pH 5.5. The intense luminescence together with photocatalytic activity of the Eu3+-doped PbMoO4 NCs make them potential materials for dual applications.
The photocatalytic activity of all three PbMoO4 NCs were evaluated by degradation of RhB dye under UV irradiation using a Xe lamp (Newport, Standford) with 140 W power (70 mA). In each experiment, 50 mg of photocatalyst was added into 50 ml of RhB solution with a concentration of 5 × 10⁻⁵ mol l−1. Prior to irradiation, the suspensions were stirred in dark for 30 min to reach adsorption–desorption equilibrium, following which, the dispersions were exposed to radiation using a solar simulator with continuous magnetic stirring. At regular irradiation time interval, a 3 ml aliquot of the suspension was collected, and the slurry samples, including the photocatalyst and RhB solution, were centrifuged (6000 rpm, 5 min) to remove the photocatalyst particles in order to assess the rate of decolourization and degradation photometrically. The solutions were analyzed by a Hitachi UV-4100 UV-Vis-NIR spectrophotometer, and the characteristic absorption of RhB at 554 nm was used to monitor the photocatalytic degradation. For comparative studies, photocatalytic experiments were carried out with undoped PbMoO4, La3+ doped PbMoO4 and TiO2 (P25) following the same procedure. All measurements were carried out at room temperature.
![]() | ||
Fig. 1 XRD patterns of PbMoO4 nanocrystals: (green) Pb80, (red) Pb95, (blue) Pb110, (cyan) undoped PbMoO4, (pink) La3+ doped PbMoO4 and (black) the standard pattern. |
The average crystallite sizes of all Eu3+-doped PbMoO4 NCs were calculated using Debye–Scherrer equation, D = 0.9λ/(βcos
θ), where D denotes the average crystallite size, λ (=1.5418 Å) is the wavelength of incident X-ray, β is the corrected full width half-maxima (FWHM) and θ is the diffraction angle for the (hkl) plane. The crystallite sizes obtained for Pb80, Pb95, Pb110, undoped PbMoO4 and La3+ doped PbMoO4 samples are 11 nm, 9 nm, 10.4 nm, 8.8 nm and 9.2 nm, respectively. The tetragonal structure of PbMoO4 NCs is also evident from the basic unit cell crystal structure shown in Fig. 2a, which was obtained using VESTA program.33 In the PbMoO4 crystal structure, the Pb2+ ions occupy octahedral positions and Mo6+ atoms are in the centre of slightly distorted tetrahedra MoO42−.
![]() | ||
Fig. 2 (a) Tetragonal crystal structure of Eu3+ doped PbMoO4 NCs created using VESTA program. SEM images of (b) Pb80, (c) Pb95 and (d) Pb110, indicating spherical morphology. |
FE-SEM images revealed formation of spherical NCs in all three cases. However, Pb80 and Pb110 form highly monodisperse solutions while Pb95 mostly stays in aggregated form. Fig. 2b suggests the formation of spherical NCs with an average size of 13 nm for Pb80 sample. In the case of Pb95 and Pb110 samples, the corresponding values are 9 and 12 nm, respectively (shown in Fig. 2c and d). The high monodispersity in the size is further substantiated by the narrow distribution obtained with DLS measurements in water (Fig. S1†). The hydrodynamic size of the NCs obtained from the DLS measurements are about 20 and 18 nm for Pb80 and Pb110 NCs, respectively and thereby supports the SEM results.
To check the colloidal stability of the NCs in polar solvents, 5 mg of each sample was added to 5 ml of formamide (dielectric constant, ε = 106) separately and sonicated for one hour. The resulting mixtures were left undisturbed to investigate their colloidal stability. The digital images (shown in Fig. 4a) reveal that, within one hour Pb95 NCs settle down, as a result of which, the letters in the back side of the vial becomes visible through the solvent. The other two samples (Pb80 and Pb110) show good colloidal stability. Similar trend in colloidal stability was also observed when the NCs were dispersed in water (ε = 80).
It is interesting to note that addition of non-stoichiometric amount of precursors (e.g. Pb2+ and MoO42−) gives rise to the formation of charged nanocrystal surface. The presence of non-stoichiometric amounts of Pb2+ and MoO42− in Pb80 and Pb110 were verified from EDS analysis (shown in Fig. S2†). In case of Pb80, as the atomic percentage of MoO42− is more than that of Pb2+ (shown in Fig. S2a†), a negatively charged surface is generated, which is experimentally verified by a negative zeta potential value of −20 mV. Similarly, for Pb110, excess atomic percentage of Pb2+ than MoO42− (shown in Fig. S2c†) produces a positively charged surface, which is further characterised by a positive zeta potential value of +18 mV. Similar results of lower colloidal stability for positively charged surface than the negatively charged ones was reported for CdS NCs.22 The atomic percentage of both Pb2+ and MoO42− are almost same in Pb95 (shown in Fig. S2b†) and as a result, its zeta potential value was found to be −0.10 mV. The zeta potential measurements for all the samples are shown in Fig. S3.†
The ligand free nature of the PbMoO4 NCs was verified by performing TGA and FTIR analysis (shown in Fig. S4 and S5,† respectively). Upon heating, PbMoO4 NCs lose less than 3% weight upto 500 °C temperature. We believe this negligible weight loss is due to the evaporation of residual formamide which was used as solvent in the microwave procedure. IR spectra of all three NCs show peaks near 1630, 1390 and 570 cm−1, which belong to CO stretching, C–H bending and torsion, respectively of formamide molecule. This indicates that formamide is indeed present in all three samples. However, the peaks of formamide are very weak in comparison to PbMoO4 peaks. This along with TGA data confirm that very small amount of formamide is likely present in the products. Very small shifts of formamide peaks in the NCs suggest that they are loosely bound on the nanoparticle surface. These results indicate that formamide is very unlikely to act as capping ligands to make the NCs dispersible.22
Optical investigations of ligand free colloidal Eu3+-doped PbMoO4 NCs show some interesting characteristics. Upon UV (394 nm) excitation, aqueous dispersion of all three samples show strong emission near 614 nm (as shown in Fig. 3a) which is assigned to 5D0 → 7F2 transition. In addition to this strong emission at 614 nm, relatively less intense emission peaks are observed at 590, 650 and 700 nm, which are ascribed to 5D0 → 7F1, 5D0 → 7F3 and 5D0 → 7F4 transitions, respectively. A scheme showing the origin of photoluminescence and the energy levels of Eu3+ is shown in Fig. 3b. The 5D0 → 7F1 (590 nm) transition is magnetic-dipole transition whereas the 5D0 → 7F2 (614 nm) is a hypersensitive electric-dipole transition whose intensity depends on the local crystalline environment around the Eu3+ ions in the host lattice. An intense 5D0 → 7F2 transition generally arises when the emitting Eu3+ ions are present in the site of low symmetry environment. However, in PbMoO4 lattice, both Pb2+ and Mo2+ have S4 point symmetry possessing an inversion centre. This suggests weaker emission intensity for the 5D0 → 7F2 transition. The observed strong emission might be due to the presence of some defects or disorders, which ultimately leads to the distortion in the symmetry sites where the Eu3+ ions occupy in the host lattice.34 Moreover, we believe that polarization effect, which alters the crystal field strength as well as affects the transition probabilities, may be responsible for such observation.35 Similar luminescence observations were reported in REPO4: Ln3+ (RE = Y, La, Gd; Ln3+ = Eu3+, Dy3+, Tb3+) phosphors.36,37
It is interesting to note that the luminescence intensity of Eu3+ ions in Pb110 is lower than that of other two samples (Pb80 and Pb95). We emphasize that the difference in the emission intensity between the three NCs is not due to their difference in colloidal stability and size as Pb110, showing the lowest intensity, has higher colloidal stability as well as larger size than Pb95. The reason might be explained by considering that Eu3+ ions are not as good a candidate as Pb2+ ions for the matrix and as a result, all Eu3+ ions are not able to get doped into the host matrix in the presence of excess Pb2+ ions. Hence, it is relatively much more difficult for the Eu3+ ions to get doped into the Pb110 matrix during synthesis since, statistically, the ratio of Pb2+ to MoO42− is more in the case of Pb110 compared to Pb95 and Pb80. More Eu3+ doping in the case of Pb80 and Pb95 compared to Pb110 results in relatively higher luminescence intensity for Pb80 and Pb95 than Pb110. EDS analysis (Fig. S2†) of all three samples supports the aforementioned explanation. For Pb80 and Pb95, the atomic percentage of Eu3+ with respect to Pb2+ is almost 5%, while it is only about 2% for Pb110.
Time dependent luminescence intensity studies of all three NCs dispersed in water were further performed to evaluate their relative colloidal stabilities. The luminescence intensity of Eu3+ in Pb95 decreases rapidly with time (Fig. 4c). However, the observed decrease in the luminescence intensity for Pb80 and Pb110 NCs, is only 10% and 18%, respectively (after 180 minutes) suggesting the strong colloidal stability of these NCs (Fig. 4b and d, respectively). The steep decrease in the luminescence intensity for Pb95 suggests rapid settling down of the NCs.
The luminescence lifetime of the 5D0 state of Eu3+ ions in Pb80, Pb95 and Pb110 NCs are 0.65 ms, 0.53 ms and 0.63 ms respectively, as calculated from the decay analysis. The decay curves can be fitted well using the equation I = A1exp(−t/τ1) where τ is the lifetime (shown in Fig. S6†). The difference in lifetime for the three different NCs can be explained on the basis of their different sizes. With decrease in nanocrystal size, the ions doped in it become more exposed to the high energy vibrational modes of the environment (solvent in this case). Consequently, the excited states of the dopant ions become more prone to non-radiative relaxation leading to lower luminescence lifetime. As both Pb80 and Pb110 are larger in size than Pb95, the luminescence lifetime of Eu3+ ions doped in these NCs is less susceptible to quenching than that observed for Pb95. Quantum yield for all three samples were calculated using quinine sulphate as the reference standard. The quantum efficiency of Pb80, Pb95 and Pb110 were found to be 24.55%, 24.09% and 8.01%, respectively. The details of the measurement and the calculations are given in Fig. S7.†
Recently, several studies have investigated the photocatalytic degradation properties of PbMoO4. For this purpose, different synthetic routes have been proposed to obtain new structural morphologies and particle size to improve the photocatalytic efficiency.27,38,39 As optical absorption property of a material is a key parameter for its photocatalytic activity, diffuse reflectance spectroscopy (DRS) measurements for all three samples were performed. UV-Vis diffuse reflectance spectra of all three Eu3+-doped PbMoO4 NCs show similar reflectance spectra (shown in Fig. 5). Due to the relatively high band gap energy of PbMoO4 (Eg ∼ 3.3 eV), it was tested as a photocatalyst under UV irradiation. The conduction band of PbMoO4 is located above the RhB redox potential versus the standard calomel electrode (SCE), allowing PbMoO4 to be catalytically active.
![]() | ||
Fig. 5 UV-Vis diffuse reflectance spectra of Eu3+ doped Pb80 (blue), Pb95 (red) and Pb110 (violet) nanocrystals. |
Upon UV excitation, an exciton is generated in PbMoO4 NCs. The electron in the conduction band and the hole in the valence band reacts with oxygen and water molecules to produce O2˙− and HO˙, respectively. We believe that these reactive oxygen species (e.g., HO˙, O2˙−, etc.) can oxidize the organic dye molecules and perform photocatalysis.27,40–43 A scheme illustrating the photo-generated charge separation in PbMoO4 NCs and subsequent generation of reactive oxygen species, which is responsible for dye degradation is shown in Fig. 6.
The UV-Vis spectra of RhB (shown in Fig. 7b), collected at regular intervals during the photocatalysis experiment using Pb95 suggests that, the photocatalyst is able to degrade about 70% of RhB dye within 100 minutes of UV irradiation at pH 5.5. Under similar conditions, only 40% of RhB got degraded by TiO2 (P25) after 100 minutes.
The pie chart diagram of RhB dye degradation shown in Fig. S8† reveals that over half the concentration of the dye is degraded in the first 60 minutes. To quantify the photocatalytic activity of the samples, kinetics of the reactions were investigated. The RhB dye degradation follows apparent first order kinetics, which is in agreement with a general Langmuir–Hinshelwood mechanism;
r = −dC/dt = k1k2C/(1 + k2C) |
ln(C0/C) = k1k2t = kt |
The photocatalytic activity of a material largely depends upon its bandgap. However, the DRS results suggest that the observed bandgap values for all the three nanocrystals are quite close (∼3.3 eV). Although the amount of Pb% affects the size of the nanocrystals, the difference in size between the nanocrystals is quite small (11, 9 and 10.4 nm, respectively for Pb80, Pb95 and Pb110). The observed similar bandgap values for the three nanocrystals are also reflected in the similar photocatalytic behaviour.
To the best of our knowledge, the performance of our photocatalyst surpasses previous reports, both in terms of degradation limit and rate constant at this pH.41–43 The enhanced photocatalytic activity (at pH 5.5) of our samples in comparison to other reports is illustrated in Table 1 in the ESI.† This enhanced photocatalytic activity can be directly attributed to the absence of capping ligands on the surface. The photocatalyst can transfer holes and electrons much more efficiently to oxygen and RhB in the absence of any capping ligands on its surface, thereby producing enhanced photocatalytic activity.
Footnote |
† Electronic supplementary information (ESI) available: DLS, zeta potential, EDS, TGA, lifetime measurement data, quantum yield calculation, pie chart diagram, rate constant determination, table for comparison of photocatalytic capability between different materials. See DOI: 10.1039/c5ra05242d |
This journal is © The Royal Society of Chemistry 2015 |