
Aggregation and structural study of the monolayers formed by an amphiphilic thiapentacarbocyanine†
Carlos Rubia-Payáa,
Juan J. Giner-Casares‡
*a,
Gustavo de Miguelab,
María T. Martín-Romeroa,
Dietmar Möbiusc and
Luis Camacho*a
aInstitute of Fine Chemistry and Nanochemistry, Department of Physical Chemistry and Applied Thermodynamics, University of Córdoba, Campus Universitario de Rabanales, Edificio Marie Curie, Córdoba, Spain E-14014. E-mail: jjginer@uco.es; lcamacho@uco.es
bIstituto Italiano di Tecnologia, Via Morego, 30, 16163, Genoa, Italy
cMax-Planck-Institut für biophysikali Chemie, Am Fassberg 11, D-37077, Göttingen, Germany
First published on 30th March 2015
Abstract
Exotic assemblies with unique photophysical features can be built based on organic dyes at the air–liquid interface. Langmuir monolayers of N,N′-dioctadecylthiapentacarbocyanine (OTCC) at air–water and air–solid interfaces have been studied. A single type of domain and presumably of one single aggregate type has been found by Brewster angle microscopy. Peanut-shaped domains with internal anisotropy have been observed. However, this structure leads to a complex absorption spectrum which shows 4 bands, two red-shifted (822 nm and 757 nm), and two blue-shifted (600 nm and 530 nm) with respect to the monomer band (665 nm). Our results confirm that all the absorption components are polarized in approximately the same direction. The absence of an emission spectrum indicates that this interfacial aggregate cannot be classified as a simple J-aggregate. Moreover, these bands cannot relate to Davydov splitting, given that all of them have the same polarization direction. We propose possible explanations based on a strong exciton–phonon interaction, and/or the formation of aggregates with different coherent lengths within the domain. The basic exciton model cannot explain this behavior. The coherent aggregate described in this study is proposed as a unique dye supramolecular structure obtained by assembly at the air–liquid interface.
1. Introduction
On elucidating how structural details determine optical properties, one can envision tuning the properties of materials by altering the molecular packing within the nanoscale structure of the assembly.1 Since the 1930s, it has been known that by increasing the concentration of some cyanine dyes in an aqueous solution results in the observation of a new narrow, intense, and red-shifted absorption and emission band due to the formation of J-aggregates.2 The spectral properties of dye aggregates could be related to the molecular packing of the chromophores.3 Dye aggregates with a narrow absorption band that is shifted to a longer wavelength with respect to the monomer absorption band and a nearly resonant fluorescence, i.e., quite small Stokes shift, with a narrow band are generally termed J-aggregates. On the other hand, aggregates with absorption bands shifted to shorter wavelength with respect to the monomer band, are called H-aggregates and exhibit low or no fluorescence. The great significance of J-aggregates was recognized due to its optical and photophysical properties. Excellent monographs and reviews about J-aggregation are available in the literature.4The controlled arrangement of organic dyes at the supramolecular level is most interesting when designing functional architectures in tailored materials for different applications. The emergence of chirality from non-chiral building blocks provides a direct route for obtaining chiral materials, with additional interest concerning the emergence of life on prebiotic conditions.5 Second harmonic generation technique has been recently exploited in studying such monolayers containing organic dyes, revealing interesting physicochemical features.6 Indeed, the self-assembly of organic dyes is interesting for building novel supramolecular structures,7 as well as for the understanding of intermolecular interactions with biomolecules.8
Cyanines can be aggregated in different ways depending on their structure and the medium (bulk solution or interface), resulting in aggregate modes that do not necessarily respond to simple J or H models. So, sometimes the monomer absorption band is splitted and two bands appear simultaneously shifted to higher and lower wavelengths than the monomer.9 This behavior has been explained based on the formation of Davydov aggregates,10 i.e., aggregates in which the molecules adopt nonequivalent positions in the structure formed. According to Davydov's exciton theory, a given molecular energy level may be split into as many components as there are inequivalent molecules per unit cell. These aggregates are easily characterized because the different bands show different polarization properties.11
However, under certain experimental conditions, aggregates not fully adapting to the described models have been found. Thus, certain cyanine derivatives form a double layer tubular strandin solution,12 being possible to observe as the absorption spectrum shows four bands in the visible region, three of them with the same polarization direction, while the fourth band shows a polarization perpendicular to the other.12c The interpretation of this behavior is complex, and the experimental results indicate that two of these bands are due to Davydov splitting, the third band has vibronic nature, while the fourth one is due to tubular segments of smaller delocalization length.12c An alternative explanation has been proposed where the tubular supramolecular model system is composed of two separate excitonic subsystems that are weakly coupled electronically.1
In this paper the behavior of Langmuir monolayers of N′-dioctadecyl-thiapentacarbocyanine (OTCC) has been described. Under certain experimental conditions, OTCC patterns a single type of domain and presumably of one single aggregate type, forming structures of the size of the order of micrometer. However, these structures lead to a complex absorption which shows four bands, as in the case of the tubular aggregates. Different studies show that all the bands are polarized in the same direction. The basic exciton model cannot explain this behavior. Some possible explanations based on a strong exciton–phonon interaction, and/or the formations of aggregates with different coherent lengths within the domain are proposed.
2. Results
2.1. Surface pressure – area isotherm
Fig. 1 (solid line) shows the π–A isotherm of the OTCC monolayer on a pure water subphase. The take-off of the isotherm occurs at ∼2.15 nm2 per molecule, with a phase transition at ∼5 mN m−1. The monolayer collapse takes place at a surface pressure of ∼40 mN m−1, and an area per molecule of ca. 0.8 nm2. The beginning of the phase transition takes place with an overshoot, see Fig. 1. The overshoot takes place for all values of compression rate monolayers tested, even the slowest allowed by our experimental device, namely 0.04 nm2 per minute per molecule. In this case, the overshoot coordinates are ca. 4.8 mN m−1 and 1.9 nm2 per molecule. The overshoot is a function of the monolayer compression rate. As is shown in Fig. 1 (inset) when the compression rate is increasing, the overshoot is shifted to a higher surface pressure and a lower surface area. | ||
| Fig. 1 Surface pressure–area (π–A) isotherms of OTCC monolayer. Solid line: pure water subphase. Dashed line: 0.1 M NaCl subphase. Dotted line: 0.05 M phosphate buffer subphase. Inset: π–A isotherms for different compression rates as specified within the graph and evolution of the monolayer at 4 mN m−1. Top left, molecular structure of OTCC. | ||
Vollhardt and Retter defined the critical surface pressure, πcrit, as the minimum surface pressure required for the formation of nuclei.13 One reason for the appearance of the overshoot is because the nucleation process is, in any case, slower than the monolayer compression rate. To check this, some experiments were performed in which the monolayers were compressed at a slow compression rate until a surface pressure constant was reached at a previous point before the overshoot (see inset Fig. 1). In these experiments, the application of a surface pressure πconstant < 4 mN m−1 does not lead to the monolayer condensation (data not shown). On the other hand, when πconstant ≥ 4 mN m−1, the monolayer begins to contract due to the feedback control system. In these cases the area relaxation is due to the nucleation and growth process at the monolayer. The inset in Fig. 1 shows the π–A recording when πconstant = 4 mN m−1. Therefore, πcrit ≈ 4 mN m−1.
OTCC is a positively charged molecule; therefore the formation of the monolayer requires the presence of the counter ion. π–A isotherms were performed in the presence of different counter ions in the subphase to analyze the possible influence of this effect. Fig. 1 also shows the π–A isotherms for the OTCC monolayer using 0.1 M NaCl (dashed line) and 0.05 M phosphate buffer (dotted line) as subphases. Additionally, no influence of a 10−4 M CBS as subphase was observed in the surface pressure–molecular area isotherm of OTCC. The π–A isotherm obtained in presence of NaCl resembles that one obtained at the aqueous subphase. The main differences are that the phase transition occurs at about 12–13 mN m−1 and that the overshoot is not observed. However, in the presence of phosphate buffer, the isotherm is quite different from the above. Thereby, the take-off of the isotherm occurs at ∼2.5 nm2 per molecule, two phase transitions can be observed at ∼5 mN m−1 and ∼38 mN m−1 and finally, the collapse pressure slightly increases with respect to the previous cases.
For all tested subphases, the area per molecule near the collapse surface pressure was about 0.8 nm2 per molecule. The length of the OTCC polar group (thiapentacarbocyanine, see Fig. 1 for structure) is ∼1.94 nm. This distance was calculated by optimizing the OTCC geometry using the semi-empirical PM3 method. Assuming a separation between polar groups of ∼0.4 nm at high surface pressure, the area occupied at the interface per polar group should have a minimum value of ∼0.78 nm2, which is close to the area found per OTCC molecule, i.e.,∼0.8 nm2. This coincidence suggests that neither the counter-ion, nor the alkyl chain, contribute to the net area occupied by the molecule at the interface, at least for high values of surface pressure. The aggregation of the OTCC polar group is the main phenomenon controlling the structural properties of the monolayer. However, the counter ion appears to greatly influence the aggregation process. By modifying the self-assembly of the OTCC groups, the growth of large domains can be either promoted or hindered, as discussed below. The partial hydrophobic character of the CBS anion when compared to chloride or phosphate anions may be related to this phenomenon.
2.2. Brewster angle microscopy (BAM)
Simultaneous to the isotherm recording, the morphology of the mixed monolayers was directly observed at the air–water interface by BAM. Fig. 2 shows images corresponding to aqueous subphase, or with 10−4 M CBS in the subphase. Before the isotherm take off, honeycomb-like domains were observed (Fig. 2a and b). Once the isotherm take off was reached the monolayer became homogeneous. The homogeneity persists until the overshoot was reached (Fig. 2c). | ||
| Fig. 2 BAM images of the OTCC monolayer: (a–f) images obtained along the compression process (compression rate 0.04 nm2 per minute per molecule); (g) image obtained at high surface pressure when the compression rate was 0.8 nm2 per minute per molecule; (h) image obtained applying a constant pressure of 4 mN m−1 and leaving the monolayer to evolve with time, after a constant compression rate was re-applied up to high surface pressure. | ||
After crossing the overshoot (Fig. 2d), we could observe the appearance of elongated domains which evolved toward peanut or dog bone shapes. These peanut-like domains display inner anisotropy, such that its vertical regions were dark, while its horizontal ones were clear. The texture of the domains arises from the relative orientation of the dipoles with respect to the p-polarized laser incident. This phenomenon will be discussed in detail below. The domains grow as the surface pressure (Fig. 2e) is increased until they completely cover the interface (Fig. 2f). The domains do not coalesce when high surface pressures were applied.
The average size of the domains depends on the monolayer compression rate. For high compression rates, many small domains appear. Fig. 2g shows an image obtained at a high surface pressure when the compression rate was 0.8 nm2 per minute per molecule. By contrast, the domain number decreases but reaching larger sizes, as the compression rate is diminished (Fig. 2f). Larger domains are obtained by applying a constant pressure of 4 mN m−1 allowing the monolayer to evolve with time, as described above (inset of Fig. 1). The domains thus obtained are shown in Fig. 2h. In the experiment corresponding to Fig. 2h, after leaving the domains to grow, a constant compression rate was re-applied upto high surface pressure. In this way we could appreciate the emergence of new domains of smaller sizes. In this selected Fig. 2h, we can observe three large domains, two vertically positioned with respect to the incident laser (A domains) and one positioned horizontally (B domain).
In all the images shown in Fig. 2, the laser polarizer and analyzer were placed parallel (both in p position, 0°). In Fig. 3a, an image in which the analyzer is rotated 90° with respect to the polarizer can be observed. Note that these domains show a striking texture that will be analyzed later. The decompression of the Langmuir monolayer leads to the complete disappearance of the domains, so in a second compression cycle a π–A isotherm without appreciable hysteresis with respect to the first cycle (data not shown) is registered. However, a noteworthy phenomenon takes place during the early stages of decompression. Before the disappearance of the domains, each domain is divided into two breaks in its central region (see Fig. 3b). Decompression results in the separation, probably because of the repulsion between the two broad side regions of the domains, which apparently were not united, but only through a narrow central region. This central region is the first to be broken when the monolayer is decompressed (see Fig. 3b, bottom).
 | ||
| Fig. 3 BAM images of the OTCC monolayer: (a) analyzer rotated 90° with respect to the polarizer; (b) during the monolayer decompression; (c) an LS monolayer transferred on quartz. The transfer surface pressure was 9 mN m−1, and the analyzer was rotated 45°; (d and e) 0.1 M NaCl as subphase; (f) 0.05 M phosphate buffer as subphase. | ||
The monolayers can be transferred from the air–water interface to solid supports without a significant modification on the supramolecular arrangement. Fig. 3c shows a BAM image of an OTCC monolayer transferred on quartz at the surface pressure of 9 mN m−1 by the LS method. We note this usage of BAM provides an exceptional proof for assessing the conservation of molecular organization during the transfer process. The image clearly shows domains with the same shape as those observed at the air–water interface. In this image, the polarizer was disposed at 45° to increase the contrast. Therefore, the dark line that crosses domain is rotated 45° from the image vertical, which is coincident with the direction of the incident laser.
Fig. 3d and e shows BAM images of the OTCC monolayers by using 0.1 M NaCl as subphase. The monolayer appears homogeneous before the phase transition. When the surface pressure is approximately 12 to 13 mN m−1, irregularly shaped domains begin to appear, some of which are bright and other dark (Fig. 3d). The domains grow with branched shape as the surface pressure increases, so that the branches with grow parallel to the laser incidence axis are bright, while those grown perpendicularly are dark (Fig. 3e).
Fig. 3f shows BAM images of the OTCC monolayers by using 0.05 M phosphate buffer as subphase. As for the previous case, the monolayer appears homogeneous before the first phase transition. At a surface pressure of ∼5 mN m−1 small circular domains with internal anisotropy begin to appear.
The Polarization Modulated InfraRed Reflection Absorption Spectroscopy (PM-IRRAS) spectra of the OTCC monolayers at high surface pressure show absence of signal in the CH2 region. That means the alkyl chains are in a quite low state of ordering. Therefore, the observed domains are exclusively caused by the aggregation of polar groups.
2.3. UV-vis reflection spectroscopy (UVR) at the air–water interface
The UV-vis reflection spectroscopy at the air–water interface allows obtaining in situ quantitative information on the presence and orientation of the chromophores at the interface. The UV-vis reflection spectroscopy is exclusively sensitive to the molecules existing at the air/water interface, therefore discarding any signal from the subphase. For a Langmuir monolayer containing UV-vis absorbing molecules, the reflection of light under normal incident at the interface is enhanced by:14
 | (1) |
 | (2) |
Fig. 4 shows the UV-vis reflection spectra for the OTCC monolayer (water or 10−4 MCBS subphases) at different surface areas. As reference, the UV-vis absorption spectrum of the OTCC molecule in solution is also included (dotted line). The solution spectrum shows an intense band centered at 665 nm (ε1 = 2.4 × 10⁵ M−1 cm−1), due to the 0 → 0 transition and one vibronic sub-band at around 610 nm.9b This vibronic structure can be attributed to certain essentially harmonic vibrations, largely to C–C valent vibrations in the 1300–1400 cm−1 range.15 In fact, the separation between the 665 nm and the 610 nm bands is 0.168 eV, which is equivalent to 1355 cm−1.
 | ||
| Fig. 4 UV-vis reflection spectra of the OTCC monolayer (water subphase) at different surface areas. The UV-vis spectrum of OTCC in bulk solution (chloroform: methanol, ratio 3.1 (v/v)) is included for comparison (black dotted line). | ||
Before the domain formation, the reflection spectrum show peaks centered at 679 and 620 (see Fig. 4). In this case, the separation between the bands is 0.174 eV, which is equivalent to 1400 cm−1. When domains began to appear, the above bands disappeared, while simultaneously new bands were observed at 822 nm, 757 nm, 600 nm and 530 nm. The bands at 600 and 530 nm emerge at high surface pressure as a single broad band (see Fig. 4).
UV-vis reflection spectra are often expressed in normalized units in order to discard any additional effect to the variation of the surface concentration of the chromophore at the interface. The surface concentration of the dye molecule is expressed by Γ = 1014/(NA·A), where NA is the Avogadro number, and A is the OTCC molecular area. The normalized reflection signal is the product of the absolute reflection signal by the molecular area of the chromophore:
 | (3) |
ΔRNn has nm2 mol−1 units. The normalized reflection spectra offer information on molecular aggregation, as well as in molecular orientation. Fig. 5 shows ΔRNn for the OTCC monolayer in presence of different ions in the subphase, at 38 mN m−1.
 | ||
| Fig. 5 Normalized UV-vis reflection spectra of the OTCC monolayer obtained at 38 mN m−1, A = 0.8 nm2. Solid line: water subphase. Dashed line: 0.1 M NaCl as subphase. Dotted line: 0.05 M phosphate buffer as subphase. | ||
Spectra obtained at high surface pressure, both on NaCl and phosphate subphases are very similar to those obtained on pure water subphase. Thus, in the presence of phosphate, bands at 816 nm, 754 nm and a broad band at 605 nm (Fig. 5, dotted line) can be seen. Meanwhile, on NaCl subphase, the bands appear at 807 nm, 746 nm and 600 nm (Fig. 5, dashed line), although in this case, a band at 696 nm, is also observed, possibly due to non-aggregated OTCC molecules.
From Fig. 5 it can be inferred that the aggregation at the molecular level is very similar in the three cases analyzed, although the shape and size of the BAM domains are very different, suggesting that the number of coherently coupled molecules is much smaller than the aggregate size. The counterion does not seem to be a determining factor in the type of coherent aggregate formed, although it seems to take an active role in the size and geometry of the resulting domain.
In solution, the intensity of an electronic absorption band is usually represented in terms of the so-called oscillator strength defined as:16
 | (4) |
 | (5) |
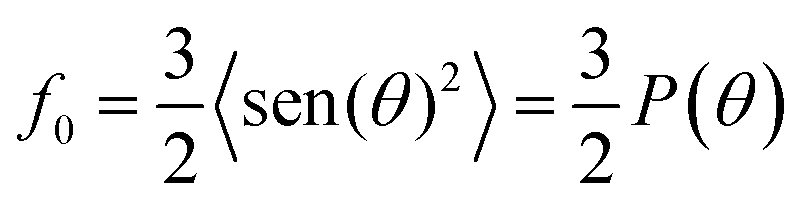
According the Davydov model corresponding to excited states of weakly interacting molecules, oscillator strength is preserved in different aggregation state.4a,10,11,16 In such a case, the variations of fap provide a direct measurement of the order parameter of the chromophores at the air–water interface. In solution we obtain the oscillator strength, f ≈ 1.5 (integration from 500 nm to 750 nm), while at the air–water interface, fap ≈ 2.3 (integration from 450 nm to 950 nm) is calculated, which is independent both of the salt used in the aqueous subphase and the surface pressure. Therefore, f0 ≈ 1.5 or P(θ) ≈ 1. Note that these values refer to the set of transitions observed in the visible. However, since f0 = 1.5 is the maximum allowed value, this indicates that all the absorption components should be located parallel to the interface plane.
On pure water subphase and high surface pressures, the monolayer is coated with a single type of domain, and presumably one single aggregate type. However, the structure of the absorption bands is complex (see Fig. 4 and 5). One possible explanation for this phenomenon is the existence of inequivalent molecules in the aggregate, i.e., the so-called Davydov's aggregate. According to Davydov's exciton theory, a given molecular energy level may be split into as many components as there are inequivalent molecules per unit cell.10,11 In addition to the spectral splitting, the Davydov bands must exhibit distinct polarization properties. However, the preliminary calculation performed above, indicates that all component transition dipoles are in the interface plane. The confirmation of this fact must be performed to obtain the polarization properties of each one of the absorption bands.
2.4. Polarization study of the absorption bands: out-plane anisotropy
An in situ measurement of the orientation of the various absorption dipole components can be performed using UV-visible reflection spectroscopy under variable angle incidence at the air–water interface with s- and p-polarized light.14c This technique has been recently developed, and depending on the incidence angle and the orientation of dipole absorption produces positive or negative bands when p-polarized radiation is used as absorption-reflection IR spectroscopy techniques. This technique has proven to be highly sensitive to resolve bands with different polarization.In Fig. 6, some spectra obtained from the OTCC monolayer (pure water subphase) at the surface pressure of 38 mN m−1 are shown. These spectra correspond to different incidence angles by using p-and s-radiation, also, for comparison the spectrum obtained at normal incidence of unpolarized radiation is shown (n-, Fig. 6). The relative height of the bands is approximately constant regardless of the angle of incidence and type p-or s-radiation used. This behavior is indicative that all the absorption components have the same average orientation with respect to the interface plane, approximately.
 | ||
| Fig. 6 Reflection spectra, ΔR, of the OTCC Langmuir monolayer at different incidence angles for π = 38 mN m−1. The incidence angle and the s-, or p-polarization are indicated in the figure. The n line corresponds to the spectrum obtained under unpolarized light and normal incidence. | ||
By fitting data to the Fresnel model corresponding to an anisotropic uniaxial film between two isotropic media (air and water), the P(θ) values for the different absorption components (822 nm, 757 nm and 600 nm) were obtained. Details on the procedure and fitting data can be found in the ESI.† In every case P(θ) ≈ 0.9–1.0 ± 0.1 were obtained, which means a parallel orientation regarding to the interface.
Furthermore, the dichroic ratio measurements of the LS films of the OTCC transferred on quartz were done. This dichroic ratio was obtained from the ratio between the s-and p-polarized transmission spectra being 45° the incidence angle with respect to the air–solid interface. For all measurements the dichroic ratio was kept constant, and equal to about 1.5, in the region of the analyzed spectrum (500 nm to 840 nm). This dichroic ratio value is indicative of a parallel orientation with respect to the interface. Details are provided in the ESI.†
The conclusion both from Fig. 6 and the dichroic ration of the LS films has been obtained assuming that the films are isotropic in the plane, which is not strictly true due to the anisotropic character of the domains observed by BAM. However, when reflection or transmission spectrum is performed, the optical section is much larger than the domain size, so it can be assumed that there are a lot of domains randomly oriented in that section, and therefore the film is isotropic in the plane as an average.
Our results confirm that the different absorption components are polarized in the plane of the interface. However, the experimental values of P(θ) have an estimated error of ±0.1, so small deviations out of the plane cannot be ruled out. Moreover, as shown above, the BAM images show a single domain type, which shows internal anisotropy (anisotropy in the plane). Understanding this phenomenon, allows us to check whether the different absorption components are polarized or not, in the same direction in the interface plane.
2.5. The origin of the domain anisotropy observed by BAM: in-plane anisotropy
In standard BAM experiment, p-polarized light reaches the air–water interface with an angle of 53.15° (Brewster angle). The different BAM textures are usually observed due to changes of the refractive index resulting from differences in thickness, density and/or molecular orientation between the different regions of film. However, in the case of OTCC Langmuir monolayers, the OTCC aggregates absorb at the wavelength of 532 nm laser beam (see Fig. 4). As previously established, the absorption originates the strong changes in the film refractivity, being this phenomenon mainly responsible for the appearance of domain textures. In such a case, the Fresnel equations for biaxial anisotropic materials on isotropic substrate should be used to calculate the reflection of the film.17The BAM images, see Fig. 2d–h, show a large number of domains with random orientation with respect to the vertical axis. The vertical x axis (laboratory coordinates) is coincident with the projection of the laser incidence axis on the air–water interface. A number of domains, which have been extracted from the BAM images shown in Fig. 2, are displayed in Scheme 1A. These domains were selected to illustrate as the change on the texture of the domains simultaneously to the rotation of the domain around the incidence axis. Scheme1B shows the polar headgroup of the OTCC molecule. In this Scheme 1B, μ (red arrow) is defined as the main thiapentacarbocyanine transition dipole which is located parallel to the interface (x–y plane). In Scheme 1B, the polar, θ (see eqn (2)), and azimuthal, ϕ angles are defined. As previously obtained, P(θ) ≈ 1 and therefore θ ≈ 90°. Thus, we assume that the transition dipole rotated exclusively an angle ϕ with respect to the x axis.
 | ||
| Scheme 1 (A) Some domains with different rotation degrees with respect to the vertical axis. Polarizer and analyzer are aligned at 0°. (B) Polar headgroup of the OTCC molecule. The red arrow represents the main transition dipole, μ, θ is the polar angle, and ϕ is the azimuthal angle. (C) BAM images of the OTCC monolayer obtained at 38 mN m−1. Polarizer and analyzer are aligned at 0°. (D) This image shows the same domains that in C, although now the BAM analyzer was located 90° with respect to the polarizer. (E) Domain in which the progressive rotation of the transition dipoles are represented in a sketchy way with red arrows. (F) The ϕ values are shown as contours inside a domain. | ||
The inner textures of the domains can be simulated disregarding the presence of the alkyl chains. Thus, the monolayer is considered as a biaxial materials with the complex refractive indices of Nq = nq − ikq (q ![[triple bond, length as m-dash]](https://www.rsc.org/images/entities/char_e002.gif) x, y and z), where nq is the real part of the refractive index, and kq is the absorption coefficient of the monolayer (see details in the ESI†).17 The BAM images shown in Scheme 1C were recorded with the camera polarizer (analyzer) at 0°. This polarization angle implies that only the p component of the reflected radiation is detected. If, as obtained previously, it is assumed θ ≈ 90°, only the kx component plays a role in the acquired BAM pictures. In such a case, it may be demonstrated that the reflection near the Brewster angle is approximately proportional to cos(ϕ)4 (see ESI†). However, reflection quantification requires Fresnel equations. Therefore, the different textures of the domains are due to the different orientations of the polar group with respect to the incident laser.
x, y and z), where nq is the real part of the refractive index, and kq is the absorption coefficient of the monolayer (see details in the ESI†).17 The BAM images shown in Scheme 1C were recorded with the camera polarizer (analyzer) at 0°. This polarization angle implies that only the p component of the reflected radiation is detected. If, as obtained previously, it is assumed θ ≈ 90°, only the kx component plays a role in the acquired BAM pictures. In such a case, it may be demonstrated that the reflection near the Brewster angle is approximately proportional to cos(ϕ)4 (see ESI†). However, reflection quantification requires Fresnel equations. Therefore, the different textures of the domains are due to the different orientations of the polar group with respect to the incident laser.
By using this simple model it is possible to determine the transition dipole orientation (ϕ angle) in each domain region based on its reflectivity. On this basis, it is assumed that the intensity of each pixel of BAM image (0–255 grayscale) is proportional to the reflectivity. However, the pixel intensity is a relative magnitude dependent on the exposure time. To establish a quantitative relationship between reflectivity and grayscale, BAM pictures not saturated by high or low intensity, i.e. images where neither zero nor 255 in gray scale were reached (images shown in Fig. 2e and h are saturated by high intensity) are required. An unsaturated image is shown in Scheme 1C. In this image, three domains have been selected (marked with red circles), as reference domains, for which ϕ = 0° for the brightest regions (point 1 in Scheme 1C) and ϕ = 90° for the darkest one (points 2 in Scheme 1C) have been set.
The quantitative relationship between reflectivity and gray scale can be completed with the image shown in Scheme 1D. This image shows the same domains which may be observed in Scheme 1C, although now the BAM analyzer was rotated at 90° with respect to the polarizer. In this case, the incident radiation is p polarized, but only the s component of the reflected radiation is detected. Under these experimental conditions, kx and ky components of the absorption coefficients contribute to the reflectivity. The reflectivity should be proportional to cos(ϕ)4 × sin(ϕ)4. This function has a maximum for ϕ = 45°, therefore the brightest regions of the domains in the Scheme 1D should correspond to this rotation angle of the transition dipole and point 3 in Scheme 1C and D should be associated with a value ϕ = 45°. Note that the cos(ϕ)4 × sin(ϕ)4 function has minima for ϕ = 0° and ϕ = 90° corresponding to the domain darkest regions in Scheme 1D.
In Scheme 1E a horizontally oriented domain is shown, i.e., along the y axis. The size of this domain is about 60 μm long by 40 μm wide. Inside this domain the progressive rotation of the transition dipoles are represented in a schematic way with red arrows. In the Scheme 1F, the ϕ values are shown as contours. These ϕ values were calculated for the previous domain and by using a linear relationship between the pixel intensity and the function cos(ϕ)4. In the graph, the labels mark regions within which the angle ϕ is less or equal than the value indicated.
As deduced from the foregoing the anisotropy observed in the BAM domains is due to the different orientations between the molecule transition dipole and the laser incidence axis (x axis, see Scheme 1B). However, all BAM images shown in Fig. 2 and 3, and in Scheme 1, have been taken using a 532 nm laser, so that all the previous arguments refer exclusively to this absorption component. It has been shown that all aggregate absorption components are polarized in the interface plane, approximately, although it is possible that these components could have a different orientation inside the plane. By using a laser with different wavelength can result in different domain textures if indeed absorption modes have different in-plane polarizations.
Additionally, BAM images using a 658 nm laser have been recorded. Fig. 7A shows an image of the monolayer at π = 20 mN m−1. The domain textures are identical to those obtained at 532 nm. Moreover, BAM images have been obtained by using monochromatic light sources at 780 nm and 810 nm from a xenon lamp with a monochromator. In these cases the power of the lamp is much lower than the lasers and the images are less clear-cut. Besides, in this wave, only a narrow region BAM display (frame) has only been able to get in focus. Fig. 7B and C show images obtained at 780 and 810 nm, respectively. As can be seen the texture of the domain is the same that in the previous case, leading us to conclude that all the absorption components are polarized in the same direction inside the interface plane.
 | ||
| Fig. 7 BAM images of the OTCC monolayer at π = 20 mN m−1 under: (A) 658 nm laser; (B) 780 nm monochromatic light; (C) 810 nm monochromatic light. | ||
In view of the results shown above, it can be deduced that the OTCC molecules exhibit a striking aggregation pattern forming peanut shaped domains. These domains can be described with two axes: (a) short axis, in the narrowest part of the domain, which coincides with the x axis in the domains shown in Schemes 1D and 1F; (b) long axis, which coincides with the y axis in these schemes.
Furthermore, two regions can be distinguished within the domain, in which the aggregation of cyanine appears to be different. The first one is the narrow central region extended along the short axis of the domain, where the polar group is located parallel to such axis, and there is no apparent rotation of a molecule relative to another. The second one is the two wide lateral regions in which the cyanine dye is aggregate in a fan shape. In this latter case, the cyanine groups rotate slightly as they shift away from the long axis, but such rotation is always less than 90° respect to such axis. Such rotation is indicative of the chiral aggregate formation, although, and since there are molecules that rotate in both directions in the same domain, the domains must be achiral, as it has been verified experimentally.
2.6. Energy transfer from an Ir complex to OTCC on quartz
The OTCC molecule possesses a high fluorescence quantum yield in solution (chloroform/methanol) with an intense emission band centered at 710 nm assigned to the OTCC monomer. However, no fluorescence signal was detected in the OTCC monolayers transferred from the air–water interface to the quartz substrates. Different transfer conditions were probed, i.e. a variety of surface pressures and deposition of mono or multilayers, always with the same result. The same behavior has been reported previously in monolayers of the same cyanine but with n = 0 and n = 1 (see Fig. 1), which is attributed to the fast non-radiative deactivation pathways occurring in the aggregates.9a,18 In line with this, in mixed LB films containing the cyanine derivative (n = 1) and stearic acid, fluorescence signal was detected which was solely assigned to the monomer cyanine due to the disaggregation effect of the stearic acid in the cyanine molecules.18However, despite the absence of fluorescence emission of the OTCC layers, the molecular photonics properties of the aggregates can be exploited. Thus, to investigate potential photophysical reactions in the OTCC layers, monolayers of a cationic iridium complex mixed with an anionic phospholipid (1![[thin space (1/6-em)]](https://www.rsc.org/images/entities/char_2009.gif) :1) were deposited together with the OTCC layers, fabricating different systems by alternative deposition of the monolayers. First, a LS monolayer of the iridium (Ir) complex was transferred on top of the quartz substrate. Then, a variable number of monolayers of arachidic acid were deposited by using the LB method. Finally, a LS monolayer of the OTCC molecule was transferred and the complete system can be named as Ir complex/AAx/OTCC, with x representing the number of transferred monolayers of the arachidic acid.
:1) were deposited together with the OTCC layers, fabricating different systems by alternative deposition of the monolayers. First, a LS monolayer of the iridium (Ir) complex was transferred on top of the quartz substrate. Then, a variable number of monolayers of arachidic acid were deposited by using the LB method. Finally, a LS monolayer of the OTCC molecule was transferred and the complete system can be named as Ir complex/AAx/OTCC, with x representing the number of transferred monolayers of the arachidic acid.
The complete system is irradiated with monochromatic light at 300 nm to selectively excite the Ir complex since the OTCC aggregates do not absorb at this wavelength. In case x = 5, or when the OTCC monolayer is not transferred, a strong fluorescence signal is registered, which corresponds to the Ir complex emission band (red line in Fig. 8).19 Thus, no interaction between the Ir complex and the OTCC aggregates takes place at long separation. If x = 1, the emission band drops to about half of the previous value, but keeping the same shape (blue line in Fig. 8). Finally, if x = 0, almost no emission is detected (black line in Fig. 8). Thus, the quenching of the fluorescence emission of the Ir complex is more intense when the OTCC monolayer is closer to the Ir complex layer. We believe that this distance-dependent quenching of the Ir complex emission is caused by a Förster-type energy transfer process, which is feasible due to the good overlap between the emission spectrum of the iridium complex and the absorption band of the cyanine aggregates. The Förster distance is thus estimated as the length of one monolayer of arachidic acid, ca. 2.5 nm.20 This energy-transfer reaction together with the broad and infrared-shifted absorption spectrum of the OTCC aggregates prove that these films might be integrated in molecular electronic devices, as light emitting diodes or solar cells.
 | ||
| Fig. 8 Emission spectra of an Ir complex monolayer (red line), Ir complex/AA/OTCC multilayer (blue line) and Ir complex/OTCC multilayer (black line). λexc = 300 nm. | ||
3. Discussion
Langmuir monolayers of OTCC have been studied at air–water and air–solid interfaces. A significant influence of the counterion in the aqueous subphase has been observed, although the aggregation of the OTCC polar group appears anyway as the main phenomenon controlling the structural properties of the OTCC monolayer. Thus, in the presence of CBS as counterion, the BAM image shows the formation of a single type of domain and presumably of one single aggregate type. These domains are peanut-shaped, displaying internal anisotropy, with dark vertical regions, and clear horizontal regions. The texture of the domain is the result of its relative orientation with respect to the p-polarized incident laser. These single structures lead to a complex absorption which shows 4 bands, at 822 nm, 757 nm, 600 nm and 530 nm. However the bands at 600 and 530 nm appear as a single broad band at high values of surface pressure. The counterion seems to take an active role in the size and geometry of the resulting domain.UV-visible reflection spectroscopy measurements under variable angle incidence at the air–water interface with s- and p-polarized light confirm that the different absorption components are polarized in the plane of the air–water interface.
The use of BAM with monochromatic light sources at the wavelengths corresponding to the different absorption modes could result in different domain textures if indeed absorption modes have different in-plane polarizations. However, the use of monochromatic light sources at 660 nm, 780 nm and 810 nm allows us to observe BAM domains which have the same texture as described by using 532 nm (see Fig. 2), which lead us to conclude that all the absorption components are polarized in the same direction, approximately. Thus, by using pure water or CBS subphase, the OTCC molecules form a single type of aggregate at the air–water interface. However, this aggregate leads to 4 absorption bands in the visible region, two red-shifted ones, and two blue-shifted ones, with respect to the monomer band. The absence of emission spectrum indicates that this aggregate cannot be classified as J-aggregates. Also, these bands cannot relate to Davydov splittings, since all them have the same polarization direction.
There are some analogies between the behavior described and the behavior observed for certain cyanine derivatives which form double layer tubular strands in solution.12,21 Thus, the absorption spectrum shows 4 bands in the visible region, as in our case. However, unlike our system, 3 of the bands have the same polarization direction, while the fourth one shows a polarization perpendicular to the other.12c,21 Another important difference is that these tubular structures are fluorescent. In any case, we note that the basic exciton model cannot explain three transitions oriented parallel and one perpendicular to the tubular axis, in the same way that this model cannot explain four transitions oriented in the same direction.
We believe that some of the bands observed for the OTCC monolayers may be due to the exciton–phonon interaction. This type of interaction is significantly different for J or H aggregates. Thus, for J aggregates, the vibrational structure tends to decrease when the number of the coherently coupled molecules increases. On the other hand, for H aggregates, the vibrational structure is enhanced, and several bands of this type may appear.4g,15,21 Thus, a possibly partial explanation of the complex absorption of the OTCC monolayers might be the formation of H-aggregates with a strong exciton–phonon interaction. Note that opposing this model is the difference of the OTCC aggregates with the H-aggregate, given the two red-shifted and two blue-shifted absorption bands, with respect to the monomer. The most intense band is the red-shifted one. As noted above, the OTCC aggregate cannot be classified as a J-aggregate either, due to the emission absence. However, defining the molecular aggregates structures into exclusively two groups of H- and J-aggregates might be misleading. Different displacement and rotation degrees between adjacent molecules might occur. The formation of aggregates with small displacements between molecules could represent a possible explanation of the null fluorescence emission.
The definition of the H or J aggregate is performed in function of the blue-shift (H), or red-shift (J) absorption band displacement respect to the non-aggregated specie band. However, in our case the position of the non-aggregated specie band could not be well defined. The OTCC molecule have two benzothiazole groups (aromatic heterocyclic), which have flat structures (see Scheme 2A-left). However, these two groups are not coplanar with each other due to steric hindrance. We have performed an optimization of the geometry of this molecule using the PM3 semi-empirical method, obtaining an angle between such planes of ∼26° (see Scheme 2A-right). Also, we have optimized the geometry of the OTCC dimer and tetramer. CBS molecules have been added to these OTCC structures to compensate the charge and prevent electrostatic repulsion between OTCC molecules (in Scheme 2B, the tetramer structure obtained is shown). For these aggregated forms, it has been found that the angle between the benzothiazole planes decreases to ca. 15°–20°. This phenomenon has a considerable influence on the position of the absorption band in aggregation absence, because when the angle between planes decreases, the conjugation with the double bonds of the chain increases, and therefore the band shifts to the red. Thus the red-shift may not be due exclusively to the J aggregate formation, but due to this other phenomenon, that is, the conjugation increase.
 | ||
| Scheme 2 (A) OTCC optimized geometry using the PM3 semi-empirical method. Front and side perspectives are shown. (B) OTCC tetramer optimized geometry. 4 CBS− molecules have been added to compensate the charge. Front, top and side perspectives are shown. The four OTCC molecules are represented by different color for a better visualization. See ESI† for computational details. | ||
An alternative interpretation of the experimental results which is compatible with the previous discussion might be the formation of aggregates with different coherent lengths within the domain. As commented, two regions can be distinguished within the domain, in which the aggregation of cyanine appears to be different. The first is the narrow central region, where there is no apparent rotation of the polar group relative to another and the second is the two wide lateral regions in which the cyanine dye is aggregate in a fan shape, and there is rotation with respect to other cyanine groups. However, the same absorption bands can be observed in the presence of NaCl or phosphate subphase, although the shape and size of the BAM domains are quite different.
The alkyl chains of the OTCC molecule not seem to play any important role at the interface organization. As previously indicated, the PM-IRRAS results show no signal in the CH2 region, indicating that the alkyl chains are in a quite low state of ordering. The simulation performed by semi-empirical methods indicates that the alkyl chains are inclined and partially disordered, however; also shows that they are interleaved together (see Scheme 2b-center). This latter result is significant because such intercalation force to an aggregation type in which thiapentacarbocyanine groups should be located slightly shift from each other to avoid confronting alkyl chains of adjacent molecules, leading therefore to a J aggregate type, although the shift between molecules is small (ca. 0.35 nm, see Scheme 2b) compared to the length thiapentacarbocyanine group (ca. 1.94 nm). This result is agreed with the above argument about the absence of emission spectrum.
4. Conclusions
Langmuir monolayers of OTCC have been studied by a combination of surface pressure–molecular area isotherms, BAM, PM-IRRAS and UV-vis spectroscopy; computational modeling has been performed to aid in the interpretation of the experimental results. The self-aggregation of the OTCC polar headgroup is the main driving force for the formation of the supramolecular structure leading to the striking domains observed by BAM. In this regard the counter ion present in the aqueous subphase might influence the interactions between OTCC groups and the subsequent obtained structures and domains. A significant exciton–phonon interaction is proposed to take place in the OTCC monolayers. Therefore, the Langmuir monolayers described herein might serve as a model for exotic arrangement of organic dyes at interfaces.5. Experimental section
5.1. Materials
The salt of the dye cationic N,N′-dioctadecylthiapentacarbocyanine (OTCC) with anionic 4-chlorobenzenesulfonate (CBS) as counterion was synthesized by J. Sondermann at the Max-Planck-Institut für biophysikalische Chemie,22 and used without further purification. The Ir–dye complex [Ir(ppy)2(tmphen)]PF6, being tmphen = 3,4,7,8-tetramethyl-1,10-phenanthroline, and ppy = 2-phenylpyridine, was synthesized as previously described.19 Dimyristoyl-phosphatidic acid (DMPA) and arachidic acid (AA) were purchased from Sigma Chemical Co. (≥99%, ≥99% GC, respectively) and used as received. A mixture of chloroform–methanol, ratio 3:1 (v/v), was used for dissolving OTCC, DMPA and AA. The pure solvents were obtained from Aldrich and used without further purification.
Potassium phosphate, NaCl and sodium 4-chlorobenzenesulfonate salts were purchased from Sigma-Aldrich. Ultrapure water, produced by a Millipore Milli-Q unit, pretreated by a Millipore reverse osmosis system (>18.2 MΩ cm−1), was used as a subphase. The subphase temperature was 21 °C with pH 5.7. For buffer solutions, the pH was adjusted to pH = 7.0 by adding drop-wise a solution of NaOH 1 M (purchased from Panreac, pure grade and used without further purification). The quartz substrates used for LB and LS transfers were cleaned as follows: successive steps with an alkaline detergent, isopropanol, and ethanol and then thoroughly rinsed with ultrapure water.
5.2. Methods
The monolayers of OTCC were obtained by spreading on the aqueous subphase a fresh solution 10–4 M, and allowed a waiting time before compressing the monolayer of ca. 45 min, ensuring a good reproducibility of the results. The velocity of compression ranged from 0.04 to 0.8 nm2 per minute × molecule. Along the text, and for each particular case, the value used has been specified. The mixed monolayers of Ir–complex:DMPA 1:1 (10–3 M in CHCl3:CH3OH, v/v) were prepared at the air–water interface by cospreading method.23 Also, it has to be noted that in the case of LS transfer process, dry-air was used to remove the water left before a new layer was deposited.
A NIMA 601 trough (Nima Technology, Coventry, England) equipped with two symmetrical barriers to record BAM images was used. Images of the film morphology were obtained by Brewster angle microscopy (BAM) with a I-Elli2000 (Accurion GmbH, Göttingen, Germany) using a Nd:YAG diode laser with wavelength 532 nm and 50 mW. Lateral resolution of the BAM microscope is 2 μm. The image processing procedure included a geometrical correction of the image: because of the visual angle, the raw images appear compressed in the vertical direction. The illuminated spot has an elliptical shape with an axis ratio of 1 to 0.6 because of the angle of incidence. Therefore, all the structures appear compressed in the vertical direction.21a The images have to be stretched in the incidence direction to compensate this (factor: f = 1/cos(i), i = Brewster angle) and, additionally enhanced the contrast.24 To reduce interference fringes and noise the image is smoothed by applying the “adjacent average” filter, with no additional treatment. No optical filters were applied during the BAM experiments. Polarizer and analyzer were set at 0° (p-configuration), unless it is expressly stated. The microscope and the film balance were located on a table with vibration isolation (antivibration system MOD-2 S, Accurion GmbH, Göttingen, Germany) in a large class 100 clean room. Additionally, some BAM images have been obtained by using a SIENep3se in the Accurion Labs (Gottingen, Germany), with a xenon plus arc lamp with a monochromator as light source which permits to obtain images at different wavelengths.
UV-visible reflection spectra under normal and variable angle incidence were obtained with a Nanofilm Surface Analysis Spectrometers: Ref SPEC2 at normal incidence and RefSpec2VA at variable angle incidence (supplied by Accurion GmbH, Göttingen, Germany).
UV-visible electronic absorption spectra of the films were measured locating the substrate directly in the light path on a Cary 100 Bio UV-visible spectrophotometer. The steady state fluorescence and excitation spectra were measured using a FS920 Steady State Fluorimeter (EdinburghInstrument, Livingston, UK). The excitation was at 274 nm.
The monolayers at the solid substrates were transferred at a constant surface pressure by the Langmuir–Schaefer (LS) technique, i.e., by horizontal touching of the substrate or by the Langmuir–Blodgett (LB) technique, i.e., by vertical dipping with a lifting speed of 5 mm × min−1. For fluorescence measurements, the multilayers were assembled by the following sequence of monolayers: (1) one Ir complex/DMPA (1:1) monolayer transferred at 35 mN m−1 by the LS method; (2) 0, 1, 3 or 5 AA monolayers transferred at 25 mN m−1 by the LB method; and (3) one OTCC monolayer at 35 mN m−1 transferred by the LS method. The ratio of the transfer processes onto solid substrates was close to unity in all cases.
Acknowledgements
The authors thank the Spanish CICYT for financial support of this research in the Framework of Projects CTQ2010-17481 (FEDER A) and also thanks to Junta de Andalucía (Consejería de Economía, Innovación, Ciencia y Empleo) for special financial support (P10-FQM-6703). J.J. G.-C. acknowledges the Ministry of Economy and Competitiveness for a Juan de la Cierva fellowship (#JCI-2012-12517). We thank Dr Dirk Hönig and Dr Antonio M. González-Delgado for permit the use of the Accurion Labs (http://www.nanofilm.de).References
- D. M. Eisele, C. W. Cone, E. A. Bloemsma, S. M. Vlaming, C. G. F. van der Kwaak, R. J. Silbey, M. G. Bawendi, J. Knoester, J. P. Rabe and D. A. Vanden Bout, Nat. Chem., 2012, 4, 655–662 CrossRef CAS PubMed.
- (a) E. E. Jelley, Nature, 1936, 138, 1009–1010 CrossRef CAS; (b) G. Scheibe, Angew. Chem., 1939, 52, 631–637 CrossRef CAS.
- (a) M. Kasha and E. G. McRae, Physycal Processes in Radiation Biology, Academic Press, New York, 1964 Search PubMed; (b) V. Czikklely, H. D. Forsterling and H. Kuhn, Chem. Phys. Lett., 1970, 6, 207–210 CrossRef; (c) V. Czlikkely, H. D. Foersterling and H. Kuhn, Chem. Phys. Lett., 1970, 6, 11–14 CrossRef.
- (a) T. Kobayashi, J-Aggregates, World Scientific, Singapore, 1996 Search PubMed; (b) A. H. Herz, Adv. Colloid Interface Sci., 1977, 8, 237–298 CrossRef CAS; (c) D. Möbius, Adv. Mater., 1995, 7, 437–444 CrossRef; (d) F. Wuerthner, T. E. Kaiser and C. R. Saha-Moeller, Angew. Chem., Int. Ed., 2011, 50, 3376–3410 CrossRef CAS PubMed; (e) H. Tian and F. Meng, in Cyanine dyes for solar cells and optical data storage, ed. S. H. Kim, Elsevier, Amsterdam, 2006, pp. 47–84 Search PubMed; (f) S. Kirstein and S. Daehne, Int. J. Photoenergy, 2006 Search PubMed; (g) V. V. Egorov and M. V. Alfimov, Phys.-Usp., 2007, 50, 985–1029 CAS.
- (a) H. Cao, X. Zhu and M. Liu, Angew. Chem., Int. Ed., 2013, 52, 4122–4126 CrossRef CAS PubMed; (b) L. Lin, T. Wang, Z. Lu, M. Liu and Y. Guo, J. Phys. Chem. C, 2014, 118, 6726–6733 CrossRef CAS; (c) Y. Tang, H.-T. Wang, M. Chen, D.-J. Qian, L. Zhang and M. Liu, Sci. Adv. Mater., 2014, 6, 2558–2561 CrossRef CAS; (d) X. Liu, Z. Shen, T. Wang and M. Liu, J. Colloid Interface Sci., 2014, 435, 1–7 CrossRef CAS PubMed; (e) Z. Shen, T. Wang and M. Liu, Angew. Chem., Int. Ed., 2014, 53, 13424–13428 CrossRef CAS PubMed; (f) E. Jiménez-Millan, J. J. Giner-Casares, M. T. Martín-Romero, G. Brezesinski and L. Camacho, J. Am. Chem. Soc., 2011, 133, 19028–19031 CrossRef PubMed.
- (a) G. Martin-Gassin, E. Benichou, G. Bachelier, I. Russier-Antoine, C. Jonin and P. F. Brevet, J. Phys. Chem. C, 2008, 112, 12958–12965 CrossRef CAS; (b) G. Martin-Gassin, G. Arrachart, P.-M. Gassin, N. Lascoux, I. Russier-Antoine, C. Jonin, E. Benichou, S. Pellet-Rostaing, O. Diat and P.-F. Brevet, J. Phys. Chem. C, 2012, 116, 7450–7456 CrossRef CAS; (c) A. Bruyere, L. Guy, A. Bensalah-Ledoux, S. Guy, E. Benichou and P. F. Brevet, Proc. SPIE 9181, Light Manipulating Organic Materials and Devices 9181N, October, 7, 2014; (d) A. Bruyere, E. Benichou, L. Guy, A. Bensalah-Ledoux, S. Guy and P.-F. Brevet, Opt. Mater. Express, 2014, 4, 2516–2524 CrossRef CAS; (e) P.-M. Gassin, G. Martin-Gassin, E. Benichou and P.-F. Brevet, J. Phys. Chem. C, 2014, 118, 1135–1141 CrossRef CAS.
- (a) A. V. Bogdanov, T. N. Pashirova, L. I. Musin, D. B. Krivolapov, L. Y. Zakharova, V. F. Mironov and A. I. Konovalov, Chem. Phys. Lett., 2014, 594, 69–73 CrossRef CAS; (b) J. Bhattacharjee, S. A. Hussain and D. Bhattacharjee, Spectrochim. Acta, Part A, 2013, 116, 148–153 CrossRef CAS PubMed; (c) B. Gur and K. Meral, Colloids Surf., A, 2012, 414, 281–288 CrossRef CAS; (d) K. Meral, H. Y. Erbil and Y. Onganer, Appl. Surf. Sci., 2011, 258, 1605–1612 CrossRef CAS; (e) C. Rubia-Payá, J. J. Giner-Casares, M. T. Martín-Romero, D. Möbius and L. Camacho, J. Phys. Chem. C, 2014, 118, 10844–10854 CrossRef.
- M. Stornaiuolo, G. E. De Kloe, P. Rucktooa, A. Fish, R. van Elk, E. S. Edink, D. Bertrand, A. B. Smit, I. J. P. de Esch and T. K. Sixma, Nat. Commun., 2013, 4, 1875 CrossRef PubMed.
- (a) K. Saito, K. Ikegami, S. Kuroda, M. Saito, Y. Tabe and M. Sugi, J. Appl. Phys., 1991, 69, 8291–8297 CrossRef CAS; (b) H. v. Berlepsch and C. Boettcher, Langmuir, 2013, 29, 4948–4958 CrossRef PubMed; (c) K. Roodenko, H. M. Nguyen, L. Caillard, A. Radja, P. Thissen, J. M. Gordon, Y. N. Gartstein, A. V. Malko and Y. J. Chabal, J. Phys. Chem. C, 2013, 117, 20186–20192 CrossRef CAS.
- A. S. Davydov, Theory of Molecular Excitons, McGraw-Hill, New York, 1962 Search PubMed.
- M. Pope and C. E. Swenberg, Electronic Processes in Organic Crystals and Polymers, Oxford Science Publ., New York, 1999 Search PubMed.
- (a) H. von Berlepsch, C. Bottcher, A. Ouart, C. Burger, S. Dahne and S. Kirstein, J. Phys. Chem. B, 2000, 104, 5255–5262 CrossRef CAS; (b) H. von Berlepsch, S. Kirstein, R. Hania, C. Didraga, A. Pugzlys and C. Bottcher, J. Phys. Chem. B, 2003, 107, 14176–14184 CrossRef CAS; (c) F. Milota, V. I. Prokhorenko, T. Mancal, H. von Berlepsch, O. Bixner, H. F. Kauffmann and J. Hauer, J. Phys. Chem. A, 2013, 117, 6007–6014 CrossRef CAS PubMed.
- D. Vollhardt and U. Retter, Langmuir, 1998, 14, 7250–7254 CrossRef CAS.
- (a) H. Gruniger, D. Mobius and H. Meyer, J. Chem. Phys., 1983, 79, 3701–3710 CrossRef; (b) J. M. Pedrosa, M. T. M. Romero and L. Camacho, J. Phys. Chem. B, 2002, 106, 2583–2591 CrossRef CAS; (c) C. Roldán-Carmona, C. Rubia-Payá, M. Pérez-Morales, M. T. Martín-Romero, J. J. Giner-Casares and L. Camacho, Phys. Chem. Chem. Phys., 2014, 16, 4012–4022 RSC.
- P. O. J. Scherer, in Molecular Aggregate Spectra, ed. H. Kobayashi, World Scientific, Singapore, 1996 Search PubMed.
- H. Kuhn and H. D. Försterling, Principles of Physical Chemistry, John Wiley and Sons, New York, 2000 Search PubMed.
- C. Roldán-Carmona, J. J. Giner-Casares, M. Pérez-Morales, M. T. Martín-Romero and L. Camacho, Adv. Colloid Interface Sci., 2012, 173, 12–22 CrossRef PubMed.
- N. K. Ibrayev, E. V. Seliverstova, A. R. Tenchurina, A. A. Ishchenko and A. Y. Shargaeva, Russ. J. Phys. Chem. A, 2013, 87, 2082–2088 CrossRef CAS.
- J. J. Giner-Casares, M. Pérez-Morales, H. J. Bolink, E. Muñoz, G. de Miguel, M. T. Martín-Romero and L. Camacho, J. Colloid Interface Sci., 2007, 315, 278–286 CrossRef CAS PubMed.
- S. Vaidyanathan, L. K. Patterson, D. Mobius and H. R. Gruniger, J. Phys. Chem., 1985, 89, 491–497 CrossRef CAS.
- (a) D. Honig, G. A. Overbeck and D. Mobius, Adv. Mater., 1992, 4, 419–424 CrossRef; (b) H. Yamagata and F. C. Spano, J. Phys. Chem. Lett., 2014, 5, 622–632 CrossRef CAS PubMed.
- J. Sondermann, Liebigs Ann. Chem., 1971, 749, 183–197 CrossRef CAS.
- M. T. Martin, I. Prieto, L. Camacho and D. Mobius, Langmuir, 1996, 12, 6554–6560 CrossRef CAS.
- D. Honig and D. Mobius, Thin Solid Films, 1992, 210, 64–68 CrossRef.
Footnotes |
| † Electronic supplementary information (ESI) available. See DOI: 10.1039/c5ra05192d |
| ‡ Present address: Bionanoplasmonics Laboratory, CIC biomaGUNE, Paseo de Miramón 182, 20009 Donostia – San Sebastián, Spain. |
| This journal is © The Royal Society of Chemistry 2015 |