Amar Hens and
Kajal Krishna Rajak*
Inorganic Chemistry Section, Department of Chemistry, Jadavpur University, Kolkata, 700 032, India. E-mail: kajalrajak@hotmail.com
First published on 13th April 2015
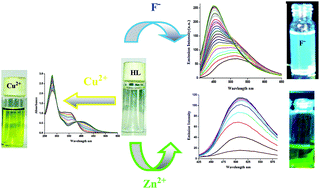
Through click chemistry, salicylaldehyde and fluorene groups have been explored to recognize anions through O–H⋯A– hydrogen-bonding complexation followed by an ESIPT mechanism and cation sensing via CHEF and CHEQ mechanisms for Zn2+ and Cu2+ metal ions respectively. Herein, we demonstrate evidence of the interactions between the O–H bond and F− which were studied by fluorescence spectroscopic, UV-Vis spectroscopic, lifetime spectroscopic, 1H NMR spectroscopic titrations and theoretical treatment. This sensor could simultaneously detect two biologically important metal ions (Cu2+ and Zn2+) through colorimetric methods in mixed aqueous solution. The 2
:
1 binding stoichiometry ratio of the ligand and metal in the complexes was established by UV-Vis, fluorescence, 1H NMR and ESI-MS spectroscopy, and their corresponding association constants, Kassoc observed at 8.13 × 10⁴ and 5.12 × 10⁶ M−1 corresponds to Zn2+ and Cu2+ metal ions in aqueous buffer–CH3OH (2
:
1, v/v) at pH 7.2. In addition, the electronic structures and photo physical properties of the ligand and complexes were calculated by DFT and time-dependent DFT (TDDFT) methods.
Hydrogen-bond donors such as pyrrole/calixpyrrole, (thio)urea, guanidinium, azophenol, dipyrrolylquinoxalines, indolocarbazoles, (di)amino, amide, and (benzo)imidazole usually act as anion binding sites.5 Fluoride is a strong hydrogen bond acceptor and has a high affinity for silicon and boron. There are many reported organoboron compounds which have also been shown to be effective fluorescent sensors for the selective detection of fluoride ions.6 The synthesis of such a sensor is not an easy task. Herein we have very easily synthesized a HL sensor containing a phenolic proton with a fluorene moiety which is highlighted with excellent photophysical and photochemical properties such as large extinction coefficients, good photostability with blue emission light in the presence of fluoride anions under a UV lamp. The blue emission is based on the deprotonation of the O–H bond, displaying “off–on” changes in its fluorescence emission upon the addition of fluoride ions followed by the ESIPT7 mechanism.
Amongst the various important heavy metal ions in the human body, zinc is the second most abundant metal ion and thus, detection of Zn2+ is shown to have considerable interest in chemistry. As we know, the disorders of zinc metabolism are closely associated with many severe neurological diseases such as Alzheimer’s disease (AD) and Parkinson’s disease.8 Therefore, the detection of Zn2+ in biological samples is of significant interest and importance. Our fluorescent probe can bind selectively to Zn2+ in the presence of other important biological metal ions such as Na+, K+ etc., resulting in a change in the fluorescence intensity with green emission light present under a UV lamp. This change in emission intensity arises due to a decrease in the rate of the PET mechanism acting on the lone pair electrons of the O and N atoms of the sensor as well as increasing the CHEF9 process during the complexation. Besides some available Zn2+ sensors10 have difficulty in distinguishing Zn2+ from Cd2+, since cadmium is in the same group of the periodic table and has similar properties to Zn2+. But our designed sensor is a highly selective and sensitive fluorescence sensor for Zn2+ detection without any interference from other metal ions, especially Cd2+, which is one of the most important objectives.
Copper is third in abundance (after iron and zinc) among the essential transition metal ions in the human body and plays a key role in a multitude of biological processes, mostly in the active center of enzymes where it has a major role in electron transfer reactions.11 Colorimetric sensors have attracted a lot of attention for the “naked-eye” detection properties in a straightforward and inexpensive manner, offering qualitative and quantitative information without using expensive equipment. This sensor changes color from colorless to intense yellow in the presence of a very low concentration of copper ions (10 ppm) in addition to the emission intensity of the sensor being almost completely quenched in the presence of copper ions following the CHEQ mechanism. The World Health Organization (WHO) has recommended the maximum limit of copper in drinking water to be 30 μM.12
Some aspects of these unforeseen findings were rationalized by DFT and TDDFT calculations. We also calculated and analyzed the singlet ground state natural transition orbitals (NTOs) derived from the TDDFT results and compared them with the ground state molecular orbitals (MOs) obtained from the DFT calculations. The computational modeling of the NMR parameters is also of abiding interest, and such DFT calculations have emerged as a promising approach for the prediction of nuclear shielding and coupling constants of NMR active nuclei.13 Thus, we computed the proton NMR chemical shifts and also the 1H–1H spin–spin coupling constants using the gauge-independent atomic orbital (GIAO)-DFT method, which was aimed at providing definitive characterization of the sensor. The solid-state structure of the complex stays in solution, as revealed by the combined experimental and theoretical NMR spectral analyses.
Caution! Perchlorate salts are highly explosive, and should be handled with care and in small amounts.
![]() | (1) |
The fluorescence decay data were collected with a Hamamatsu MCP photomultiplier (R3809) and were analyzed using IBH DAS6 software. The observed decays of the complex fitted well with a bi-exponential function as in eqn (2) and (3), where τ1 and τ2 are the fluorescence lifetimes and α is the pre-exponential factor. For the fits, reduced χ2 values are around one, and the distribution of weighted residuals was random among the data channels. τf is the mean fluorescence lifetime (the meaning of the symbol is standard).15b All absorption and emission spectral measurements were performed with appropriate background corrections and with freshly prepared solutions only.
I(t) = [α1 exp(−t/τ1) − α2 exp(−t/τ2)]
| (2) |
| τf = α1τ1 + α2τ2 | (3) |
To calculate the stability of the keto tautomeric form over the enol form for the ligand (HL) in the excited S1 state we performed the potential energy scan according to the “distinguished coordinate approach”20 i.e. by specifying a reaction coordinate (in the present case it is the coordinate for the translocation of the proton from Odonor to Nacceptor, i.e. elongation of the Odonor–H bond axis) along which the energy change was observed. For the excited S1 state all of the other degrees of freedom were relaxed without imposing any symmetry constraints.
The geometrical structures of complexes 1, [ZnL2], and 2, [CuL2], in their singlet ground (S0) state were fully optimized in solution phase without any symmetry constraints. The vibrational frequency calculation was also performed for all the complexes to ensure that the optimized geometries represent the local minima and there are only positive eigen values. Finally to understand the nature of excited states involved in absorption processes, natural transition orbital (NTO) analysis was performed for all complexes.21
The effective core potential (ECP) approximation of Hay and Wadt was used for describing the (1s22s22p6) core electron for zinc and copper whereas the associated “double-ξ” quality basis set LANL2DZ was used for the valence shell.22 For H atoms, we used a 6-311+G basis set and for C, N and O atoms, we employed 6-311+G** as the basis set for the optimization. The calculated electronic density plots for frontier molecular orbitals were prepared using the GaussView 5.0 software. All the calculations were performed with the Gaussian 09W software package.23 The GaussSum 2.1 program24 was used to calculate the molecular orbital contributions from groups or atoms.
In addition, the 1H NMR properties of complex 1 were calculated using the magnetic field perturbation method with the GIAO algorithm25 and the NMR = spin–spin keyword incorporated in the Gaussian 09W program. The relative chemical shift of a given nucleus X in the molecule was defined as δcalcX [ppm] = σrefX − σcalcX where TMS was used as a reference molecule optimized at the same level of theory.26 In order to account for the solvent effect, we used the integral equation-formalism polarizable continuum model (IEFPCM) method.27
| HL | |
|---|---|
| a R1 = ∑∣∣F0∣ − ∣Fc∣∣/∑∣F0∣.b wR2 = [∑[w(F02 − Fc2)2]/∑[w(F02)2]]1/2. | |
| Formula | C20H15NO |
| Mr | 285.33 |
| Crystal system | Monoclinic |
| Space group | P21/c |
| a/Å | 16.0198(4) |
| b/Å | 8.2129(2) |
| c/Å | 11.1102(3) |
| α/° | 90 |
| β/° | 97.047(1) |
| γ/° | 90 |
| V/Å3 | 1450.72(6) |
| Z | 4 |
| Dcalcd/mg m−3 | 1.306 |
| μ/mm−1 | 0.080 |
| θ/° | 2.6–27.6 |
| T/K | 293(2) |
| Reflns collected | 3366 |
| R1a, wR2b [I > 2σ(I)] | 0.0547, 0.1671 |
| GOF on F2 | 1.03 |
N) 1615; ν(C
C) 1446, 1090 and 620.
N) 1598; ν(C
C) 1436 and 1410. Molar conductance, ΛM: (CH3CN) 8 Ω−1 cm2 mol−1.
N) 1588; ν(C
C) 1443 and 1390. Molar conductance, ΛM: (CH3CN solution) 12 Ω−1 cm2 mol−1. Epc (CuII/CuI): −0.85 V (irr).
:
2 in methanol at room temperature in air produces complexes with compositions [Zn(L)2] 1 and [Cu(L)2] 2 in excellent yields. In the complexes, the ligand HL binds as a monoanionic N, O coordinating bidentate ligand and forms a neutral complex. The elemental analysis, 1H NMR, IR spectroscopic and mass spectroscopic measurements confirmed the formation of the synthesized complexes. A schematic representation for the synthesis of the complexes is given in Scheme 1.
Both the ligand and complexes were diluted with acetonitrile for mass spectrometry. Mass spectral analysis in the positive ion mode showed major peaks at m/z (%) = 286.1296 (100), 655.1146 and 632.1911 (100), which were assigned to the monocationic protonated ligand [HL1 + H]+, [Zn + Na]+ and [Cu + H]+, the respective spectra are given in ESI (Fig. S1–S3†).
The ligand and complex 1 are diamagnetic and display well resolved 1H NMR spectra. For the complex, the NMR spectra were measured in CD3CN solution, whereas, HL was dissolved in CDCl3 solution. In HL the phenolic proton (H1) was observed as a singlet at a greater deshielded field near 13.41 ppm, whereas the chemical shift of 8.71 ppm was associated with the proton (H7) adjacent to the azomethine group of the coordinated ligand. The aromatic proton span for the ligand was observed in the range 7.83–5.93 ppm. The methylene proton (H18) showed a sharp singlet at 3.95 ppm. As shown in Fig. 1, the peak that appears at a high deshielded field for the phenolic proton (H1) in HL completely disappears in the 1H NMR spectrum of complex 1. On the other hand, the azo methane proton (H7) undergoes down field shifting to 9.19 ppm and the methylene proton (H18) shows splitting due to the loss of symmetry during complexation and undergoes up field shifting to 3.95 and 3.88 respectively. The correlation between the experimental and calculated 1H NMR chemical shifts of 1 is shown in ESI Fig. S4† as a representative case.
![]() | ||
| Fig. 1 The 1H NMR spectra of HL and 1 with changes in the spectral nature of both the aromatic and aliphatic regions given. | ||
IR spectra of the ligand and complexes were recorded as KBr disks. HL showed a broad band near at 3500 cm−1 which arises due to asymmetric vibration of both the O–H and Csp2–H groups. In both complexes this band appears as a very small peak due to absence of the OH group during complexation (ESI Fig. S5†). The band at 1615 cm−1 due to the azomethine group of the Schiff base underwent a shift to a lower frequency (1580–1590 cm−1) after complexation, indicating the coordination of the azomethine nitrogen to the metal atom and this can be explained by the donation of electrons from nitrogen to the metal atom. The bands in the region of 1500–1350 cm−1 are consistent with the skeletal vibration of the aromatic system. The nature of metal–ligand bonding is confirmed by the newly formed band at ∼430 cm−1 in the spectrum of the complexes which is tentatively assigned to M–N vibration.
Cyclic voltammetry was performed for complex 2 in methanol solution at room temperature under a nitrogen atmosphere, with tetraethylammonium perchlorate (TEAP) as the supporting electrolyte using a Pt electrode as the working electrode. The potentials were referenced to the saturated calomel electrode (SCE) without junction correction. The complex also showed a quasi-reversible peak in the negative region, characteristic of the Cu(II) to Cu(I) couple at Epc = −0.85 V, with the associated irreversible anodic peak at Epa = 0.82 V which is diagnostic of a quasireversible one-electron transfer controlled by diffusion following the equation Cu(III)L + e → Cu(II)L.30b
Complex 1 is EPR silent both in solution and in the solid state whereas complex 2 is EPR active. The EPR spectrum of complex 2 in the solid state is given in Fig. 2. The spectrum is characterized by an axial pattern with the features g| > 2.1 > g⊥ > 2 (g| = 2.282, g⊥ = 2.05). Fig. 2c depicts the spin density plot of complex 2. The electron density of the coordinating atom (N, O) of the sensor is distributed over the empty d-orbital of the copper metal ion. This type of distribution of electron density of a metal center is the origin of an EPR active complex.
N distance is 1.268 Å. The internuclear distance between the imine nitrogen atom and phenolic oxygen atom is 2.587 Å. There is a possibility of intramolecular hydrogen bonding between the above stated atoms. In the crystal packing, several non-covalent interactions such as hydrogen bonding, C–H/π, π⋯π were found. The C–H/π interactions are generated by interactions of H2, H16 and H26 with the centroid of the rings Cg(1), Cg(3) and Cg(4) respectively. The π–π stacking interaction is found to be involved in the Cg(1)–Cg(4) rings with a centroid-to-centroid distance of 3.273(18) Å. An extended 2D network perspective view is given in ESI Fig. S6.†
| Solvent | Hexane | Toluene | DCM | CH3OH | DMF |
|---|---|---|---|---|---|
| Transition (S0 → S1) | 1ILCT | 1ILCT | 1ILCT | 1ILCT | 1ILCT |
| Oscillator strength (f) | 0.8325 | 0.5856 | 0.5877 | 0.9725 | 0.6019 |
| λtheo (nm) | 362.19 | 357.78 | 352.01 | 349.40 | 342.89 |
| λexp (nm) | 358 | 354 | 350 | 347 | 344 |
| Excitation energy (eV) | 3.6987 | 3.7231 | 3.7420 | 3.7679 | 3.7756 |
| Process | Electronic transitions | Composition | Excitation energy | Oscillator strength (f) | CI | λexp (nm) | |
|---|---|---|---|---|---|---|---|
| HL | Absorption | S0 → S1 | HOMO → LUMO | 3.7679 eV (349.40 nm) | 0.9725 | 0.6990 | 347 |
| Emission | S1 → S0 | LUMO → HUMO | 2.7569 eV (504.63 nm) | 0.5051 | 0.7057 | 511 | |
| FHL | Absorption | S0 → S1 | HOMO → LUMO | 3.8933 eV (325.07 nm) | 0.2730 | 0.4879 | 322 |
| Emission | S1 → S0 | LUMO → HUMO | 3.1005 eV (439.70 nm) | 0.5263 | 0.7057 | 450 |
To get a better insight on the experimental photophysical values, TDDFT calculations were performed for the ligand on the basis of the optimized geometry both in the singlet ground state (S0) and excited state (S1) in solution. The absorption energies associated with their oscillator strengths, the main configurations and their assignments calculated using the TDDFT method using the S0 geometry for HL are given in Table 3. In the case of the ground state (S0) the electron density at the HOMO is delocalized over the entire system, while in the case of the LUMO it originates from the contribution of both the salicylaldehyde (54%) and azomethine (35%) moieties. The excitation energy is 3.7377 eV and this is due to HOMO → LUMO transitions with ILCT character. Frontier molecular orbitals involved in the UV-vis absorption of HL are given in Fig. 4a. In summary, the TDDFT calculations revealed that the ILCT process occurred from the aminofluorene moiety (donor) to the salicylaldehyde moiety (acceptor).
In order to study the emission properties, a potential energy scan of HL was performed. As shown in ESI Fig. S8,† the keto (dihedral angle between the two planes made by the salicylaldehyde moiety and the aminofluorene moiety is 0.09°) tautomeric form is more stable by 1.882 kcal mol−1 than the corresponding less planar enol form (dihedral angle between the two planes is 6.1°). In the excited state proton transfer takes place from the less planar enol tautomeric from to the more stable coplanar keto tautomeric form. Hence the emission of the ligand is attributed to the ESIPT mechanism. The energy gap between the S0 and S1 states, calculated with the optimized S1 state geometry, is the fluorescence emission wavelength. This geometry relaxation upon photo excitation imparts a remarkable effect on the energy level of the molecular orbitals. In the case of HL the LUMO is stabilized by 0.4829 eV at the S1 state geometry compared to that at the S0 state geometry while the HOMO is destabilized by 0.5794 eV for the S1 state geometry compared to that at the S0 state geometry. As a result, the energy difference between the HOMO and LUMO is greatly decreased at the S1 state compared to that at the S0 state geometry and this geometry relaxation is the main origin of the large Stokes shift. The fluorescence wavelength was calculated as 504.63 nm (in CH3OH) which is in very good agreement with the experimental value of 511 nm.
:
1, v/v) at pH 7.2. However, the addition of F− induced a large blue shift in the absorption peaks at 322 nm passing through an isosbestic point at 329 nm, indicating the formation of a new species upon treatment of HL with F−. Interactions with other anions (Cl−, Br−, I−, OAc−, SO42−, Pi−, PF6−, CN− and PPi−) were investigated using spectrophotometric titrations. The strong absorption intensity at 322 nm was observed only for the fluoride anion while the other anions remained silent. This may be due to electronic excitation through charge transfer from the aminofluorene and the fluoride moiety to the salicylaldehyde moiety of the ligand (Fig. 4b). The inset of Fig. 5 gives [A−]/([A] + [HL]) = 0.5 which confirms 1
:
1 binding with HL and the fluoride anion to form the [FHL]− compound. To get better agreement with the experimental photophysical values, TDDFT calculations were performed for the [FHL]− on the basis of the optimized geometry both in the singlet ground state (S0) and excited state (S1) in methanolic solvent.
The absorption energies associated with their oscillator strengths, the main configurations and their assignments calculated using the TDDFT method and the S0 geometry for [FHL]− is discussed here (vide infra). The energy difference between the HOMO and the LUMO is 3.9 eV. The calculated absorption bands are located at 322.66 nm, which is in good agreement with the experimental result. These absorption bands can be assigned to ICT with some rearrangement of electron density from fluoride to the ligand moiety. Here, the expectation is that the deprotonation facilitated by the fluoride anion will generate strong intramolecular charge transfer (ICT), which would lead to the enhancement of the HOMO–LUMO energy of the FHL compound which is 0.1254 eV higher than the free ligand form, finally resulting in hypsochromic shift around 30 nm.
:
1, v/v) at pH 7.2. This clearly indicates a ‘turn-on’ response of the synthesized chemo sensor of HL. The inset of Fig. 6 shows a plot of emission intensity at 450 nm against the titration of F− from 0 to 1.1 equivalents. It is clear from the plot that the fluorescence intensity reaches a plateau after the addition of exactly 1.0 equivalent of F− ions and there is no significant enhancement of the fluorescence intensity on further addition of F−. This result strongly corroborates with the formation of the 1
:
1 [FHL]− compound.
| C–O (Å) | O–H (Å) | F–H (Å) | Energy | (C6, C7, N1, C8) (°) | |
|---|---|---|---|---|---|
| A[F⋯HL] | 1.3941 | 1.0206 | 1.5849 | −1001.07617 | 41.7 |
| B[FH⋯L] | 1.3001 | 1.4132 | 1.0421 | −1001.07915 | 1.09 |
This type of geometrical relaxation is the origin of the emission enhancing properties as well as the proton transfer from the oxygen atom to the fluoride atom which is the mechanistic cause of the emission properties (ESIPT). The potential energy scans of both systems (HL and FHL) indicate that they pass through a minimum and the optimized configurations at these minima appeared due to proton transfer which takes place from the oxygen atom to the nitrogen atom for HL and the fluoride ion for FHL. As shown in Fig. 4 the HOMO–LUMO energy gap of the S1 state of the polar FHL system is more than for HL itself, as a result the former gives comparatively shorter wavelength emission maxima (λem 450) than the latter (λem 515) and continuously emits blue emission light in the presence of a UV lamp (Fig. 6c). The quantum yield determination of FHL gave Φ = 0.127, while the free ligand was found to be very weakly fluorescent Φ = 0.011. The increase in emission intensity was approximately 10 times in the presence of F− which accounted for the transfer of the phenolic proton and could be used as a fluoride ion selective luminescent probe. All these findings indicate that HL behaves as a highly sensitive fluorescent F− sensor.
:
1, v/v) at pH 7.2 which displayed well-defined bands at 272 nm and 350 nm. The cation binding affinities of HL toward Na+, K+, Ca2+, Mn2+, Cr3+, Co2+, Ni2+, Cu2+, Cd2+ and Zn2+ were investigated using UV-vis spectroscopy. However, no such significant change in the UV-vis spectrum was observed for intracellular metal ions such as K+, Na+ and Ca2+ whereas other transition metal ions including Mn2+, Cr3+, Co2+, Ni2+ and Cd2+ induced a small bathochromic shift of ∼10 nm. Surprisingly a larger amount of red shift (∼60 nm) was observed when the experiment was carried out with Zn2+ and Cu2+ ions. Fig. 9 shows a representative UV-vis titration curve of HL with various concentrations of Zn2+ ions. After the addition of Zn2+ ions a change in color of the solution from colorless to yellow occurs, which can be seen by the naked eye. It was observed that with increasing the concentration of Zn2+ ions the absorption intensity of the free ligand HL at 273 nm and 352 nm slightly decreased, while a new peak appeared at a longer wavelength (405 nm) with three well-defined isosbestic points at 249 nm, 285 nm and 376 nm. It should be noted that there were no changes in the absorption intensity both at 273 nm, and 405 nm after the addition of in excess of 1.0 equivalent of Zn2+ ions with respect to 2.0 equivalents of HL. The UV-vis titration of HL with the Cu2+ ion also maintained a similar trend. It passes through two distinguished isosbestic points at 299 nm and 381 nm. However, a significant change in the spectrum was observed during the addition of Cu2+ ions, the absorption at 273 nm increased while for Zn2+ the reverse phenomenon happened (ESI Fig. S10†). A Job’s plot of absorption intensity shows maxima which correspond to a ∼0.5 mole fraction indicating the 2
:
1 complex formation of HL with Zn2+ (Fig. 9) as well as with Cu2+ (Fig. S10†). Compared with other detection methods, colorimetric detection offers the advantages of simplicity, rapidity, and cost effectiveness.31 Therefore, the colorimetric detection method is extremely attractive in chemical and biological analyses. The N, O bidentate Schiff base type receptor HL showed color changes from colorless to intense yellow in the presence of Cu2+ and Zn2+ ions, while other metal ions caused no change in color (Fig. 9). Thus, it is very difficult to characterize these two specific metal ions with the naked eye, but we can easily distinguish them by their emission spectral behavior. Fortunately, complex 1 exhibited fluorescence with strong green emission under a UV lamp but 2 did not.
Metal d-orbital involvement was detected in complex 2 while complex 1 remained silent. The calculated absorption bands are located at 400 and 270 nm for both complexes which is in good agreement with the experimental results respectively (Table 5).
| Complex | Electronic transitions | Composition | Excitation energy | Oscillator strength (f) | CI | Assign | λexp (nm) |
|---|---|---|---|---|---|---|---|
| 1 | S0 → S1 | H → L | 3.0984 eV (400.15 nm) | 0.1378 | 0.69830 | 1ILCT | 405 |
| S0 → S2 | H − 1 → L | 3.1205 eV (397.32 nm) | 0.6449 | 0.30222 | 1ILCT | ||
| H → L + 1 | 0.63466 | ||||||
| S0 → S21 | H − 11 → L | 4.5541 eV (272.25 nm) | 0.6297 | 0.24933 | 1ILCT | 273 | |
| H − 11 → L + 1 | 0.11578 | 1ILCT | |||||
| H − 10 → L + 1 | 0.12071 | 1ILCT | |||||
| H − 9 → L | 0.14564 | 1ILCT | |||||
| H − 8 → L + 1 | 0.28112 | 1ILCT | |||||
| H − 7 → L | 0.17342 | 1ILCT | |||||
| H − 7 → L + 1 | 0.24887 | 1ILCT | |||||
| H − 6 → L | 0.31692 | 1ILCT | |||||
| H − 6 → L + 1 | 0.10197 | 1ILCT | |||||
| H − 5 → L + 1 | 0.15031 | 1ILCT | |||||
| H − 4 → L | 0.13388 | 1ILCT | |||||
| H − 4 → L + 1 | 0.10667 | 1ILCT | |||||
| 2 | S0 → S2 | H → L | 3.0107 eV (411.81 nm) | 0.7891 | 0.68245 | 1MLCT/1ILCT | 413 |
| H → L + 1 | 0.16712 | 1MLCT/1ILCT | |||||
| S0 → S3 | H → L + 1 | 3.0232 eV (410.10 nm) | 0.1090 | 0.67032 | 1ILCT | ||
| H → L | 0.16889 | 1MLCT/1ILCT | |||||
| H − 2 → L | 0.12722 | 1ILCT | |||||
| S0 → S18 | H − 4 → L | 4.4161 eV (280.75 nm) | 0.1778 | 0.59422 | 1ILCT | 275 | |
| H − 4 → L + 1 | 0.10913 | 1ILCT | |||||
| H − 3 → L | 0.31065 | 1ILCT | |||||
| H − 2 → L | 0.11227 | 1MLCT/1ILCT | |||||
| S0 → S19 | H − 8 → L | 4.4558 eV (278.26 nm) | 0.1234 | 0.36746 | 1ILCT | ||
| H − 4 → L + 3 | 0.18716 | 1MLCT/1ILCT | |||||
| H − 4 → L + 4 | 0.47200 | 1MLCT/1ILCT | |||||
| H − 3 → L + 2 | 0.19413 | 1MLCT/1ILCT | |||||
| H − 3 → L + 4 | 0.16535 | 1ILCT | |||||
| H − 2 → L + 3 | 0.19163 | 1MLCT/1ILCT | |||||
| H − 2 → L + 4 | 0.23925 | 1MLCT/1ILCT | |||||
| H → L + 3 | 0.12363 | 1MLCT/1ILCT | |||||
| H → L + 4 | 0.17214 | 1MLCT | |||||
| H → L + 5 | 0.18848 | 1MLCT |
:
1, v/v) at pH 7.2. Fig. 11 shows the fluorescence intensity of HL in the presence of different metal ions. Only Zn2+ resulted in a pronounced fluorescence enhancement, whereas other transition metal ions Ni2+, Co2+, Mn2+, Cd2+ and Cr3+ did not induce fluorescence even at concentrations 10-fold higher than the corresponding Zn2+ ion concentration, as there is a higher probability of an electron and energy transfer between the metal ion and ligands with Zn2+.
It is interesting to note that the fluorescence intensity of HL in the presence of Cu2+ is significantly quenched. When the experiment was carried out with ubiquitous intracellular metal ions such as K+, Na+ and Ca2+, which exist at very high concentrations inside cells, no significant fluorescence was observed, even at concentrations that were 100-fold higher than the Zn2+ ion concentration. Metal-ion selectivity was also examined to probe if HL could be used as a selective sensor for Zn2+ in the presence of other competitive cations found in biological systems. Emission spectra were measured for a 2
:
1 mixture of HL and Zn2+ in the presence of other metal ions. The prominent fluorescence enhancement observed upon mixing HL and Zn2+ remained unchanged, even in the presence of a 100-fold excess of metal ions such as K+, Na+, and Ca2+ (Fig. 11, purple bars). This confirms the excellent selectivity of HL for Zn2+ over other abundant cations. Notably, the fluorescence intensity of the zinc complex was partially quenched in the presence of metal ions such as Mn2+, Cr3+, Ni2+, Cd2+ and Co2+ when used in 10-fold excess.
:
1, v/v) at pH 7.2. It can be seen that the ligand showed one intense peak at 512 nm during excitation at 405 nm with a larger slit width (ex/em: 10/10) and the fluorescence intensity gradually decreases in presence of Cu2+. It is observed that there is no change in the intensity at 512 nm after the addition of an excess of 1.0 equivalent of the Cu2+ ion with respect to 2.0 equivalents of HL.
log(F0 − F)/F = log K + n log[Mn+]
| (4) |
This result corroborated with the formation of a 1
:
2 (M
:
L) complex in solution. This change in fluorescence intensity at 512 nm is used to estimate K for the binding of Cu2+ to HL using eqn (4).32 Here F0 and F are the fluorescence intensity of the fluorophore, at 512 nm in the absence and the presence of different concentrations of Cu2+ respectively. Fig. 12(c) shows a linear plot passing through the origin for (F0 − F)/F vs. [Cu2+] (n = 1). From this, according to eqn (4), the value of K was estimated to be 5.12 × 10⁶ M−1, for Cu2+ towards HL. The reaction of Cu2+ with the chelating agent HL induced rigidity in the resulting molecule and produced a large CHEQ effect which further induced a decrease in the fluorescence intensity.
:
1, v/v) at pH 7.2. The sensor showed weak emission probably because of quenching by the occurrence of a photo induced electron transfer (PET) process due to the presence of a lone pair of electrons on the donor atoms in the ligands (N, O donor).33 A gradual enhancement (∼12 fold) of the fluorescence intensity was observed at 512 nm upon increasing the concentration of Zn2+ ions. The reaction of Zn2+ with the chelating agent HL induced rigidity in the resulting molecule and produced a large CHEF effect which further induced the large enhancement of the fluorescence.34 Fig. 12(b) shows a plot of emission intensity at 512 nm against the titration of Zn2+ from 0 to 1.2 equivalents. It is clear from the plot that the fluorescence intensity reaches a plateau after the addition of exactly 1.0 equivalent of Zn2+ ions and there is no significant enhancement of the fluorescence intensity on further addition of Zn2+. This result strongly corroborates with the formation of a 1
:
2 (M
:
L) complex. Assuming a 1
:
2 association between Zn2+ and HL, the binding constant is determined with the help of the Benesi–Hildebrand equation, given as:35| (Fmax − F0)/(F − F0) = 1 + 1/K[Zn2+] |
:
1 stoichiometry. The intercept value 1.05 ± 0.5, close to 1.0, also manifests the self-consistency of the experimental data. Therefore, the ligand association constant K is the reciprocal of slope, 8.13 × 10⁴ M−1. The 1
:
2 complex formation in solution was further confirmed by ESI-MS+-(m/z) analysis (see Experimental section).
:
1, v/v) at pH 7.2. The sensor exhibited a large blue shift (32 nm) in absorption and a drastic ratiometric fluorescent response (I450/I511 = 7.4) to fluoride anions with intense blue light emission, whereas it exhibited a large red shift (61 nm) in absorption and a drastic ratiometric fluorescent response (I520/I511 = 10.3) to zinc cations with intense green light emission. Density functional theory and time-dependent density functional theory calculations were conducted to rationalize the optical response of the sensor. We expect that the unique ESIPT character of the phenolic proton to the azomethine platform for anion sensing and the CHEF character for cation sensing will be widely employed to construct a wide variety of ratiometric fluorescent sensors based on the ICT signaling mechanism. In addition this sensor could simultaneously detect two Cu2+ and Zn2+ metal ions through colorimetric methods in mixed aqueous solution.
Footnote |
| † Electronic supplementary information (ESI) available: X-ray crystallographic file in CIF format for HL; Fig. S1–S12 and Table S1. CCDC 1054382. For ESI and crystallographic data in CIF or other electronic format see DOI: 10.1039/c5ra05145b |
| This journal is © The Royal Society of Chemistry 2015 |