Hydrothermal synthesis of nitrogen doped graphene nanosheets from carbon nanosheets with enhanced electrocatalytic properties

Deepa Suhaga, Anirudha Singhb, Sourav Chattopadhyayc, Sandip Chakrabarti*d and Monalisa Mukherjee*a
aBiomimetic and Nanostructured Materials Research Laboratory, Amity Institute of Biotechnology, Amity University Uttar Pradesh, Sector-125, Noida, India. E-mail: mmukherjee@amity.edu
bFaculty of Translational Tissue Engineering Center & Department of Urology, Johns Hopkins School of Medicine, John Hopkins University, Baltimore, Maryland, USA
cDepartment of Electronics, Ramakrishna Mission Residential College, Narendrapur, Kolkata-700103, India
dAmity Institute of Nanotechnology, Amity University Uttar Pradesh, Sector-125, Noida, India

Received 22nd March 2015 , Accepted 21st April 2015

First published on 24th April 2015


Abstract

Synthesis of nitrogen doped graphene nanosheets (NGS) with controlled structure is a burgeoning issue in the field of materials chemistry. Herein, we for the first time report a novel, green, low-temperature, hydrothermal synthesis of two dimensional (2D), porous, NGS from carbon nanosheets (CNS) as precursor materials. Hydrothermal reduction of CNS not only imparts crystallinity to the material but also results in a substantial removal of oxygen functionalities, forming NGS. The as-synthesized NGS displayed excellent electrochemical sensing properties with high selectivity and sensitivity for the detection of dopamine (DA) in human urine samples. NGS can easily distinguish the electrochemical oxidation peak for DA from that of uric acid (UA), which is a common interferent for DA detection. The electrochemical oxidation peak current of DA linearly varies within the concentration range of 0.1 to 100 μM, having remarkable sensitivity (2.661 μA μM−1) and a lower detection limit upto 100 nM, with a correlation coefficient (R2) of 0.9880. The separation of electrooxidation peak potential for DA–UA is extraordinarily high (0.37 ± 0.05 V). In contrast to carbonized carbon material (CCM), reduced graphene oxide (rGO) and other carbon materials, the current response for NGS is three folds higher at the same DA concentration with higher electrocatalytic response. Furthermore, superior electrochemical sensitivity and selectivity along with enhanced electrocatalytic properties of NGS for DA detection is metal/metal oxide free, which are usually employed for electrode modification to achieve higher current response. Henceforth, we believe that NGS synthesis offers great promises for creating a revolutionary new class of nanostructured electrodes for biosensing applications.

Introduction

Graphene is a unique sp2 bonded carbon allotrope which has attracted a huge degree of attention in the last decade. This is due to its extraordinary application potential in the field of nanoelectronics,1,2 capacitors3 and sensors.4,5 The potential applicability of graphene is sometimes restricted due to its high cost of production and low yield. Since the first report of the synthesis of graphene, various strategies have been pursued to fabricate single or multiple layer graphene by liquid phase exfoliation of graphite, chemical vapour deposition,1 chemical reduction or thermal exfoliation of graphene oxide (GO).6,7 Among these procedures, chemical reduction of GO is one of the most prominently used methods.8,9 Hitherto, the reduction of GO included several organic or inorganic toxic reductants are extremely difficult to eliminate, thereby increasing the sheet resistance along with rendering the as-synthesized sheets highly toxic in nature.10 Therefore, the use of highly toxic agents to reduce GO remains a serious challenge for the large scale production of graphene nanosheets (GNS). Various other procedures, including photocatalytic reduction of GO11 and electrochemical reduction of GO12 have also been reported for the production of GNS. However, these applications are further limited by the lack of low cost and bulk production of GNS.

There have also been previous reports on synthesis of GNS from carbon nanosheets (CNS) where the carbonization temperatures at which the synthesis was carried out were very high (∼500–2000 °C). CNS are a new class of freestanding, two-dimensional materials comprised of multiple layers of graphene with an intermediate structure between graphite and graphene. In addition to excellent thermal and electrical conductivity, CNS possess exceptional surface area, high chemical stability, thin edges and lightness.13–16 Two specific properties of CNS make them very promising in electrode material applications. First, their flake-like structures, which result in high surface-to-volume ratio, ensuring numerous interaction points; and second, in contrast to the nearly inert basal planes, the edge planes contain many open graphitic layers and crystal defects, which are highly reactive.17 Conventionally, CNS are synthesized by either top down or bottom up methods, such as solvothermal techniques,18 chemical vapor deposition (CVD)19–21 and chemical exfoliation.22–24

The nitrogen doped (N-doped) carbonaceous materials are particularly interesting as they are known to have higher electrocatalytic activity along with higher biocompatibility in comparison to their undoped equivalents.25,26 Nitrogen doping in carbon materials has been regarded as an effective way of tailoring their physicochemical properties, such as conductivity,27 catalytic activity,28 crystal structure as well as electronic structure of carbonaceous materials.29 These properties are of great significance in various application potentials, including electronic and catalytic systems as the N-doped carbons are known to exhibit exceptional electrocatalytic activity25,26 along with enhanced electrochemical stability and rapid ion transfer.30–32

However, it is very difficult to synthesize nanostructured carbon materials with high nitrogen content as well as graphitization degree at such harsh conditions. This is because such harsh conditions would result in elimination of N heteroatoms and collapse of carbon nanostructures.33,34

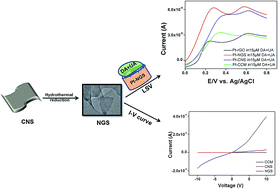
Recognizing these difficulties, we for the first time report a facile, low temperature, hydrothermal synthesis of nitrogen doped graphene nanosheets (NGS) by employing CNS as our precursor material (Scheme 1). Nitrogen was incorporated in CNS, using melamine as a soft template.18


image file: c5ra05060j-s1.tif
Scheme 1 Illustration of the synthesis of NGS based on hydrothermal reduction of CNS.

To evaluate electrochemical properties of NGS, we targeted the detection of electro active analytes, dopamine (DA) and uric acid (UA). DA is a key neurotransmitter in the human central nervous, hormonal, and cardiovascular systems. Several pathological disorders, such as Parkinson's disease and Huntington's disease are linked to alterations in DA concentration,35,36 which further necessitates the need to develop a new generation DA sensing electrode material. Furthermore, abnormal levels of UA, the primary end product of purine metabolism lead to several disorders like gout and hyperuricemia.36 Therefore, it is important to determine both DA as well as UA. However, selective and sensitive electrochemical determination of DA along with UA is very challenging, as both the analytes have similar oxidation potentials. Moreover, in biological fluids like blood and urine, UA is present in much higher concentrations as compared with DA. CNS coated on bare platinum (Pt) electrode as a DA sensing material with enhanced selectivity and sensitivity have been reported previously, although with drawbacks such as higher charge transfer resistance of the electrode and low repeatability. Hence, it is of critical importance to prepare a highly sensitive and selective electrode for the simultaneous determination of DA and UA. We, therefore synthesized NGS, where most of the oxygen functional groups were removed, resulting in very low charge transfer resistance by a green hydrothermal synthesis method and evaluated its electrochemical efficacy to detect DA in the presence of UA. NGS was also tested for interferences of coexisting substances present in human urine sample for DA detection.

Experimental section

Materials

Glycerol, melamine, dopamine and uric acid were purchased from Sigma-Aldrich. Concentrated sulphuric acid (98%) was purchased from Merck, Germany. All chemicals except melamine were used as received without further purifications.

5–10 ml of mid-stream urine was collected from normal individual to study dopamine sensing. The study was approved by the institution's ethical committee and informed consent was obtained from the human volunteers who readily agreed to give their urine sample. The experiments were performed in compliance with the relevant laws and institutional guidelines.

Synthesis

Graphene oxide (GO) was synthesized using a modified version of Hummer's method,22 and rGO was synthesized using reported procedures (SI 1). CNS was synthesized by improved literature procedure. Melamine was purified prior to use for the synthesis of CNS. In this method, melamine was dissolved in water containing caustic soda at an elevated temperature of about 130 °C. The resultant hot caustic liquor was then clarified by decantation or filtration. The solution was further cooled to room temperature, giving rise to crystallized, substantially pure melamine product. This purified melamine was employed for CNS synthesis (SI 1). It was revealed by Field Emission Scanning Electron Microscopy (FESEM) images that the product was devoid of any carbon spheres and comprised of only thin sheets, unlike the product obtained from previously reported procedure.18

Undoped CCM was also synthesized using only glycerol and sulphuric acid. In a typical procedure, 10 ml of 98% sulphuric acid was added to 10 ml of glycerol and stirred vigorously. The mixture was transferred to a 40 ml PTFE lined stainless steel autoclave and heated at 180 °C for 4 h under autogeneous pressure. The resulting black colored powder (undoped CCM) was then washed with acetone followed by deionized (DI) water. The synthesized CCM was dried over night at 50 °C in hot air oven (FESEM image of CCM, SI 2).37

Nitrogen was incorporated in CNS using melamine. The as-synthesized CNS was further reduced to form NGS via hydrothermal technique. The CNS material (0.25 g) was taken in a PTFE lined stainless steel autoclave containing deionized (DI) water and heated at 140 °C for 10 h under autogeneous pressure. The mixture (NGS) was then washed with acetone and large amount of DI water followed by drying under ambient conditions. NGS-5 was also synthesized by reducing CNS under identical reaction conditions for 5 h.

Characterization

Chemical composition

Unless otherwise stated Fourier transform infrared spectroscopy (FTIR) spectra were recorded using KBr pellets on a Nicolet-5DX FTIR spectrophotometer. The spectra were measured from 400 to 4000 cm−1. Raman spectroscopy analyses were performed using a confocal micro-Raman LabRam HR instrument (Horiba Scientific) in backscattering geometry with a CCD detector at 514.5 nm Ar laser and a 100× objective mounted on an Olympus optical microscope. Calibration was initially done using an internal silicon reference at 520 cm−1 which gave a peak position resolution of less than 1 cm−1. X-ray Photoelectron Spectroscopy (XPS) measurements were performed on a Kratos Axis Ultra Photoelectron Spectrometer which uses Al Kα (1253.6 eV) X-rays. Curve fitting and background subtraction were performed using Casa XPS version 2.2.73 software. CHN and O Elemental analysis were performed by Perkin-Elmer 2400 Series CHNS/O Analyser. Thermogravimetric analysis (TGA) were performed using Mettler-Toledo, TG850 in N2 atmosphere (flow rate = 50 ml min−1) in the temperature range 25–800 °C (heating rate = 5 °C min−1). The powder X-ray Diffraction (XRD) patterns were recorded in the 2θ range at room temperature by using CuKα radiation (PANalytical EMPYREAN).

Morphology

Field Emission Scanning Electron Microscopy (FESEM) was carried out on Zeiss Neon 40 EsB. Transmission Electron Microscopy (TEM) and High Resolution Transmission Electron Microscopy (HRTEM) were taken on a JEOL, JEM-2100F electron microscope at an acceleration voltage of 200 kV. Samples were prepared by drop casting the sample dispersion material onto a carbon coated copper grid followed by drying at room temperature.

Electrochemical measurements

A Pt-electrode acquired from Gamry Instruments, USA, with geometrical area of 0.071 cm2 (3 mm in diameter) was used for sensor construction. Prior to use, Pt-electrode was polished with 0.1 μm, 0.3 μm and 0.5 μm of alumina/DI water slurries on a polishing cloth to obtain a mirror like finish. The polished electrode was then rinsed thoroughly with ethanol solution, acetone solution and DI water in ultrasonic bath. The CCM/CNS/NGS modified Pt-electrode was prepared by taking 1 mg ml−1 CCM/CNS/NGS and dispersing it in DI water. The dispersion was electrochemically coated onto a polished Pt-electrode via Cyclic Voltammetry (CV) by scanning within a potential window between −0.1 V to 1 V, with a scan rate of 10 mV s−1 for 10 cycles. Once the voltammogram was almost stable, the electrode was taken out and kept for drying. All voltammetric measurements were carried out in a three electrode cell using Gamry Reference 600 Potentiostat/Galvanostat/ZRA where a Pt-wire was taken as a counter, an Ag/AgCl electrode as a reference and the CCM/CNS/NGS modified Pt-electrode as a working electrode. An aqueous solution containing 0.1 M phosphate buffered saline (PBS) was used as an electrolyte solution. The IV curves were measured using a Keithley 6517B Electrometer/High resistance meter.

Results and discussion

NGS was investigated for its chemical properties by FTIR, elemental (C, H, N, and O) analysis, Raman spectroscopy, XPS and TGA. The minimal FTIR absorbance peak for NGS compared to CNS at 1008 and 1172 cm−1 for C–O indicated a loss of oxygen upon hydrothermal reduction (Fig. 1a). The disappearance of characteristic peaks for (O[double bond, length as m-dash]CO) vibrations at 1624, 1283 and 1227 cm−1 and for C[double bond, length as m-dash]O at 1703 cm−1 further confirmed the loss of oxygen containing functional groups on CNS reduction. Moreover, sharp peaks with increased intensities at 2925 cm−1 and 2853 cm−1 for asymmetric stretching vibrations of CH2 suggested the reduction of oxygen containing functional groups. A sharp increase in the peak intensity for C[double bond, length as m-dash]C stretching at 1600 cm−1 was observed possibly due to an enhanced π-conjugation after reduction of carbon nanosheets. An altered peak at 1069 cm−1 for C–C skeletal stretching vibrations was also observed for NGS after the hydrothermal reduction of CNS. A noticeable shift in the absorption band for a peak at 3410 cm−1 to 3436 cm−1 indicated a loss of the structural C–OH groups and appearance of –NH groups in NGS, which may be due to the readjustment of hydrogen bonding interactions in the molecular framework as observed by Ishii et al.38 or as a result of improper blue shift hydrogen bonding.39 However, as expected, the fingerprint at 1456 cm−1 for triazine appeared in both CNS and NGS, which suggested that the chemical framework of the material originating from melamine was maintained.
image file: c5ra05060j-f1.tif
Fig. 1 (a) FTIR spectra of CCM, CNS and NGS (b) Raman spectra of CCM, CNS, NGS-5 and NGS (at 514.5 nm excitation).

Raman spectroscopy is a powerful, non-destructive tool to distinguish ordered and disordered carbon materials. The peak positions are related not only to crystallines but also to the morphology of carbon nanostructures. The Raman spectra of pristine graphene is characterized by two main features, the G band responding to the first order scattering of the E2g mode of sp2 C atoms approximately at 1575 cm−1 and the D band at ∼1350 cm−1 arising from the breathing mode of κ-point phonons of A1g symmetry.40,41 For the Raman spectrum of CNS (Fig. 1b), the G-band broadens and shifts to 1590 cm−1 and the D-band at 1365 cm−1 becomes prominent, representing a decrease in the size of in-plane sp2 domains due to extensive oxidation.42 The ratio of intensity of D to G peak (ID/IG) of CNS is about 0.83. Compared with CNS, the ID/IG ratio (0.91) of NGS-5 was seen to increase due to the presence of unrepaired defects that remain after the partial removal of oxygen functionalities. In contrast to CNS, the ID/IG ratio of NGS was seen to decrease to 0.79 with an increase in reduction time. This decrease in ID/IG ratio for NGS even in the presence of nitrogen heteroatom was attributed to the defect healing effect along with restoration of sp2 network during hydrothermal reduction over increased time duration.

In addition, we further characterized NGS by powder XRD. XRD patterns of CCM, CNS, NGS-5 and NGS are recorded in Fig. 2. No diffraction peak was observed for CNS before the hydrothermal reduction indicating its amorphous nature. The as synthesized NGS-5 displayed a broad peak (002) at ∼22°. After being reduced for 10 h, the (002) peak shifted to 23° for NGS, indicating extensive reduction of CNS and exfoliation of the layered NGS.43,44 The formation of broad (002) peak of NGS suggests a layered growth of graphene nanosheets with an interlayer spacing of ∼0.35 nm. These results demonstrate that hydrothermal reduction of CNS leads to partial restoration of the graphitic crystal structure due to long time reduction.


image file: c5ra05060j-f2.tif
Fig. 2 X-ray diffraction patterns of CCM, CNS, NGS-5 and NGS.

XPS survey was performed to further investigate the chemical structure and bonding states of the material. The degree of CNS reduction is enlisted in SI 3 by CHN and O analysis. The atomic ratio of carbon and oxygen (C/O) were obtained by taking the ratio of C1s to O1s peak areas in the XPS spectra. The C/O increases from 6.2 to 10.7, when CNS is hydrothermally reduced to form NGS. Here, NGS showed loss of oxygen and nitrogen enrichment upon hydrothermal reduction of CNS (Fig. 3a). Additionally, the intensities of all the C1s peaks of carbon binding to oxygen decrease gradually and these accompany the increase in sp2 carbon. This indicates that the sp2 domains were partially restored at different levels and the graphitic degree of NGS samples was also improved accordingly due to the reduction effect and self-repairing of the graphene layers during the reduction process. A close up and detailed C1s peak analysis (Fig. 3b and c) further showed the disappearance of a characteristic O–C[double bond, length as m-dash]O peak (288.8 eV) on reduction. However, the sp2 C–NH2 peak (286.1 eV) remains unchanged indicating that the pendant triazine originating from the soft template melamine was maintained, unlike the reduced carbon material, CNScalcined obtained from calcination that undergoes deamination.18 The C1s spectra of CCM (Fig. 3d) displayed only four types of carbons, namely C–C, C[double bond, length as m-dash]C, C–O and O–C[double bond, length as m-dash]O as are also seen in C1s spectra of CNS.


image file: c5ra05060j-f3.tif
Fig. 3 (a) Survey XPS spectra of CNS and NGS, (b) C1s spectra of CNS, (c) C1s spectra of NGS, and (d) C1s spectra of CCM and (e) N1s spectra of CCM, CNS, NGS-5 and NGS.

In principle, there are at least three varieties of N-atoms in the carbon framework, depending on their location: graphitic (GN), pyridinic (PYN) and pyrrolic (PN). The location of nitrogen in the graphene framework was characterized by a N1s XPS analysis. The pyridinic nitrogen (labelled as PYN, at about 398.5 eV), refers to the nitrogen atom contributing to the π-system with one p-electron; the pyrrol region (labelled as PN, at about 400.1 eV), refers to the nitrogen atom contributing two p-electrons to the π-system. PN region is composed of the contribution of pyridone, lactam and pyrrol functional groups. The third region (labelled as GN, at about 401.2 eV) refers to graphitic nitrogen, where the nitrogen atom is incorporated in graphene layer and replaces a carbon atom. The PN functionalities decrease with increase in exposure time and GN components in the N1s spectra increases. We can presume that lactam has dehydrated to pyridine functionalities and further recompositions of rings leading to aromatization with the introduction of nitrogen in the graphitic structure which occurs under hydrothermal conditions and temperature lower than 200 °C. This is due to the sealed reactor which provided an increase in pressure (Fig. 3e).45 Scheme 2 summarizes the modification of nitrogen functionalities during hydrothermal treatment via surface rearrangement. This incorporation of nitrogen especially at the graphitic sites in graphene nanosheets have been established to play a pivotal role in enhancing the catalytic activity of carbon nanomaterials.46,47


image file: c5ra05060j-s2.tif
Scheme 2 Nitrogen insertion pathway in NGS.

Fig. 4a displays dispersion images of CCM, CNS and NGS in DI water. All four carbon materials look different because of their respective structural and physicochemical properties. The samples (200 μg ml−1) were sonicated in an ultrasonicator for 3 h. Most of the CCM particles precipitated after the CCM dispersion stood still for 8 h. In case of CNS, dispersion remained stable even after 1 week resulting in a greyish suspension. The melamine groups present between the layers of CNS tuned basic media reduction, producing NGS. This basic reaction condition promotes a decrease in the number of defects present in the resulting NGS and bigger graphitic domains as is also supported by Raman spectroscopy (Fig. 1b). The good dispersion capability of NGS is due to the increase in the number of hydrophilic sites48 along with bigger graphitic domains.


image file: c5ra05060j-f4.tif
Fig. 4 (a) Dispersion analysis of CCM (1), CNS (2), and NGS (3) in DI water and (b) TGA of CNS, NGS-5 and NGS under nitrogen atmosphere.

We further investigated the thermal stability of NGS using thermogravimetric analysis (TGA) under N2 atmosphere (flow rate = 50 ml min−1 and heating rate = 5 °C) (Fig. 4b). For the CNS curve, there is a mass loss (13 wt%) around 100 °C and a loss of about 18 wt% around 200 °C. This 13% weight loss is due to the removal of adsorbed water whereas, the 18 wt% reduction in mass from 200 °C onwards could be attributed to the loss of extra-framework water associated by H-bonding with functional groups. Furthermore, unlike CNS, NGS-5 and NGS displayed almost negligible mass loss until 200 °C. This minor mass-loss for both NGS-5 and NGS may be due to the absence of adsorbed water and extra-framework water. However, the major mass-loss observed for both NGS-5 (33 wt%) and NGS (18 wt%) was from 250 °C onwards. The as-observed mass loss of 26 wt% in case of NGS-5 from 250 °C to 550 °C could be attributed to the structural changes which occur in melamine at 250 °C and as the temperature approaches 350 °C, a sharp weight loss due to the pyrolysis of organic moieties.49 In case of NGS, a small mass loss of 18 wt% was observed, suggesting that NGS exhibits more thermal stability with the increase of reaction time due to the gradual removal of labile oxygen-containing functional groups. These results are also supported by the elemental analysis data given in SI 3, where C/O ratio was increased in NGS due to hydrothermal reduction of CNS. After 800 °C, NGS remained crystalline with a (002) peak at 23°.

The morphology of the as-synthesized NGS and CCM was examined by FESEM and TEM. The FESEM image of CCM (SI 2) revealed the presence of coke-like carbonaceous blocks devoid of thin sheets. However, FESEM image of NGS revealed thin, crumpled and folded flower like nanosheets (Fig. 5a), while TEM (Fig. 5b–d) displayed sheet like structure with folded areas and sharp edges confirming the formation of 2D NGS with high porosity. High resolution TEM (Fig. 5c) images taken at the edge further confirmed the porous nature of the sheets as evident by the presence of randomly orientated narrow micropores.50 The presence of noticeable lattice lines on the enlarged HRTEM (Fig. 5d) revealed that the embedded NGS sheets are crystalline. The Selected Area Electron Diffraction (SAED; inset Fig. 5d) pattern of the sample consists of diffraction spots attributed to graphene. The d-value measure from the spots is ∼3.35 Å, which represent layered structure growth of graphene like nanosheets along (002). The SAED pattern contains more than one spot at each diffraction point which could be due to back-folding of edges and overlapping of graphene layers (Fig. 5b).51 The diffraction spots as well as rings are found in the SAED pattern of the sample. In SAED, the well-defined diffraction spots and rings are fully indexed to typically hexagonal lattice of carbon in NGS, confirming the crystalline nature of NGS prepared by hydrothermal reduction of CNS. This result is in accordance with the XRD data (Fig. 2). Since the film consists of carbon and nitrogen, the diffraction spots can be attributed to multi-layered nitrogen doped graphene. The exfoliated sheet like structure of NGS was kept intact by the conservation of pendant triazine groups18 and N-enriched character of material. Most likely, the pendant functional groups act as spacers,18,52 which hinder the neighbouring π–π stacking of the adjoining NGS resulting in random orientation of the sheets that gave rise to the porous structure.25 Possibly, etch holes are formed post reduction because of the removal of oxygen containing functionalities in the basal plane of NGS53 which may result in hierarchical micro-, macro porous organization, thereby creating an ion channel for electron flow.47


image file: c5ra05060j-f5.tif
Fig. 5 Surface topography of NGS by FESEM (a), and TEM (b–d; SAED pattern of NGS as inset of Fig. 6d).

The ability of a material to transport charge carriers and the ability of these carriers to move easily from one layer to another determines the total conductivity of the material. To address this issue, IV measurements were carried out for CNS, NGS and CCM at 10 different points on the film for each sample (after making sure that the position of the tip is at the correct place on the basis of the morphology data), and three different samples for each carbon material were analysed and the data was found to be reproducible. A four-order increase in conductivity was observed when CNS was reduced to NGS, while CNS showed almost zero current response (Fig. 6a). The sharp increase in the conductivity of NGS is due to the textured grain formation towards (002) plane during the hydrothermal reduction. These results are in accordance with the fact that the conductivity depends on morphology, crystallinity and extrinsic factors such as dopants used.54 Crystallinity resulted in higher inter-chain conductivity, which indicates that electron can move easily from one chain to nearest neighbouring chains.55


image file: c5ra05060j-f6.tif
Fig. 6 (a) IV curves for CCM, CNS and NGS, (b) Pt–CNS, Pt–NGS-5, Pt–NGS in 70 μM DA (in 0.1 M PBS) and Pt–CNS (blank, in 0.1 M PBS) at 50 mV s−1, (c) LSV of Pt–NGS in different concentrations of DA (10, 20, 40, 60, 80, 90 and 100 μM) in 0.1 M PBS, (30 μl human urine sample was added) and (d) linear regression plot for varying DA concentrations.

With the successful synthesis of NGS, we were interested to examine the feasibility of the material as an electrochemical sensor. DA was selected as a suitable model analyte, since alteration in the levels of DA concentration has been linked to various pathological disorders.

The behaviour of Pt/NGS electrode was examined by recording the linear sweep voltammogram for DA (70 μM DA in 0.1 M PBS) and was compared to Pt/CNS electrode in 0.1 M PBS. An enhanced peak signal at a relatively lower potential (0.28 V vs. 0.47 V for CNS) clearly indicated the improved electrocatalytic phenomenon of NGS over CNS as well as NGS-5, (Fig. 6b) possibly due to the presence of large amounts of graphitic nitrogen and N-enrichment56 in NGS, as is also supported by the N1s spectra (Fig. 3e). The reduced sensitivity of NGS-5 as compared with that of CNS and NGS may be due to the presence of basal plane defects which result in slow heterogeneous transfer of electrons.57,58 The electrochemical response of Pt/NGS towards increasing concentrations of DA in the presence of human urine sample was also studied (Fig. 6c). DA current response increased linearly within a concentration range of 10–100 μM and the response is sensitive and rapid (within 2 seconds). The linearization equation for Fig. 6d was y = 2.011x + 11.963 (x: concentration per μM, y: current per μA) with a correlation coefficient of 0.9642. The coexisting substances of urine sample exhibited no interference and thereby making this proposed electrode material feasible for DA detection in real biological samples. Another major challenge in the electrochemical detection of DA is coexistence of UA, a biomolecule present in the extra cellular fluid of the central nervous system,57 which has oxidation potential close to that of DA.36,59 We, therefore, investigated the selectivity of NGS for DA detection by preparing a number of mixed solutions at different proportions of DA (0.1, 0.4, 4, 6 and 10 μM; pH 7.4) and UA (15 μM; 0.1 M PBS; pH 7.4). Two distinct anodic peaks at 0.21 V and 0.58 V, with an exceptional peak separation potential of 0.37 ± 0.05 V and (Fig. 7a1). Notably, the performance of our N-enriched NGS outperforms the other previously reported modified electrode materials for electrochemical detection of DA.59,60


image file: c5ra05060j-f7.tif
Fig. 7 LSV plots of (a1) Pt–NGS in different concentrations of DA (0.1, 0.4, 4, 6 and 10 μM) at a constant concentration of UA (15 μM) in 0.1 M PBS, (a2) linear regression plot for varying DA concentrations (fixed UA conc.), (b) Pt–NGS in different concentrations of UA (1, 5, 10, 15, 25 and 30 μM) at a constant concentration of DA (10 μM) in 0.1 M PBS, and (c) Pt–CCM, Pt–CNS, Pt–NGS and Pt–rGO in 15 μM DA–UA binary mixture.

Furthermore, in the presence of (interference) of UA (or DA), the peak current of DA (or UA) increases linearly with increasing concentrations (Fig. 7a1 & b). The linearization equation was y = 2.661x + 9.887 (x: concentration per μM, y: current per μA) with a correlation coefficient of 0.9880. These experiments suggest that DA and UA can be selectively detected with high degree of sensitivity (2.661 μA μM−1) for DA determination. The improved sensitivity was attributed to the porous structure of NGS50 and π–π interactions between the phenyl structure of DA and NGS,57,60–62 whereas; high selectivity of the material could possibly be due to the presence of surface charges and functional groups (–NH) of NGS.62 The amperometric response vs. DA concentration (Fig. 6d & 7a2) demonstrates that the detection can be made with a linear response from 10–100 μM, with an exceptional sensitivity and limit of detection of 100 nm for DA determination. Moreover, degradation in electrode response was not observed after repetitive Linear Sweep Voltammetry (LSV) scanning, indicating that the NGS modified Pt-electrode was immune to electrode fouling unlike the traditional bare electrodes, which exhibit oxidation potentials of DA and UA close to each other.62 Therefore, comparing the data shown in the previous literatures (Table 1), improved performance for the simultaneous determination DA and UA can be achieved using the NGS.

Table 1 Comparison of the analytical performance of the different modified electrodes for the simultaneous determination of DA and UA
Electrode materials Linear range (μM) Sensitivity (μA μM−1) Potential separation (mV) Ref.
DA DA DA–UA
Poly-ACBK 1–200 0.147 166 63
CG/GCE 1.0–24 0.375 90 64
MWCNT–FeNAZ/GCE 65–260 150 65
GO–PANI/GCE 2–14 1.3 190 66
PANI–GO/GCE 2–18 2.0 230 67
NGS 10–100 2.66 370 Our work


We further compared the electrochemical response of CCM, CNS, rGO and NGS to detect DA under identical experimental conditions (Fig. 7c). The XRD patterns for both CCM and CNS exhibit their amorphous nature, however CNS displayed a better layered and disordered morphology compared to CCM. Doping with heteroatom nitrogen results in increased disorderliness in CNS, increasing the ID/IG ratios (Fig. 1b). Futhermore, the layered sheet-like structure of CNS is due to the presence of melamine (confirmed by XPS, Fig. 3) in between the layers and facilitate the sheet formation.26 This may be the key factor for the enhanced sensitivity of CNS for DA as compared with CCM. However, for NGS, the peak signal was seen to shift to a relatively lower potential, displaying higher electrocatalytic properties. We envision that crystalline grain formation at 24° (002) along with self-repairing of defects during hydrothermal reduction is responsible for the enhanced electrocatalytic properties of NGS. A good balance between electrical conductivity and surface charges (due to the presence of nitrogen atoms) as well as layered structure are responsible for the significant enhancement of the electrochemical sensing performance of NGS over other carbonized materials.

The as-prepared Pt–NGS-5 and Pt–NGS electrode reproducibility (n = 8) were estimated by LSV under same conditions. The relative standard deviation (RSD) of the potential and current response for 40 μM DA detection for Pt–NGS was found to be 1.6% and 2.7% (SI 4), respectively; however Pt–NGS-5 displayed very poor reproducibility with a RSD% of 9.6% and 11.2% for potential and current response under same experimental conditions. The operational stability of Pt–NGS was also studied by continuous LSV scanning with time interval of 10 minutes in 0.1 M PBS solution containing 40 μM DA for 2 h. There was a very small current drop with a RSD of 2%, while maintaining 95% of the initial current response even after keeping it for one week at room temperature, indicating overtime electrode stability (data not shown). Taking these into account, the Pt–NGS modified electrode was found to be satisfactory for DA determination with good reproducibility and stability.

Conclusion

N-doped graphene nanosheets have been synthesized using a green, low temperature hydrothermal method with a better control over nucleation process. Numerous unique features make the material a promising candidate for potential applications in material science. NGS selectively detected DA in human urine sample as well as in the presence of UA with remarkable sensitivity and reproducibility compared to rGO, CNS, and CCM. To best of our knowledge, direct electrochemical determination of DA and UA with such a high sensitivity and large potential separation is rarely reported. Furthermore, superior electrochemical sensitivity and selectivity along with enhanced electrocatalytic properties of NGS for DA detection was metal/metal oxide free, which are usually employed for electrode modification to achieve higher current response. We envision that this synthetic route paves a new way for the preparation of NGS and the ability to rationally design a variety of NGS based sensing materials for biological applications.

Acknowledgements

This work was supported by Department of Science and Technology (DST), Government of India (SR/FT/CS-006/2010, SERB). We thank Dr John E. Moses, University of Nottingham and Prof. S. Natarajan of Solid State and Structural Chemistry Unit, Indian Institute of Science for helpful discussions.

References

  1. H. M. Jeong, J. W. Lee, W. H. Shin, Y. J. Choi, H. J. Shin, J. K. Kang and J. W. Choi, Nano Lett., 2011, 11, 2472 CrossRef CAS PubMed.
  2. K. Gong, F. Du, Z. Xia, M. Durstock and L. Dai, Science, 2009, 323, 760 CrossRef CAS PubMed.
  3. Y. Chen, B. Xie, Y. Ren, M. Yu, Y. Qu, T. Xie, Y. Zhang and Y. Wu, Nanoscale Res. Lett., 2014, 9, 646 CrossRef PubMed.
  4. R. Jia, J. Chen, J. Zhao, J. Zheng, C. Song, L. Li and Z. Zhu, J. Mater. Chem., 2010, 20, 10829 RSC.
  5. C. Wang, X. Wu, X. Li, W. Wang, L. Wang, M. Gu and Q. Li, J. Mater. Chem., 2012, 22, 15522 RSC.
  6. X. Yang, D. Wu, X. Chen and R. Fu, J. Phys. Chem. C, 2010, 114, 8581 CAS.
  7. M. Sevilla and A. B. Fuertes, Carbon, 2006, 44, 468 CrossRef CAS PubMed.
  8. Z. Wang, R. Jia, J. Zheng, J. Zhao, L. Li, J. Song and Z. Zhu, ACS Nano, 2011, 5, 1677 CrossRef CAS PubMed.
  9. K. S. Kim, Y. Zhao, H. Jang, S. Y. Lee, J. M. Kim, K. S. Kim, J. H. Ahn, P. Kim, J. Y. Choi and B. H. Hong, Nature, 2009, 457, 706 CrossRef CAS PubMed.
  10. Y. Sui, Nano Lett., 2009, 9, 2973 CrossRef CAS PubMed.
  11. Y. Wang, Z. Shi, Y. Huang, Y. Ma, C. Wang, M. Chen and Y. J. Chen, J. Phys. Chem. C, 2009, 113, 13103 CAS.
  12. F. Schedin, A. K. Geim, S. V. Morozov, E. W. Hill, P. Blake, M. I. Katsnelson and K. S. Novoselov, Nat. Mater., 2007, 6, 652 CrossRef CAS PubMed.
  13. M. Zhou, Y. Zhai and S. Dong, Anal. Chem., 2009, 81, 5603 CrossRef CAS PubMed.
  14. S. Gilije, S. Han, M. Wang, K. L. Wang and R. B. Kaner, Nano Lett., 2007, 7, 3394 CrossRef PubMed.
  15. B. X. Fan, W. Peng, Y. Li, X. Li, S. Wang, G. Zhang and F. Zhang, Adv. Mater., 2008, 20, 1 CrossRef PubMed.
  16. N. Liu, F. Luo, H. Wu, Y. Liu, C. Zhang and J. Chen, Adv. Funct. Mater., 2008, 18, 1518 CrossRef CAS PubMed.
  17. V. C. Tung, M. J. Allen, Y. Yang and R. B. Kaner, Nat. Nanotechnol., 2009, 4, 25 CrossRef CAS PubMed.
  18. M. A. Vadivel, T. Muraliganth and A. Manthiram, Chem. Mater., 2009, 21, 5004 CrossRef.
  19. G. Williams, B. Seger and P. V. Kamat, ACS Nano, 2008, 2, 1487 CrossRef CAS PubMed.
  20. H. L. Guo, X. F. Wang, Q. Y. Qian, F. B. Wang and X. H. Xia, ACS Nano, 2009, 9, 2653 CrossRef PubMed.
  21. M. Liu, Y. Yan, L. Zhang, X. Wang and C. Wang, J. Mater. Chem., 2012, 22, 11458 RSC.
  22. Q. Kuang, S. Y. Xie, Z. Y. Jiang, X. H. Zhang, Z. X. Xie, R. B. Huang and L. S. Zheng, Carbon, 2004, 42, 1737 CrossRef CAS PubMed.
  23. T. Y. Ma, Y. Tang, Y. Dai and S. Z. Qiao, Small, 2014, 10, 2382 CrossRef CAS PubMed.
  24. C. T. Nottbohm, A. Turchanin, A. Beyer, R. Stosch and A. Golzhauser, Small, 2011, 7, 874 CrossRef CAS PubMed.
  25. N. G. Shang, P. Papakonstantinou, M. McMullan, M. Chu, A. Stamboullis, A. Potenza, S. S. Dhesi and H. Marchetto, Adv. Funct. Mater., 2010, 18, 3506 CrossRef PubMed.
  26. W. Wang, S. Chakrabarti, Z. Chen, Z. Yan, M. O. Tade, J. Zou and Q. Li, J. Mater. Chem. A, 2014, 2, 2390 CAS.
  27. X. Li, W. Cai, J. An, S. Kim, J. Nah, D. Yang, R. Piner, A. Velamakanni, I. Jung, E. Tutuc, S. K. Banerjee, L. Colombo and R. S. Ruoff, Science, 2009, 324, 1312 CrossRef CAS PubMed.
  28. A. Reina, X. Jia, J. Ho, D. Nezich, H. Son, V. Bulovic, S. Mildred, S. Dresselhaus and J. Kong, Nano Lett., 2009, 9, 30 CrossRef CAS PubMed.
  29. S. Bae, H. Kim, Y. Lee, X. Xu, J. S. Park, Y. Zheng, J. Balakrishnan, T. Lei, H. R. Kim, B. Ozyilmaz, J. H. Ahn, B. H. Hong and S. Lijim, Nat. Nanotechnol., 2010, 5, 574 CrossRef CAS PubMed.
  30. W. S. O. Hummers and E. Richard, J. Am. Chem. Soc., 1958, 80, 1339 CrossRef CAS.
  31. B. C. Brodie, Philos. Trans. R. Soc. London, 1859, 149, 249 CrossRef.
  32. L. M. Veca, M. J. Meziani, W. Wang, X. Wang, F. Lu and P. Zhang, Adv. Mater., 2009, 21, 2088 CrossRef CAS PubMed.
  33. G. Yang, H. Han, T. Li and C. Du, Carbon, 2012, 50, 3753 CrossRef CAS PubMed.
  34. Z. H. Sheng, L. Shao, J. J. Chen, W. J. Bao, F. B. Wang and X. H. Xia, ACS Nano, 2011, 6, 4350 CrossRef PubMed.
  35. Z. Wang, M. Shoji and H. Ogata, Analyst, 2011, 136, 4903 RSC.
  36. D. Han, T. Han, C. Shan, A. Ivaska and L. Niu, Electroanalysis, 2010, 22, 2001 CrossRef CAS PubMed.
  37. A. Chakraborty, P. Patni, D. Suhag, G. Saini, A. Singh, S. Chakrabarti and M. Mukherjee, RSC Adv., 2015, 5, 23591 RSC.
  38. R. Ishii, H. Mori, K. Matsumura, N. Hongo, H. Kiyosue, S. Matsumoto, T. Yoshimi and S. J. Ujiie, J. Biomed. Sci. Eng., 2012, 5, 24 CrossRef CAS.
  39. T. Steiner, Angew. Chem., Int. Ed., 2002, 41, 48 CrossRef CAS.
  40. F. Tuinstra and J. L. Koenig, J. Chem. Phys., 1970, 53, 1126 CrossRef CAS PubMed.
  41. K. N. Kudin, B. Ozbas, H. C. Schniepp, R. K. Prud'homme, I. A. Aksay and R. Car, Nano Lett., 2007, 8, 36 CrossRef PubMed.
  42. A. C. Ferrari and J. Robertson, Phys. Rev. B: Condens. Matter Mater. Phys., 2000, 61, 14095 CrossRef CAS.
  43. J. Yan, Z. J. Fan, T. Wei, W. Z. Qian, M. Zhang and F. Wei, Carbon, 2010, 48, 3825 CrossRef CAS PubMed.
  44. H. M. A. Hassan, V. Abdelsayed, A. Khder, K. M. AbouZeid, J. Terner, M. S. El-Shall, S. I. Al-Resayes and A. A. El-Azhary, J. Mater. Chem., 2009, 19, 3832 RSC.
  45. L. Sun, L. Wang, C. Tian, T. Tan, Y. Xie, K. Shi, M. Li and H. Fu, RSC Adv., 2012, 2, 4498 RSC.
  46. Y. Gao, G. Hu, J. Zhong, Z. Shi, Y. Zhu, D. S. Su, J. Wang, X. Bao and D. Ma, Angew. Chem., Int. Ed., 2013, 52, 2109 CrossRef CAS PubMed.
  47. D. S. Su, J. Zhang, B. Frank, A. Thomas, X. Wang, J. Paraknowitsch and R. Schlogl, ChemSusChem, 2010, 3, 169 CrossRef CAS PubMed.
  48. D. Hulicova, M. Kodama and H. Hatori, Chem. Mater., 2006, 18, 2318 CrossRef CAS.
  49. Z. Derakhshesh, B. Keyvani and M. Khorasani, J. Org. Chem., 2010, 2, 89 Search PubMed.
  50. J. T. Zhang, Z. Y. Jin, W. C. Li, W. Dong and A. H. Lu, J. Mater. Chem. A, 2013, 1, 13139 CAS.
  51. A. W. Robertson and J. H. Warner, Nano Lett., 2011, 11, 1182 CrossRef CAS PubMed.
  52. Z. Ji, X. Shen, M. Li, H. Zhou, G. Zhu and K. Chen, Nanotechnology, 2013, 24, 115603 CrossRef PubMed.
  53. A. Ganguly, S. Sharma, P. Papakonstantinou and J. Hamilton, J. Phys. Chem. C, 2011, 115, 17009 CAS.
  54. D. H. Zhang, Polym. Test., 2007, 26, 9 CrossRef CAS PubMed.
  55. Y. Xia, J. M. Wiesinger, A. G. MacDiarmid and A. Epstein, J. Chem. Mater., 1995, 7, 443 CrossRef CAS.
  56. P. Serp and J. L. Figueiredo, Surface chemistry of carbon materials, in Carbon materials for catalysis, ed. T. J. Bandosz, Wiley, 2009 Search PubMed.
  57. M. S. Artiles, C. S. Rout and T. S. Fisher, Adv. Drug Delivery Rev., 2011, 63, 1352 CrossRef CAS PubMed.
  58. M. Pumera, A. Ambrosi and L. K. Chng, Chem. Sci., 2012, 3, 3347 RSC.
  59. J. Du, R. Yue, F. Ren, Z. Yao, F. Jiang, P. Yang and Y. Du, Gold Bull., 2013, 46, 137 CrossRef PubMed.
  60. X. Dong, X. Wang, L. Wang, H. Song, H. Zhang, W. Huang and P. Chen, ACS Appl. Mater. Interfaces, 2012, 4, 3129 CAS.
  61. G. Fabregat, E. C. Mateo, E. Armelin, O. Bertran and C. Aleman, J. Phys. Chem. C, 2011, 115, 14933 CAS.
  62. P. Si, H. Chen, P. Kannan and D. H. Kim, Analyst, 2011, 136, 5134 RSC.
  63. R. Zhang, G. D. Jin, D. Chen and X. Y. Hu, Sens. Actuators, B, 2009, 138, 174 CrossRef CAS PubMed.
  64. D. Han, T. Han, C. Shan, A. Ivaska and L. Niu, Electroanalysis, 2010, 22, 2001 CrossRef CAS PubMed.
  65. M. Noroozifar, M. K. Motlagh, R. Akbari and M. B. Parizi, Biosens. Bioelectron., 2011, 28, 56 CrossRef CAS PubMed.
  66. Y. Bao, J. Song, Y. Mao, D. Han, F. Yang, L. Niu and A. Ivaska, Electroanalysis, 2011, 23, 878 CrossRef CAS PubMed.
  67. P. Manivel, M. Dhakshnamoorthy, A. Balamurugan, N. Ponpandian, D. Mangalaraj and C. Viswanathan, RSC Adv., 2013, 3, 14428 RSC.

Footnote

Electronic supplementary information (ESI) available: Supporting information for the synthesis of GO, rGO, and CNS, CHN and O elemental analysis of CNS and NGS, and FESEM image of CCM. See DOI: 10.1039/c5ra05060j

This journal is © The Royal Society of Chemistry 2015