Effect of intrinsic and extrinsic factors on the stability of the α-gel phase of a glyceryl monostearate–water system

Fan C. Wang and Alejandro G. Marangoni*
Department of Food Science, University of Guelph, 50 Stone Road East, Guelph, ON N1G 2W1, Canada

Received 22nd March 2015 , Accepted 30th April 2015

First published on 1st May 2015


Abstract

Glyceryl monostearate–water systems (MG-gels) undergo a polymorphic transition from the α-gel phase to the coagel phase. This phase transition results in destabilization and loss of water in monoglyceride-structured systems, commonly found in personal care and food products. In this study, we examined the effect of intrinsic factors (type and concentration of co-emulsifiers) and extrinsic factors (cooling rate and applied shear) on the stability of the α-gel phase. The methods used to study the polymorphic transition were differential scanning calorimetry (DSC) and X-ray diffraction (XRD). The results suggested that the transition from the α-gel phase to the coagel phase caused a change in the gel's physical appearance. More specifically, opaque regions developed in the semi-translucent α-gel upon aging. The stability of the α-gel phase can be increased by using an α-tending co-emulsifier, such as sodium stearyol lactylate (SSL), and by increasing the concentration of the co-emulsifier. Slow cooling rates without shear could also increase the stability of the α-gel phase. In this work, we developed a subα Coagel Index that can be used together with the Coagel Index to characterize the degree of polymorphic transformation of MG-gels.

1. Introduction

Monoglycerides (MGs) are widely used emulsifiers in food and personal care products. The polymorphic and mesomorphic properties of MG crystals, MG–water systems, MG–oil systems, and MG-structured emulsions have been characterized to some extent.1–11 An MG–water mixture (MG-gel) forms a liquid crystalline lamellar phase when heated above its Krafft transition temperature.8,9 Upon cooling, the hydrocarbon chains on MG molecules lose mobility and crystallize into a hexagonally packed Lβ phase (α-gel).8,9 Freshly made MG-gels transfer from the α-gel phase to the sub-α-gel phase when the temperature is decreased from room temperature to below 13 °C.4,7 However, the α-gel phase is thermodynamically unstable and will irreversibly undergo a polymorphic phase transition to a triclinic packing of the Lβ′ phase (coagel phase) upon aging.7–9,12 The polymorphic transition from the α-gel phase to the coagel phase leads to a reduced water layer thickness between the MG bilayers.1,4,13–15 Recent studies demonstrated that the α-gel phase is stable for 100 days under refrigeration temperature, and the stability of the α-gel phase decreases as the storage temperature increases.7

The presence of co-emulsifiers is necessary to form the α-gel phase, because distilled MGs alone cannot gel water.16 Adding anionic co-emulsifiers will increase the water swelling capacity of MG-structured systems, because charged groups will bind water molecules strongly and induce electrostatic repulsion between MG bilayers.17–19 Soy lecithin, diacetyl tartaric acid ester of mono and diglycerides (DATEM), neutralized stearic acid and sodium stearoyl lactylate (SSL) have been used as effective co-emulsifiers in MG-based emulsions.3,4,6,12,13,17,19–23

Among the co-emulsifiers, monovalent salts promote water structuring in MG-gels.3 Two types of sodium salts, SSL and sodium stearate, will be used in this study. An SSL molecule has an 18-carbon chain attached to a lactic acid head group. SSL crystals are naturally stable in the α polymorphic form.17,18 Stearic acid can be neutralized with NaOH and function as a co-emulsifier in MG–water systems and MG-structured emulsions.4,20 DATEM are MG derivatives that have a hydrocarbon chain attached to a diacetyl tartaric acid head group, and DATEM are commonly used as dough strengtheners in baked goods.6,13,17,19,21 Phospholipids of soybean lecithin have negatively charged head groups that could enhance the water swelling capacity of the lamellar phase.22 Phosphatidic acid (PA) will also be used as another co-emulsifier in this study.

In addition to the use of co-emulsifiers, shear and cooling rates also affect the stability of the α-gel phase in MG-structured systems. Previous studies on the stability of MG-gels, MG-structured oleogels, MG-structured oil-in-water emulsions and water-in-oil emulsions all suggested that shear promotes the transition from the α-gel phase to the coagel phase.15,19,24–27 Applied shear during and after crystallization could reduce the water and oil binding capacity of MG-structured gels by changing the nano and micro structure of the gels.15,24,26 Cooling rate while setting is another factor affecting the stability of MG-structured systems.19,28 In MG–oil systems, MG molecules nucleate into both the α and β forms under slow cooling rates, while MG molecules only crystallize into the α phase under fast cooling rates.27 In MG-structured emulsions, larger emulsion droplets form under slow cooling rate due to greater flocculation and coalescence; small, uniform emulsion droplets form under fast cooling rates.26 The long term stability of the α-gel phase of MG–water systems with fast cooling rate, slow cooling rate, and cooling with applied shear will be tested in this work.

The polymorphic forms of MG-structured systems can be determined by their characteristic powder X-ray diffraction (XRD) spectrum and by differential scanning calorimetry (DSC) from their Coagel Index (CI).3,7,13,19,29 The α-gel phase of MG-gels structured by glyceryl monostearate (GMS) has a single diffraction peak at 4.15 Å, and the coagel phase has multiple diffraction peaks at 3.6–4.6 Å in the wide angle X-ray diffraction (WAXS) region. The α-gel phase and the coagel phase display the peak corresponds to the (001) plane at 53 Å and 49 Å respectively in the small angle X-ray diffraction (SAXS) region.3,8,9 The CI represents the degree of coagel formation, as determined by DSC.29 CI is calculated by applying two heating cycles to MG-gels above their Krafft transition temperature.29 The enthalpy of melting from the first heating cycle (ΔH1) represents the melting of both the α-gel and the coagel phases in aged MG-gels; the enthalpy of melting from the second heating cycle (ΔH2) represents the melting of only the freshly formed α-gel phase.29 The CI can then be calculated by taking the ratio ΔH1H2.29 When the CI is equal to 1.0, all the MG-gel is in the α-gel phase; when CI is equal to 2.0, all the MG-gel is in the coagel phase; when CI is between 1.0 and 2.0, MG-gels contain both the α-gel and the coagel phases.29

This work will examine how various intrinsic and extrinsic factors affect the stability of the α-gel phase of MG-gels. The MG-gel systems studied in this work contain 20% of total solids including GMS and co-emulsifiers. The intrinsic factors to study in this work are types and concentration of co-emulsifiers while the extrinsic factors to study are applied shear and cooling rate during the crystallization of MG-gels.

2. Experimental

2.1 Materials

Glyceryl monostearate, alphadim 90 SBK, Emplex Sodium Stearoyl Lactylate and Aic DATEM 100 were from Caravan Ingredients (Lenexa, KS, USA). The GMS sample contains 83.5% monostearin, 12.4% monopalmitin, and trace amount of diglycerides and triglycerides. Sodium stearate, minimum 99% purity, was purchased from Sigma-Aldrich Inc. (St. Louis, MO, USA). Phosphatidic acid used was 1-stearoyl-2-hydroxy-sn-glycero-3-phosphate (sodium salt) purchased form Avanti Polar Lipids Inc. (Alabaster, AL, USA).

2.2 Sample preparation

All of the MG-gels had 20% (w/w) GMS and co-emulsifiers in water. MG-gels were prepared by mixing GMS and co-emulsifier powders with water. The mixture was heated above the Krafft transition temperature of GMS (57 °C), and kept in a hot water bath until the powders were fully dissolved or melted. Formulations and cooling conditions of MG-gels are summarized in Table 1. The MG-gels that were prepared for studying the effects of types and concentration of co-emulsifiers were cooled on a bench top without shear. The MG-gels used to study the effects of cooling rate and shear were cooled in one of the following ways: in an ice-water mixture (approximate cooling rate was 10 °C min−1) without shear, in a 45 °C water bath and cooled together with the warm water (approximate cooling rate was 2 °C min−1) without shear, and cooled on a bench top with shear. The MG-gels cooled under shear were stirred 15 times clockwise and 15 times counter-clockwise with a glass stirring rod at one stir per second when the temperature dropped to 55 °C. Samples were prepared and analyzed in duplicates. All the samples were stored at 45 °C in capped glass vials for stimulated shelf life tests.
Table 1 Formulations and cooling conditions of MG-gel samples
Parameters Formulation of the solid phase Cooling condition Abbreviation
Types of co-emulsifier 19[thin space (1/6-em)]:[thin space (1/6-em)]1 (w/w) GMS[thin space (1/6-em)]:[thin space (1/6-em)]DATEM Bench top, no shear DATEM
19[thin space (1/6-em)]:[thin space (1/6-em)]1 (w/w) GMS[thin space (1/6-em)]:[thin space (1/6-em)]phosphatidic acid PA
19[thin space (1/6-em)]:[thin space (1/6-em)]1 (w/w) GMS[thin space (1/6-em)]:[thin space (1/6-em)]sodium stearate Sodium stearate
Concentration of co-emulsifier 19[thin space (1/6-em)]:[thin space (1/6-em)]1 (w/w) GMS[thin space (1/6-em)]:[thin space (1/6-em)]SSL Bench top, no shear 19M1S
9[thin space (1/6-em)]:[thin space (1/6-em)]1 (w/w) GMS[thin space (1/6-em)]:[thin space (1/6-em)]SSL 9M1S
8[thin space (1/6-em)]:[thin space (1/6-em)]2 (w/w) GMS[thin space (1/6-em)]:[thin space (1/6-em)]SSL 8M2S
Cooling condition 19[thin space (1/6-em)]:[thin space (1/6-em)]1 (w/w) GMS[thin space (1/6-em)]:[thin space (1/6-em)]SSL In ice-water mixture Fast
With 45 °C warm water Slow
Bench top, shear Shear


2.3 Powder X-ray diffraction (XRD)

A Rigaku Multiflex X-ray diffractometer (RigakuMSC Inc., The Woodlands, TX, USA) was used to determine the lamellar spacing and polymorphic forms of MG-gels. This XRD unit has a copper source (λ = 1.54 Å) set at 44 kV and 40 mA, and the divergence slit, receiving slit, and scattering slit were set at 0.3 mm, 0.5°, and 0.5°, respectively. Gel samples were placed onto a glass sample holder with an area of 20 × 20 mm and depth of 1 mm. Gel samples were scanned at 1° per minute in diffraction angles of 1° < 2θ < 35° at room temperature. The XRD results were analyzed with Jade 9 (Materials Data Inc., Livermore, CA, USA).

2.4 Differential scanning calorimetry (DSC)

The melting and crystallization profiles of MG-gels were measured with a Mettler Thermal Analysis DSC 1 (Mettler Toledo Canada, Mississauga, Canada). Gels were heated from 1 °C to 75 °C, held at 75 °C for 5 minutes, cooled to 1 °C, held for 5 minutes, and heated up to 75 °C again. The heating and cooling rate applied was 10 °C per minute. Peak integrations were performed with Stare Software equipped with the DSC unit to determine the enthalpy of melting obtained from the two heating cycles. The Coagel Indices of samples were calculated after peak integration.29

2.5 Microscopy

The morphology of MG-gels during the polymorphic transition was observed with bright filed transmitted light microscopy at room temperature. Samples were observed with a Leica DMRXA2 microscope (Leica Microsystems Canada Inc., Richmond Hill, Canada), and images were taken with a CCD camera (RETIGA 1300i, Burnaby, BC) controlled by Volocity 6.2.1 software (PerkinElmer, Woodbridge, ON, Canada).

3. Results and discussion

3.1 Physical appearance of the MG-gel and its polymorphic phase transition

The physical appearance of MG-gels was altered during storage when studying the stability of the α-gel phase. Freshly made MG-gels had an even semi-translucent appearance (Fig. 1a), but upon aging opaque regions formed and increased in size over time (Fig. 1b). The semi-translucent parts and the opaque parts of the MG-gels were imaged separately after stored at 45 °C for two weeks. The semi-translucent regions of MG-gels appeared to have many layers of water (Fig. 1c) while the opaque regions of the same gel appeared to be more porous (Fig. 1d). This observation suggests that the change of physical appearance of MG-gels upon aging could be caused by changes in the microstructure.
image file: c5ra05045f-f1.tif
Fig. 1 Photos of 19M1S MG-gel when (a) freshly made and (b) stored at 45 °C for two weeks, and transmitted light microscopy images of the (c) semi-translucent and (d) opaque regions in the gel.

The polymorphic forms and molecular packing of the semi-translucent MG-gel were then examined using DSC and XRD. Fig. 2a presents the melting profiles of MG-gels obtained from the two DSC heating cycles. The semi-translucent regions displayed two melting peaks at ∼13 °C and ∼60 °C, while the opaque regions displayed only one melting peak of bigger area at ∼60 °C. The melting peak at ∼13 °C represents the phase transition from the sub-α-gel phase to the α-gel phase and the melting peak at ∼60 °C represents the melting of the α-gel phase and the coagel phase.7 The CI of the semi-translucent region was close to 1.0, while that of the opaque regions was close to 2.0. The melting profiles of the semi-translucent region and the opaque region were the same in the second heating cycle, indicating a homogeneous distribution of matter in the gel. However the semi-translucent regions were in the α-gel phase, and the opaque beads of the MG-gel were in the coagel phase.


image file: c5ra05045f-f2.tif
Fig. 2 (a) DSC melting curves and XRD patterns of the (b) semi-translucent and (C) opaque regions in 19M1S gels.

The single XRD–WAXS peak at 4.15 Å obtained from the semi-translucent region of the gel indicated the sample was in the α-gel phase (Fig. 2b). The multiple WAXS peaks between 3.6 and 4.6 Å obtained from the opaque region suggested the presence of the coagel phase (Fig. 2c). The opaque part displayed SAXS peaks at 49 Å, 24.5 Å, 16.5 Å, 12.4 Å and 8.3 Å, representing the (001), (002), (003), (004) and (006) plane of the lamellar structure. The semi-translucent part of the gel displayed broad peaks at 49 Å, 24.5 Å, 12.4 Å, 8.3 Å, and a very low intensity peak at 16.5 Å. The broad peaks diffracted by the semi-translucent region represent swollen lamellar structures, while well-defined peaks diffracted by the opaque region represent crystalline lamellar structures.7,30 The DSC and XRD results together suggested that the semi-translucent region of the MG-gel was in the hydrated α-gel phase, and the opaque region was in the crystalline coagel phase.

The formation of the opaque clusters in MG-gels may be indicative of nucleation of the coagel phase. The loss of layered structures in the opaque regions as shown by microscopy images (Fig. 1c and d) may then be a consequence of the phase transition from the α-gel phase to the coagel phase, where the MG bilayers become more crystalline and less hydrated.

Experiments also showed that the opaque regions tend to be pearly when stored at 45 °C, and matte when stored at room temperature. The differences in the pearliness of the opaque regions could be due to the cluster size of the coagel structure. Previous studies on surfactant blends suggest that small particles (5–25 μm) tend to be matte, while large particles (20–200 μm) tend to be shiny and sparkly.31 Light microscopy images of MG-gels published previously showed that gel samples stored at 25 °C had ∼100 μm clusters, and samples stored at 45 °C had 300–400 μm clusters.7 MG-gels with a larger cluster size tend to appear pearly, in agreement with the theory that particle size could affect the optical properties of the coagel phase.

3.2 Intrinsic factors: types of co-emulsifiers

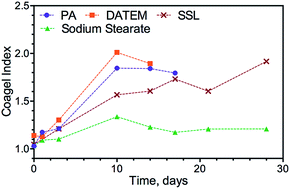
GMS formed the hydrated α-gel phase with SSL, DATEM, PA and sodium stearate at 19[thin space (1/6-em)]:[thin space (1/6-em)]1 (w/w) GMS: co-emulsifier ratio. Coagel Index trends are summarized in Fig. 3. The CIs of MG-gels using DATEM and PA both increased to 2.0 within two weeks. The CI of MG-gels using SSL increased gradually, and was still lower than 2.0 after four weeks. The CI of MG-gels using sodium stearate remained slightly higher than 1.0 after four weeks. Rapid increases in CI indicate a rapid polymorphic transition from the α-gel phase to the coagel phase. Therefore, MG-gels using DATEM and PA had a lower α-gel stability.
image file: c5ra05045f-f3.tif
Fig. 3 Coagel Indices of MG-gels using various co-emulsifiers. The ratio of GMS and co-emulsifies were all 19[thin space (1/6-em)]:[thin space (1/6-em)]1 (w/w).

Upon crystallization from the liquid crystalline lamellar phase to the α-gel phase, MG molecules self-assemble into a lamellar hydrate structure. Co-emulsifiers can increase water layer thickness by introducing electrostatic repulsions between MG bilayers.17,18 Even though DATEM and PA formed the α-gel structure with GMS, the α-gel had a low stability and transformed into the coagel phase rapidly. The lower α-gel stability in the DATEM and PA gels can be caused by differences in the co-emulsifiers' head groups. The size of the co-emulsifiers' head groups decrease in the order of DATEM > PA > SSL > sodium stearate. Interestingly, the increase in CI was correlated to the size of the head groups on the co-emulsifier molecules. MG-gels structured with the co-emulsifiers that have bigger head groups showed faster increases in CI. Aronhime et al. suggested that the ratio between the size of the hydrophilic head groups and the length of the hydrocarbon chains of an emulsifier affects its behavior of altering the polymorphic transition and crystallization of fatty acids.32 The co-emulsifiers used in this work all had single hydrocarbon chains consisting of 18 carbons, while the size of their head groups varied, contributing to differences in the stability of the α-gel phase. Larger head groups on the co-emulsifier molecules may disrupt the GMS lamellar structure and promote the polymorphic transition from the α-gel phase to the coagel phase.

3.3 Intrinsic factors: concentration of co-emulsifiers

The effect of the concentration of co-emulsifiers on the stability of the α-gel phase was studied using XRD and DSC. When freshly made, MG-gels with different levels of SSL (19M1S, 9M1S and 8M2S, defined in Table 1) displayed similar XRD patterns in the SAXS and WAXS regions (Fig. 4a–c). The 19M1S gels had a single peak in the WAXS region at 4.15 Å at day 0, and multiple peaks at 3.6–4.6 Å appeared after one week; while the 9M1S and 8M2S gels both displayed one peak at 4.15 Å after two months of storage. WAXS results suggest that the 19M1S gel started to transfer into the coagel phase after one week, while the 9M1S and 8M2S gels remained in the α-gel phase throughout the study.
image file: c5ra05045f-f4.tif
Fig. 4 XRD patterns of (a) 19[thin space (1/6-em)]:[thin space (1/6-em)]1 GMS[thin space (1/6-em)]:[thin space (1/6-em)]ssl, (b) 9[thin space (1/6-em)]:[thin space (1/6-em)]1 GMS[thin space (1/6-em)]:[thin space (1/6-em)]ssl, and (c) 8[thin space (1/6-em)]:[thin space (1/6-em)]2 GMS[thin space (1/6-em)]:[thin space (1/6-em)]ssl. Samples were stored at 45 °C.

All freshly made MG-gels displayed three broad peaks at approximately 54 Å, 26 Å and 16 Å, corresponding to the (001), (002) and (003) planes in the SAXS region, respectively. The 8M2S gel preserved the shape and positions of the peaks over two months (Fig. 4c). Even though the 9M1S gel showed a peak representing the α-gel phase in the WAXS region, the SAXS peak at 54 Å shifted to 49 Å, and the peaks at 12 Å and 8.3 Å (representing the (004) and the (006) planes) developed after two weeks. The diffraction peaks narrowed during the storage period, indicating that the gel transformed into a more ordered, or larger, crystalline lamellar structure. The 19M1S gel displayed similar changes in SAXS peak positions and shape of the peaks with the 9M1S gel, but changes were observed after three days rather than two weeks.

The melting behavior and the Coagel Indices of the MG-gels obtained by DSC were in agreement with XRD results. The 19M1S, 9M1S and 8M2S gels displayed similar melting peaks of both the sub α-gel phase and the α-gel phase at day 0 (Fig. 5).7 Stored for two weeks, the first melting peak (∼13 °C) disappeared in the 19M1S gels, and the area under the second melting peak (∼60 °C) increased. Changes in the melting curves indicated the loss of the sub α-gel phase and the formation of the coagel phase (Fig. 5a). The 9M1S gel preserved the first melting peak (the sub α-gel phase) for four weeks, and the area under the second melting peak also increased slower than the 19M1S gels upon aging (Fig. 5b). The first melting peak of the 8M2S gels turned into two bumps in the baseline after one week, but the area under the second melting peak did not increase dramatically upon aging (Fig. 5c). Fig. 5d shows changes in the CI of the MG-gel containing different SSL levels. The CI of the 19M1S gel increased rapidly to 1.6 in two weeks; the CI of the 9M1S gel increased gradually to 1.5 after two months; and the CI of the 8M2S gel stayed at around 1.1 over two months.


image file: c5ra05045f-f5.tif
Fig. 5 DSC melting profiles of (a) 19M1S (b) 9M1S and (c) 8M2S gels stored at 45 °C and (d) the calculated Coagel Indices of the MG-gels.

Results suggest that the CI increases faster at lower SSL incorporation levels. SSL is an α-tending co-emulsifier that promotes the nucleation of the MGs into the α phase.18 Increases in the proportion of SSL could also slow down the dehydration of the MG lamellar structures by binding water and increasing electrostatic repulsion between the MG bilayers. As a result, higher concentrations of SSL increase the stability of the α-gel phase in MG-structured gels and emulsions.

3.4 Extrinsic factors: shear and cooling rate

XRD patterns of the 19M1S gel set under slow cooling, fast cooling and cooling with shear conditions during a storage period were compared in Fig. 6. MG-gels set under the three cooling conditions displayed similar XRD patterns when freshly made, meaning the gels had the same structure even though three different crystallization processes were used (Fig. 6a). After one week of storage at 45 °C, gels cooled under shear completely transferred into the coagel phase (WAXS peaks at 3.6–4.6 Å); gels cooled rapidly displayed diffraction patterns of both the α-gel phase (WAXS peaks at 4.15 Å) and the coagel phase; gels that were cooled slowly showed only diffraction patterns of the α-gel phase after one week (Fig. 6b). After two weeks, gels cooled in an ice-water mixture showed only the diffraction patterns of the coagel phase while gels cooled with warm water (45 °C) still showed only the diffraction patterns of the α-gel phase (Fig. 6c). After three weeks, only gels cooled in hot water displayed peaks representing the α-gel phase, and peaks representing the coagel phase began to be detected.
image file: c5ra05045f-f6.tif
Fig. 6 XRD patterns of 19M1S gel stored at 45 °C for (a) 0 day, (b) 1 week, (c) 2 weeks, and (d) 3 weeks.

DSC melting curves of MG-gels set under the three cooling conditions are represented in Fig. 7. MG-gels cooled under shear had the fastest increase in the CI followed by gels cooled rapidly. The CI for the slow cooling MG-gels remained at around 1.0 after one month of storage at 45 °C. The DSC results suggest that slow cooling rates promote the formation of a stable α-gel phase. One possible explanation is that slow cooling rates could provide MG molecules more time to mix with co-emulsifiers and water to self-assemble into fully hydrated lamellar structures.28 Applying shear upon cooling promotes the nucleation of the coagel phase by disrupting the formation of the lamellar hydrate and enhances the release of water from the MG-bilayers.


image file: c5ra05045f-f7.tif
Fig. 7 DSC melting profiles of 19M1S using (a) slow and (b) fast cooling rates, (c) cooled with shear, and (d) the calculated Coagel Indices.

3.5 Coagel Indices determined from the α-gel phase and the sub-α-gel phase

The Coagel Index is a commonly used parameter to characterize the degree of polymorphic transition from the α-gel phase to the coagel phase. The CI can be calculated by taking the ratio of the enthalpy of the melting peak at ∼60 °C obtained from the first melting cycle (ΔH1) and the second melting cycle (ΔH2). ΔH1 represents the enthalpy of melting of both the α-gel phase and the coagel phase of an aged sample, and ΔH2 represents only the enthalpy of melting of the α-gel phase of a fresh sample.29 When heating MG-gels from starting at lower temperatures, e.g., 1 °C, another melting peak can be observed at ∼13 °C (Fig. 7a), which represents the reversible polymorphic transition from the sub-α-gel phase to the α-gel phase.7 Considering the melting peak at ∼13 °C, we propose the determination of the subα Coagel Index (CIsubα) to further characterize phase transition dynamics of MG-structured systems.

Similar with CI, CIsubα is defined as the ratio of enthalpy of the melting the sub-α-gel phase at ∼13 °C obtained from the first (ΔH1subα) and the second (ΔH2subα) melting cycle (Eqn (1)).

 
image file: c5ra05045f-t1.tif(1)

Summation of the CI and CIsubα terms yields CIsum, and the CIsum of some MG-gel samples are summarized in Table 2. Analysis of over 21 MG-gel samples showed CIsum was always ∼2.0. Statistical analysis demonstrated that the sum of CI and CIsubα was not significantly different from 2.0 (P > 0.72). The CIsubα of MG-gels with various compositions upon aging decreased from 1.0 to 0.0 while CI increased from 1.0 to 2.0 at the same time. CIsum is a constant value of 2.0 throughout the storage period may indicate that the energy required to melt the coagel phase is in balance with the energy required to melt the sub-α-gel phase and the α-gel phase.

Table 2 CI, CIsubα and CIsum of nine different MG-gel samples
Sample CI CIsubα CIsum
19M1S, 0 day 1.05 1.01 2.06
19M1S, 3 days 1.21 0.84 2.05
19M1S, 7 days 1.72 0.25 1.96
9M1S, 0 day 1.08 1.02 2.10
9M1S, 3 days 1.30 0.91 2.21
9M1S, 7 days 1.68 0.26 1.94
19M1S, fast cooling 0 day 1.09 0.98 2.07
19M1S, fast cooling 2 weeks 1.44 0.54 1.98
19M1S, fast cooling 1 month 1.90 0.00 1.90
19M1PA, 0 day 1.03 1.00 2.03
19M1PA, 1 week 1.21 0.86 2.07
19M1PA, 2 weeks 1.95 0.00 1.95


4. Conclusions

In this work, we examined the effect of intrinsic factors (types and concentration of co-emulsifiers) and extrinsic factors (shear and cooling rate) on the stability of GMS-structured water systems. Results suggested that GMS was able to form a lamellar crystal hydrate α-gel phase with SSL, phosphatidic acid, DATEM and sodium stearate as co-surfactants. The stability of the α-gel phase varies depending on the type of co-emulsifiers and co-emulsifiers with smaller head groups leads to higher stability of the α-gel phase. Increasing the concentration of α-tending co-emulsifier (SSL) in turn increases the stability of the α-gel phase. The α-gel phase tends to have higher stability if set under slow cooling rates without shear.

During the study of the stability of the α-gel phase, this work also correlated changes in physical appearance of MG-gels to changes in their polymorphic forms and lamellar packing structure. Freshly made MG-gels had an even, semi-translucent appearance while opaque regions developed upon aging. XRD and DSC results suggested that the opaque regions were in the coagel phase while the translucent regions were in the α-gel phase.

Additionally, the CIsubα was proposed as a new means to quantify the complete dynamic of the polymorphic transition in MG–water systems. CI subα decreased from 1.0 to 0.0 when the MG-gel transferred from the α-gel phase to the coagel phase. The sum of CI and CI subα was constant at 2.0 for MG-gels of various formulations throughout the storage period.

This work expands our understanding of the dynamics of polymorphic and mesomorphic transformations in MG-gels and provides clear strategies to stabilize the α-gel phase of MG-structured aqueous systems.

References

  1. N. Krog and K. Larsson, Phase Behaviour and Rheological Properties of Aqueous Systems of Industrial Distilled Monoglycerides, Chem. Phys. Lipids, 1968, 2, 129–143 CrossRef CAS.
  2. K. Larsson and N. Krog, Structural Properties of the Lipid—water Gel Phase, Chem. Phys. Lipids, 1973, 10, 177–180 CrossRef CAS.
  3. N. Krog and A. P. Borup, Swelling Behaviour of Lamellar Phases of Saturated Monoglycerides in Aqueous Systems, J. Sci. Fd Argic, 1973, 24, 691–701 CrossRef CAS PubMed.
  4. A. Zetzl, M. Ollivon and A. Marangoni, A Coupled Differential Scanning Calorimetry and X-Ray Study of the Mesomorphic Phases of Monostearin and Stearic Acid in Water, Cryst. Growth Des., 2009, 9, 3928–3933 CAS.
  5. E. S. Lutton, Phase Behavior of Aqueous Systems of Monoglycerides, J. Am. Oil Chem. Soc., 1965, 42, 1068–1070 CrossRef CAS.
  6. M. B. Munk, A. G. Marangoni, H. K. Ludvigsen, V. Norn, J. C. Knudsen, J. Risbo, R. Ipsen and M. L. Andersen, Stability of Whippable Oil-in-Water Emulsions: Effect of Monoglycerides on Crystallization of Palm Kernel Oil, Food Res. Int., 2013, 54, 1738–1745 CrossRef CAS PubMed.
  7. F. C. Wang and A. Marangoni, Nature and Dynamics of Monostearin Phase Transitions in Water: Stability and the Sub-A-Gel Phase, RSC Adv., 2014, 4, 50417–50425 RSC.
  8. E. S. Lutton, Review of the Polymorphism of : Saturated Chains of Unequal Length, J AOCS, 1950, 27, 276–281 CAS.
  9. E. S. Lutton, The Phases of Saturated 1-Monoglycerides C14-C22, J. AOCS, 1971, 48, 778–781 CAS.
  10. H. D. Batte, A. J. Wright, J. W. Rush, S. H. J. Idziak and A. G. Marangoni, Phase Behavior, Stability, and Mesomorphism of Monostearin–oil–water Gels, Food Biophys., 2007, 2, 29–37 CrossRef.
  11. W. G. Morley and G. J. T. Tiddy, Phase Behaviour of Monoglyceride/water Systems, J. Chem. Soc. Faraday Trans., 1993, 89, 2823–2831 RSC.
  12. J. Vereecken, W. Meeussen, A. Lesaffer and K. Dewettinck, Effect of Water and Monoglyceride Concentration on the Behaviour of Monoglyceride Containing Fat Systems, Food Res. Int., 2010, 43, 872–881 CrossRef CAS PubMed.
  13. A. Sein, J. a. Verheij and W. G. M. Agterof, Rheological Characterization, Crystallization, and Gelation Behavior of Monoglyceride Gels, J. Colloid Interface Sci., 2002, 249, 412–422 CrossRef CAS PubMed.
  14. K. Larsson, K. Gabrielsson and B. Lundberga, Phase Behaviour of Some Aqueous Systems Involving Monoglycerides, Cholesterol and Bile Acids, J. Sci. Fd Agric, 1978, 909–914 CrossRef CAS PubMed.
  15. A. Goldstein, A. Marangoni and K. Seetharaman, Monoglyceride Stabilized Oil in Water Emulsions: An Investigation of Structuring and Shear History on Phase Behaviour, Food Biophys., 2012, 7, 227–235 CrossRef.
  16. G. Y. Brokaw, W. C. Lyman and D. P. Industries, The Behavior of Distilled Monoglycerides in the Presence of Water, J. AOCS, 1958, 35, 5–8 Search PubMed.
  17. C. E. Stauffer and E. A. S. Amphiphiles, Emulsifiers for the Food Industry in Bailey’s Industrial Oil and Fat Products, ed. F. Shahidi, John Wiley & Sons, Hoboken, NJ, 2005, pp. 229–267 Search PubMed.
  18. N. J. Krog, Food Emulsifiers and Their Chemical and Physical Properties, in Food Emulsions, F. Emulsions, Marcel Dekker, New York, 1997 Search PubMed.
  19. I. Heertje, E. Roijers and H. A. C. Hendrickx, Liquid Crystalline Phases in the Structuring of Food Products, LWT -Food Sci. Technol., 1998, 31, 387–396 CrossRef CAS.
  20. M. Cornec and G. Narsimhan, Adsorption and Exchange of ??-Lactoglobulin onto Spread Monoglyceride Monolayers at the Air-Water Interface, Langmuir, 2000, 16, 1216–1225 CrossRef CAS.
  21. J. P. M. Van Duynhoven, I. Broekmann, A. Sein, G. M. P. van Kempen, G.-J. W. Goudappel and W. S. Veeman, Microstructural Investigation of Monoglyceride-Water Coagel Systems by NMR and CryoSEM, J. Colloid Interface Sci., 2005, 285, 703–710 CrossRef CAS PubMed.
  22. L. Rydhag and I. Wilton, The Function of Phospholipids of Soybean Lecithin in Emulsions, J. Am. Oil Chem. Soc., 1981, 58, 830–837 CrossRef CAS.
  23. M. E. Leser, L. Sagalowicz, M. Michel and H. J. Watzke, Self-Assembly of Polar Food Lipids, Adv. Colloid Interface Sci., 2006, 123–126, 125–136 CrossRef CAS PubMed.
  24. S. Da Pieve, S. Calligaris, E. Co, M. C. Nicoli and A. G. Marangoni, Shear Nanostructuring of Monoglyceride Organogels, Food Biophys., 2010, 5, 211–217 CrossRef.
  25. M. Shiota, a. Iwasawa, M. Kotera, M. Konno, T. Isogai and L. Tanaka, Effect of Fatty Acid Composition of Monoglycerides and Shear on the Polymorph Behavior in Water-in-Palm Oil-Based Blend, J. Am. Oil Chem. Soc., 2011, 88, 1103–1111 CrossRef CAS PubMed.
  26. H. D. Batte, A. J. Wright, J. W. Rush, S. H. J. Idziak and A. G. Marangoni, Effect of Processing Conditions on the Structure of Monostearin–oil–water Gels, Food Res. Int., 2007, 40, 982–988 CrossRef CAS PubMed.
  27. N. K. Ojijo, I. Neeman, S. Eger and E. Shimoni, Effects of Monoglyceride Content, Cooling Rate and Shear on the Rheological Properties of Olive Oil/monoglyceride Gel Networks, J. Sci. Food Agric., 2004, 84, 1585–1593 CrossRef CAS PubMed.
  28. J. F. Toro-vazquez, E. Dibildox-alvarado and V. Herrera-coronado, Triacylglyceride Crystallization in Vegetable Oils: Application of Models, Measurements, and Limitations, in Crystallization and Solidification Properties of lipids, ed. N. Widlak, R. Hartel and S. Narie, AOCS Press, Champaign, Illinoiss, 2001, pp. 53–78 Search PubMed.
  29. G. Cassin, C. de Costa, J. P. M. van Duynhoven and W. G. M. Agterof, Investigation of the Gel to Coagel Phase Transition in Monoglyceride-Water Systems, Langmuir, 1998, 14, 5757–5763 CrossRef CAS.
  30. F. Peyronel and R. Campos, Methods Used in the Study of the Physical Properties of Fats, in Structure-Function Analysis of Edible Fats, ed. A. G. Marangoni, AOCS Press, Urbana, 2012, pp. 235–294 Search PubMed.
  31. R. L. Crombie, Cold Pearl Surfactant-Based Blends, Int. J. Cosmet. Sci., 1997, 19, 205–214 CrossRef CAS PubMed.
  32. J. Aronhime, S. Sarig and N. Garti, Emulsifiers as Additives in Fats - Effect on Polymorphic Transformations and Crystal Properties of Fatty Acids and Triglycerides, Food Structure, 1990, 9, 337–352 CAS.

This journal is © The Royal Society of Chemistry 2015
Click here to see how this site uses Cookies. View our privacy policy here.