Structure–inhibition relationship of phenylethanoid glycosides on angiotensin-converting enzyme using ultra-performance liquid chromatography-tandem quadrupole mass spectrometry

Pengfei Li a, Meng Qia, Haijun Hua, Qing Liuab, Qiming Yanga, Dandan Wanga, Fujiang Guoa, S. W. Annie Blighc, Zhengtao Wang*ab and Li Yang*ab
aMOE Key Laboratory for Standardization of Chinese Medicines and SATCM Key Laboratory for New Resources and Quality Evaluation of Chinese Medicines, Institute of Chinese Materia Medica, Shanghai University of Traditional Chinese Medicine, Shanghai 201210, China. E-mail: ztwang@shutcm.edu.cn; yangli7951@hotmail.com; Fax: +86-21-51322519; Tel: +86-21-51322507
bShanghai R&D Centre for Standardization of Chinese Medicines, Shanghai 201203, China
cDepartment of Life Sciences, Faculty of Science and Technology, University of Westminster, London W1W 6UW, UK

Received 21st March 2015 , Accepted 18th May 2015

First published on 18th May 2015


Abstract

Angiotensin-converting enzyme (ACE) plays a critical role in the rennin–angiotensin system. Recently, natural products isolated from herbal medicines have demonstrated an inhibitory effect against ACE, suggesting their potential value in the regulation of blood pressure. In the present study, the ACE inhibition (ACEI) provided by 21 phenylethanoid glycosides and related phenolic compounds was investigated by measuring the production of hippuric acid (HA) using a rapid, sensitive, accurate and specific ultra-performance liquid chromatography-tandem quadrupole mass spectrometry (UPLC-MS/MS) method. The test compounds showed a wide spectrum of inhibitory potency on ACE at 50 mM, ranging from 5.29 to 95.01%, and compounds with ACEI greater than 50% were selected for IC50 determination, a measure of the effectiveness of a substance in inhibiting a specific biological function. The IC50 values ranged from 0.53 ± 0.04 to 15.035 ± 0.036 mM. The structure–inhibition relationships were then explored and showed that cinnamoyl groups played an essential role in the ACEI of phenylethanoid glycosides. Furthermore, the substructure of increasing ACEI in phenylethanoid glycosides involved a greater number of hydroxyl groups and less steric hindrance, allowing chelation by the active Zn2+ site of the ACE. Our results confirmed that phenylethanoid glycosides offer a widely available source of anti-hypertensive natural products. In addition, the information provided by the study of structure–inhibition relationships will assist in the further design of structurally modified phenylethanoid glycosides as anti-hypertensive drugs.

1. Introduction

Hypertension is a common chronic disease and is recognized as a public health problem throughout the world. It can lead to heart, brain or kidney failure, together with other complications. Statistics in 2000 suggested that more than 25% of the world's adult population (about one billion) suffered from hypertension, and that the proportion would increase to 29% (1.56 billion) by 2025.1 Due to poor diagnosis and control, the prevention and treatment of hypertension has become a global issue.

The rennin–angiotensin system (RAS) plays a crucial role in the regulation of blood pressure and electrolyte homeostasis.2,3 Angiotensin-converting enzyme (ACE; peptidyl dipeptide hydrolase, EC 3.4.15.1), a dipeptidyl carboxypeptidase widely distributed in the body, is a key factor in the conversion of inactive deca-peptide angiotensin I (Ang I) to the potent vasoconstrictor octa-peptide angiotensin II (Ang II).4 ACE inhibition (ACEI) is therefore a standard therapeutic approach for treating hypertension. Synthetic ACE inhibitors, such as captopril, benazepril and fosinopril, have become widely used in the clinical treatment of hypertension, congestive heart failure and hypertension-related organ damage.5–7 Their activity is mainly attributed to the binding of polyphenols to Zn2+ at the active center of ACE.8,9 However, undesirable side-effects, such as skin rashes, cough, renal impairment, and angioneurotic edema, have inhibited the use of available synthetic ACE inhibitors,10,11 and the development of new ACE inhibitors from natural products, giving fewer side-effects, has become a global issue.

Phenylethanoid glycosides are a type of natural glycoside commonly connected with substituted phenethyl and cinnamoyl groups. Recent reports on medicinal plants containing phenylethanoid glycosides list significant therapeutic effects on hypertension, due mainly to their ACE inhibitory activity.12,13

The ACE activity of a product in vitro is usually evaluated by monitoring its effect on the catalytic transformation of a substrate. The substrate hippuryl histidyl leucine (HHL) can be converted to hippuric acid (HA) by the action of an ACE. The measurement of HA production can thus be used to determine the activity of the ACE. A number of techniques, including UV spectrophotometry, fluorospectrophotometry, CE, HPLC and UPLC-MS, have been used to quantify the HA produced, but all have shortcomings in terms of their efficiency, accuracy or selectivity.14–18 On the other hand, UPLC-tandem quadrupole mass spectrometry (UPLC-MS/MS) not only retains the rapidity and sensitivity of UPLC-MS but also gives much better specificity. In the present study a validated UPLC-MS/MS method is described for the ACEI screening of 21 phenylethanoid glycosides and related phenolic compounds. The IC50 values and the structure–inhibition relationships of the test compounds were investigated.

2. Materials and methods

2.1 Chemicals and reagents

ACE (from rabbit lung, EC 3.4.15.1), HHL, Tris-base and caffeic acid were purchased from Sigma Chemicals (St Louis, USA). Hippuric acid (HA) was obtained from Sinopharm Chemical Reagent Co Ltd (Shanghai, China). Cinnamic acid, 3- and 4-hydroxycinnamic acid, 3-methoxy and 3,4-dimethoxycinnamic acid, and hydroxytyrosol were supplied by J&K Scientific Ltd. (Shanghai, China). Echinacoside, forsythoside A and B, angoroside C, and calceolarioside B were purchased from Meryer Chemical Technology Co. Ltd. (Shanghai, China). Aceteoside, isoacteoside, plantanmajoside, leucosceptoside A, clerodenoside A, isomartynoside, monoacetyl martyonside, martyonside, and cistanoside F were isolated in our laboratory in greater than 95% purity from the roots of Clerodendrum bungei and characterised by NMR and MS (dried, HPLC-UV). HPLC-grade acetic acid was obtained from Tedia Inc. (Fairfield, USA), and HPLC-grade acetonitrile from Fisher Co. (Geel, Belgium). Water was purified using a Milli-Q Academic System (Millipore, Billerica, USA).

2.2 Sample preparation

75 mM of Tris-buffer solution containing 200 mM of NaCl (pH 8.3) were freshly prepared. ACE was dissolved in the Tris-buffer to provide a working solution of 0.05 U mL−1 and stored at −80 °C before use. The substrate HHL was also dissolved in the Tris-buffer to obtain a 2.91 mM solution. Test compounds were dissolved at a series of concentrations in 0.5% dimethyl sulfoxide (DMSO).

2.3 Incubation procedure

20 μL of enzyme solution and 10 μL of test compound solution were initially pre-incubated for 5 min at 37 °C, then 35 μL of Tris-buffer and 10 of μL HHL substrate solution were added and incubated for 50 min at 37 °C. The reaction was terminated immediately by the addition of 100 μL of acetonitrile (0 °C). The mixture was centrifuged (20[thin space (1/6-em)]000 rpm, 15 min, 4 °C) and the supernatant liquor retained for analysis.

2.4 UPLC-MS/MS analysis

Separation was achieved on a Waters Acquity UPLC system (Waters Corp., Milford, USA) using an Acquity UPLC BEH C18 column (1.7 μm, 2.1 × 50 mm) maintained at 45 °C. The mobile phase consisted of 0.5% acetic acid in water (A), and acetonitrile (B) at a flow rate of 0.4 mL min−1. Gradient elution was as follows: 0–0.4 min, 5% B; 0.4–1.2 min, linear from 5 to 35% B; 1.2–2.5 min, linear from 35 to 90% B; 2.5–4 min, held at 90% B for 1.5 min; and 4–5 min, 5% B for equilibration of the column. The volume injected was 2 μL under a partial loop in needle overfill mode.

A Micromass Quattro Premier XE tandem quadruple mass spectrometer (Waters Corp., Manchester, UK) with an electrospray ionization (ESI) source was used for quantification. The precursor-product ion transition for HA (m/z 177.9 → 76.7) and HHL (m/z 428.3 → 175.9) were applied using multiple reaction monitoring (MRM) in negative ionization mode (Fig. 1). The mass spectrometer parameters were set as follows: capillary voltage, 3.50 kV; extractor voltage, 2 kV; source temperature, 120 °C; desolvation temperature, 350 °C; desolvation gas flow, 800 L h−1; cone gas flow, 50 L h−1. Nitrogen (99.9% purity) was used as cone gas and argon (99.999% purity) as collision gas. The inter-channel delay and the inter-scan delay were 0.005 s and 0.05 s, respectively. Instrumental control and data acquisition were conducted using Masslynx 4.1 software.


image file: c5ra05027h-f1.tif
Fig. 1 Chemical structure and ion mass spectra of (A) HA and (B) HHL.

2.5 Measurement of ACEI in vitro

The ACEI was calculated following the production of HA using eqn (1):
 
image file: c5ra05027h-t1.tif(1)
where C0 and C are the HA concentration without and with the test compound, respectively. The ACEI of the test compounds was measured at a concentration of 50 mM. Those with ACEI above 50% were selected for IC50 investigation, and the IC50 value of each selected compound was recorded in triplicate, expressed as mean ± SD using SPSS 16.0 software (SPSS Corp., USA). Statistical analysis were performed by one-way ANOVA with Scheffe's post-hoc test. Differences between groups were regarded as significant when P < 0.05.

3. Results and discussion

3.1 Optimization of reaction conditions

We have improved the reaction system based on the method of Geng F18 with respect to incubation and pre-incubation time, concentration of chloride ion, and the dissolving agent for the test compounds, as shown in Fig. 2. A range of incubation times, 5, 10, 20, 30, 40, 50, 60, 90, and 120 min, were investigated. More stable production of HA was displayed after 50 min incubation, and this was chosen as the optimal time (Fig. 2(A)). Since pre-incubation can affect the combination of the enzyme and the test compounds, ACE pre-incubated with captopril (positive control, 20 nM) and acteoside solution (25 mM) for 0, 5, 10, 15, 30, and 60 min were tested. The results indicated that after pre-incubation for 5 min the calculated inhibition for captopril and acteoside had each clearly increased, but with no significant difference between 5, 10, 15, 30, and 60 min (Fig. 2(B)).
image file: c5ra05027h-f2.tif
Fig. 2 Optimization of reaction conditions, (A) incubation time, (B) pre-incubation time, (C) concentration of NaCl, and (D, E) solution agent of test compounds.

A previous study indicated that the activity of ACE was highly dependent on chloride ion catalysis.19 The production of HA in Tris-buffer with different concentrations of added NaCl (0, 100, 200, 300, and 400 mM) was tested. ACE showed the highest activity in the system with Tris-buffer containing 200 mM of NaCl (Fig. 2(C)). In addition, due to the insolubility of some of the test compounds in water, the use of methanol, acetonitrile, 0.5% DMSO, DMSO, dimethyl formamide, tetrahydrofuran and pyridine as solvents was investigated. Methanol and 0.5% DMSO showed little inhibition of ACE activity. We further compared the ACEI of captopril (20 nM) and acteoside (25 mM) dissolved in water, methanol and 0.5% DMSO, respectively. The results confirmed that these three solvents had no significant influence on ACE activity (Fig. 2(D) and (E)). Finally, as shown in Section 2, the optimal reaction conditions were well chosen.

3.2 Validation of the assay method

A number of methods have been reported for quantifying HA for ACE activity. Using the spectrophotometry method, HA is first extracted with ethyl acetate before analysis. This is complicated and time-consuming, and considerable interference is introduced due to the fact that unhydrolyzed HHL is also extracted. The HPLC method was therefore established to provide acceptable detection, but with limited sensitivity. Meanwhile, the liquid conditions were affected by various inhibitors during quantification. A rapid, sensitive and selective UPLC-MS technique was thus introduced for evaluation of ACE activity, but the response of HA was still affected by caffeic acid due to its similar retention time and molecular weight, suggesting that the selectivity of the selected ion monitoring (SIM) scan of UPLC-MS was not adequate for our experimental purposes (ESI Fig. S1 and Table S1). An improved UPLC-MS/MS method with higher specific MRM scan was therefore established to avoid interference in HA detection. The UPLC-MS/MS chromatographs are shown in Fig. 3.
image file: c5ra05027h-f3.tif
Fig. 3 UPLC-MS/MS chromatograms of HA and HHL in the ACE reaction system: (A) total ionization chromatogram of the reaction solution; (B) MRM chromatogram of HHL; (C) MRM chromatogram of HA.

The calibration displayed linear behavior over the HA concentration range 0.056 to 28.07 μM (y = 125.97x + 3.74, r2 = 0.9998). The limit of detection (S/N = 3) of HA was 0.017 μM and the limit of quantification (S/N = 10) suitable for quantitative detection was 0.056 μM. Low, medium, and high concentrations (0.056, 1.143, 28.07 μM, respectively) of HA were added to the incubation system without ACE to generate three quality control (QC) samples. The accuracy of the method was confirmed by recovery of the QC samples at the three concentration levels. The average accuracy of HA at three concentration levels were 96.43%, 101.8%, 99.68%, with RSDs of 0.935%, 1.176%, 1.264%, respectively, as shown in Table 1. The intra- and inter-day precision was respectively measured by repeating the analysis of each QC sample five times during each day over three consecutive days. Stability was evaluated by the occasional analysis of each QC sample held at room temperature for 24 h and 4 °C for 72 h. The results in Table 1 showed that the RSDs of intra-day precisions at three concentration levels were 4.342%, 3.993% and 1.030%, and inter-day precisions were 7.343%, 7.921% and 1.834%. The RSDs of stability at the three concentration levels were 7.350%, 5.148%, 2.269% at room temperature, and 8.433%, 4.753%, 6.043% at 4 °C.

Table 1 Accuracy, precision and stability for HA quantification in UPLC-MS/MS analysis
C samples Added conc. (mM) Measured conc. (mM) Mean accuracy (%) Precision RSD (%) Stability RSD (%)
  RSD (n = 5) Intra-day (n = 5) Inter-day (n = 15) Room temp. (n = 6) 4 °C (n = 6)
Low 0.056 0.054 96.43 0.953 4.342 7.343 7.350 8.433
Medium 1.143 1.123 101.8 1.176 3.993 7.921 5.148 4.753
High 28.07 27.98 99.68 1.264 1.030 1.834 2.269 6.043


In addition, the UPLC-MS/MS method developed was compared with the UPLC-MS method according to the IC50 values of captopril as positive control and a number of representative compounds (ESI Table S2). Good correlation was found between the two methods (R = 0.9970) and showed no significant difference (p = 0.6127) based on Pearson correlation analysis and the two-tailed unpaired Student's t-tests, respectively. These results demonstrated that the improved assay method was well established and could fully meet the requirements of ACEI screening.

3.3 ACEI screening and IC50 measurement

A total of 21 phenylethanoid glycosides and related phenolic compounds were screened for ACEI activity in vitro (Table 2).
Table 2 Chemical structures of the compounds used in this studyg
Structure R1 R2 R3 R4 R5 R6 R7 Compound
a Methoxyl.b Rhamnose.c Glucose.d Arabinose.e Apiose.f Acetyl.g *–indicates compounds used for IC50 measurement.
image file: c5ra05027h-u1.tif H H           Cinnamic acid
OH H           3-Hydroxy cinnamic acid*
OH OH           Caffeic acid*
H OH           4-Hydroxy cinnamic acid*
OMeta H           3-Methoxy cinnamic acid
OMet OMet           3,4-Dimethoxy cinnamic acid
image file: c5ra05027h-u2.tif OH OH   Rhab       Cistanoside F*
image file: c5ra05027h-u3.tif     OH         Hydroxytyrosol*
image file: c5ra05027h-u4.tif OH   OH Rha H     Acteoside*
OMet   OH Rha H     Leucosceptoside A*
OMet   OMet Rha H     Martynoside*
OH   OH Gluc H     Plantamajoside*
OMet   OMet Rha Arad     Angoroside C
OH   OH H Rha     Forsythoside A*
OH   OH Rha Apie     Forsythoside B*
OH   OH Rha Glu     Echinacoside*
image file: c5ra05027h-u5.tif OMet   OMet     Acf Ac Clerodenoside A
OMet   OMet     Ac H Monoacetyl martynoside*
image file: c5ra05027h-u6.tif OH   OH Rha       Isoacteoside*
OMet   OMet Rha       Isomartynoside*
OH   OH H       Calceolarioside B*


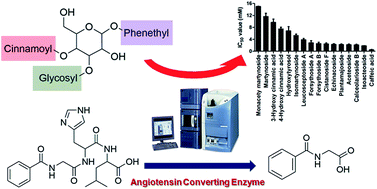
These compounds exhibited a range of potency on ACE, with inhibition ranging from 5.29 to 95.01% at 50 mM. Compounds exhibiting ACE inhibitory potency greater than 50% followed the sequence, caffeic acid, isoacteoside, calceolarioside B, acteoside, plantamajoside, echinacoside, cistanoside F, martynoside, forsythoside B, forsythoside A, leycosceptoside A, monacety marynoside, isomartynoside, hydroxytyrosol, 4-hydroxycinnamic acid and 3-hydroxycinnamic acid, which were carried out for further IC50 investigations. The remainder of the test compounds: angoroside C, cinnamic acid, 3,4-dimethoxycinnamic acid, clerodenoside A and 3-methoxycinnamic acid, had ACEI below 50% (Fig. 4). The IC50 values were measured from 0.53 ± 0.10 to 15.04 ± 0.04 mM, as shown in Table 3. Captopril (100 nM) was used as a positive control in ACEI screening, and its IC50 value was 2.11 ± 0.57 nM, which was in line with literature results.


image file: c5ra05027h-f4.tif
Fig. 4 Effect of the test compounds on ACE inhibitory activity at 50 mM.
Table 3 IC50 values of compounds on ACE inhibitory activities. Values followed with the same letter are not significantly different at the 5% level by Scheffe's test.
Compound IC50 values (mM)
Monacety martynoside 15.04 ± 0.04a
Martynoside 11.66 ± 1.07b
3-Hydroxy cinnamic acid 9.70 ± 1.08bc
4-Hydroxy cinnamic acid 7.53 ± 0.51cd
Hydroxytyrosol 6.87 ± 1.39d
Isomartynoside 5.31 ± 0.43de
Leucosceptoside A 3.86 ± 0.40ef
Forsythoside A 2.85 ± 0.71efg
Forsythoside B 2.61 ± 0.40fg
Cistanoside F 2.46 ± 0.35fg
Echinacoside 2.33 ± 0.20fg
Plantamajoside 2.28 ± 0.19fg
Acteoside 2.22 ± 0.21fg
Calceolarioside B 2.15 ± 0.20fg
Isoacteoside 1.85 ± 0.02fg
Caffeic acid 0.53 ± 0.10g


3.4 The possible active group of phenylethanoid glycosides

Phenylethanoid glycosides contain glycosyl, phenethyl and cinnamoyl groups substituted with hydroxyl, methoxy, or acetyl. A recent report also suggests that phenylethanoid glycosides act as prodrugs, are degraded to phenolic products and undergo metabolism in vivo.20 We therefore evaluated the ACEI of structurally related phenolic compounds, in addition to phenylethanoid glycosides with different glycosyl groups, in order to establish the possible active groups of phenylethanoid glycosides binding to ACE in vitro. Caffeoyl-containing acteoside, cistanoside F and caffeic acid showed similar ACEI, with IC50 values of 2.22 ± 0.21, 2.46 ± 0.35 and 0.53 ± 0.10 mM, respectively. Furthermore, a further phenolic group of acteoside, hydroxytyrosol, displayed ACEI with IC50 6.87 ± 1.39 mM, which is weaker than caffeic acid. On the other hand, in order to observe the influence of different glycosyl groups of phenylethanoid glycosides on ACEI, acteoside, plantamajoside, forsythoside A, forsythoside B, echinacoside, isoacteoside and calceolarioside B were included in the measurements but showed no significant difference in IC50 values. These results indicated that phenolic groups played a more important role than glycosyl groups in the inhibition of ACE. In addition, cinnamoyl groups might be more significant than phenethyl in ACEI, due to the fact that cinnamoyl has a larger conjugate system, which helps to maintain the planar structure of phenylethanoid glycosides.21

3.5 The significance of hydroxyl groups in phenylethanoid glycosides

Previous studies have suggested that the presence of hydroxyl groups might be important in the inhibition of zinc metalloproteinases.22,23 In the present study the methylation of hydroxyl groups significantly reduced the ACEI potency of phenylethanoid glycosides. When acteoside was transformed to leucosceptoside A by methylation of one hydroxyl group a 73.70% increase in the IC50 value was observed. Similarly, methylation of two hydroxyl groups in acteoside and isoacteoside produced a 5.24 and 2.89 times increase in IC50, respectively. A similar reduction of activity occurred in cinnamic acid derivatives when hydroxyl groups were methylated. Moreover, when the activity of martynoside, monoacetyl martynoside and clerodenoside A was compared, the acetylation of hydroxyls on glycosyl was seen to produce a considerable reduction in ACEI activity. As mentioned earlier, the number of hydroxyl groups seems to be closely related to the ACEI capacity of phenylethanoid glycosides.

3.6 The importance of the esterification position of cinnamoyl and glycosyl in phenylethanoid glycosides

In the ACEI measurement of the test compounds the data showed that isomartynoside, which has cinnamoyl groups present in the C-6 position of the central glycosyl, was significantly more effective than martynoside, linked in the C-4 position, indicating that the esterification of cinnamoyls and glycosyls in the C-4 position might produce steric hindrance in binding to ACE. However, isoacteoside and acteoside did not exhibit a similar reduction, which could be related to the absence of substitution on hydroxyl groupings, affecting the significance of esterification at the C-4 position.

4. Conclusions

An improved UPLC-MS/MS method has been established for measuring the ACEI potency of phenylethanoid glycosides by quantifying the production of HA from HHL. This method is suitable for the high throughput screening of potential ACE inhibitors isolated from herbal medicines, and has the obvious advantages of speed of analysis (2.5 min), favorable sensitivity (LOD 0.017 and LOQ 0.056 μM for HA), high selectivity (MRM mode) and excellent reliability (validated accuracy, precision and stability). Using this method, the in vitro ACEI of 21 phenylethanoid glycosides and related phenolic compounds were tested and structure–inhibition relationships were investigated. In the present study phenolic groups, particularly the cinnamoyl groups of the phenylethanoid glycoside, played an important role in the inhibition of ACE, and the presence of more hydroxyl groups and less structural steric hindrance had a strong influence in increasing ACEI. This result suggested that phenylethanoid glycosides exert their ACE inhibition by chelating hydroxyl groups with Zn2+. This study provides a valuable methodology for the screening of potential ACE inhibitors, and has demonstrated that hydroxylation of phenylethanoids can improve the potential of these compounds as antihypertensive drugs.

Acknowledgements

This study was supported by the National S&T Major Special Project (2012ZX09103201-045), the National Natural Science Foundation of China (81222053 and 81403070), the Program for New Century Excellent Talents in University (NCET-12-1056), the Shu–Guang Scholar Project of the Shanghai Municipal Education Commission (11SG41), the Program for S&T Achievements Transformation and Industrialization Project (12401900403), and the China Postdoctoral Science Foundation (2014M551438).

References

  1. P. M. Kearney, M. Whelton, K. Reynolds, P. Muntner, P. K. Whelton and J. He, Lancet, 2005, 365, 217–223 CrossRef.
  2. C. Guang, R. D. Phillips, B. Jiang and F. Milani, Arch Cardiovasc Dis., 2012, 105, 373–385 CrossRef PubMed.
  3. V. K. Jimsheena and L. R. Gowda, Peptides, 2010, 31, 1165–1176 CrossRef CAS PubMed.
  4. L. T. Skeggs Jr, W. H. Marsh, J. R. Kahn and N. P. Shumway, J. Exp. Med., 1954, 99, 275–282 CrossRef CAS.
  5. M. A. Ismail, M. Nabil Aboul-Enein, K. A. Abouzid, D. A. Abou El Ella and N. S. Ismail, Bioorg. Med. Chem., 2009, 17, 3739–3746 CrossRef CAS PubMed.
  6. L. Lin, S. Lv and B. Li, Food Chem., 2012, 131, 225–230 CrossRef CAS PubMed.
  7. R. Natesh, S. L. Schwager, E. D. Sturrock and K. R. Acharya, Nature, 2003, 421, 551–554 CrossRef CAS PubMed.
  8. T. A. Williams, P. Corvol and F. Soubrier, J. Biol. Chem., 1994, 269, 29430–29434 CAS.
  9. R. Natesh, S. L. Schwager, H. R. Evans, E. D. Sturrock and K. R. Acharya, Biochemistry, 2004, 43, 8718–8724 CrossRef CAS PubMed.
  10. C. L. Jao, S. L. Huang and K. C. Hsu, Biomedicine, 2012, 2, 130–136 CrossRef PubMed.
  11. I. Wijesekara and S. K. Kim, Mar. Drugs, 2010, 8, 1080–1093 CrossRef CAS PubMed.
  12. D. G. Kang, Y. S. Lee, H. J. Kim, Y. M. Lee and H. S. Lee, J. Ethnopharmacol., 2003, 89, 151–154 CrossRef CAS.
  13. F. Geng, L. Yang, G. X. Chou and Z. Wang, Phytother. Res., 2010, 24, 1088–1094 CAS.
  14. B. Holmquist, P. Bünning and J. F. Riordan, Anal. Biochem., 1979, 95, 540–548 CrossRef CAS.
  15. J. Wu, R. E. Aluko and A. D. Muir, J. Chromatogr. A, 2002, 950, 125–130 CrossRef CAS.
  16. T. Watanabe, T. K. Mazumder, S. Nagai, K. Tsuji and S. Terabe, Anal. Sci., 2003, 19, 159–161 CrossRef CAS.
  17. X. Xiao, X. Luo, B. Chen and S. Yao, J. Chromatogr. B: Biomed. Sci. Appl., 2006, 834, 48–54 CrossRef CAS PubMed.
  18. F. Geng, Y. Q. He, L. Yang and Z. Wang, Biomed. Chromatogr., 2010, 24, 312–317 CAS.
  19. C. Zhang, S. Wu and D. Xu, J. Phys. Chem. B, 2013, 117, 6635–6645 CrossRef CAS PubMed.
  20. M. Qi, A. Xiong, P. Li, Q. Yang, L. Yang and Z. Wang, J. Chromatogr. B: Biomed. Sci. Appl., 2013, 940, 77–85 CrossRef CAS PubMed.
  21. L. Guerrero, J. Castillo, M. Quiñones, S. Garcia-Vallvé, L. Arola, G. Pujadas and B. Muguerza, PLoS One, 2012, 7, e49493 CAS.
  22. J. Parellada, G. Suárez and M. Guinea, J. Enzyme Inhib., 1998, 13, 347–359 CrossRef CAS.
  23. M. R. Loizzo, A. Said, R. Tundis, K. Rashed, G. A. Statti, A. Hufner and F. Menichini, Phytother. Res., 2007, 21, 32–36 CrossRef CAS PubMed.

Footnotes

Electronic supplementary information (ESI) available. See DOI: 10.1039/c5ra05027h
These author contributed equally to this study.

This journal is © The Royal Society of Chemistry 2015
Click here to see how this site uses Cookies. View our privacy policy here.