Influence of earth-abundant bimetallic (Fe–Ni) nanoparticle-embedded CNFs as a low-cost counter electrode material for dye-sensitized solar cells

K. Saranyaa, A. Subramania*a and N. Sivasankarb
aElectrochemical Energy Research Lab, Centre for Nanoscience and Technology, Pondicherry University, Puducherry-605 014, India. E-mail: a.subramania@gmail.com; Fax: +91413 2655348; Tel: +91413 2654980
bDepartment of Metallurgical Engineering & Materials Science, Indian Institute of Technology-Bombay, Mumbai, India-400076

Received 20th March 2015 , Accepted 28th April 2015

First published on 28th April 2015


Abstract

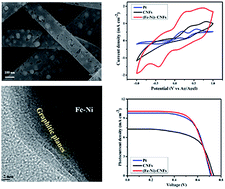
Earth-abundant bimetallic (Fe–Ni) nanoparticle-embedded carbon nanofibers (CNFs) have been prepared by electrospinning technique and used as counter electrode (CE) material for dye-sensitized solar cells (DSSC). The structural and morphological properties were explored by X-ray diffraction (XRD), Raman spectroscopy, field-emission scanning microscope (FE-SEM) and transmission electron microscope (TEM) studies. The results of cyclic voltammetry (CV), electrochemical impedance and Tafel polarization studies revealed that (Fe–Ni)-CNFs demonstrated superior electrocatalytic activity, electrochemical stability, low charge transfer resistance (Rct) and high exchange current density for the reduction of triiodide (I3). Furthermore, it was observed that DSSC fabricated using (Fe–Ni)-CNFs as counter electrode had achieved power conversion efficiency (PCE) that is almost comparable to the same fabricated using std. Pt. This is due to the prepared CNFs' large surface area and randomly oriented, interconnected porous morphology with graphitized structure, which enhanced the contact with a large quantity of ionic liquid electrolyte, leading to a faster redox kinetics of I3/I. This study revealed that (Fe–Ni)-CNFs could be used as a low-cost and efficient counter electrode material for DSSCs.

Introduction

Solar energy and photovoltaic devices have received more attention in meeting the increased energy demand due to the depletion of fossil fuels. Dye-sensitized solar cells (DSSC), which belong to the third generation of solar cells, have been considered an effective alternate to the conventional p–n junction solar cells. It has the advantages of simple fabrication procedure, good plasticity and environmental friendliness. The first DSSC was reported in 1991 at Ecole Polytechnique Federale Lausanne (EPFL) by Gratzel et al.1 Normally, DSSC comprises a monolayer of dye-adsorbed, wide band gap, n-type TiO2 semiconductor on transparent conductive oxide substrate (TCO) as photoanode, I/I3 redox couple in an organic solvent as electrolyte, and Pt as counter electrode.2 To date, the maximum efficiency achieved is 13%.3 Hence, further steps have been taken to increase the efficiency of DSSC by improving the performance of its components. Among the components of DSSC, CE plays a main role in completing the electrical circuit and also in the regeneration of iodide from triiodide through a reduction process. Pt is employed as a counter electrode due to its high electrocatalytic activity and conductivity. However, it has some drawbacks, such as cost, rarity, low surface area and instability with the redox couple, which limits longtime operation due to the formation of PtI4.4 By developing cost-effective, earth-abundant CE materials, the energy conversion cost will be reduced to $0.4 per WP.5 Therefore, several research efforts are in progress to develop alternative low-cost materials with high conductivity, good electrocatalytic activity and electrochemical stability; this could help the commercialization of DSSCs.

Various carbon materials, conducting polymers, sulfides, nitrides, carbides and also their composites have been reported as CE materials in place of Pt.6–11 Especially, carbonaceous materials such as carbon black, graphite, graphene, carbon nanotubes and carbon nanofibers are considered good alternative CEs to replace Pt, as they possess high conductivity and electrochemical stability against I3/I.12,13 Among them, one-dimensional CNFs have received broad interest as electrode materials in electrochemical energy devices including supercapacitors, hydrogen storage and batteries due to their large specific surface area, good conductivity, tensile strength and various packing arrangements of the graphene sheets (i.e. tubular, herringbone and lamellar structure).14 Primarily, CNFs are prepared from polyacrylonitrile (PAN) by electrospinning technique, followed by a stabilization and carbonization process.15,16 The preparation method is another essential feature in the development of electrocatalysts as well as electrodes, along with the chemical and electrochemical nature of the materials. In addition, electrospun one-dimensional nanofibers and composite nanofibers have recently been widely used for several applications such as photovoltaics, photocatalysis and energy storage devices.17–20 Qiao et al. reported CNFs as counter electrode for DSSCs, which have lower photovoltaic performance when compared to platinum due to their poor electrocatalytic activity.21 This can be improved significantly by enhancing the active surface area by making highly porous CNFs and CNF-based composites, which is beneficial to the one-dimensional conducting pathway for I/I3 ions. Furthermore, the synergistic effect of the CNF-based composite enhanced the electrical conductivity and increased the catalytic active sites for I3 reduction, which results in low charge transfer resistance.13 Recently, a few CNF-based composites, such as CNF–TiO2,22 Ni–CNT–CNFs,23 TiC–CNFs–Pt,24 and Pd–Co-doped CNFs,25 as well as Ni–Cu-incorporated CNFs26 have been prepared by electrospinning technique and used as CEs for DSSCs. However, it was observed that the achieved PCE of CNF-based CEs is ∼4% lower than std. Pt. Therefore, further research is being done to enhance the photovoltaic performance of CNF-based composites. Bimetallic nanoparticles (NPs) of first-row transition metals have composition-dependent optical, magnetic, and catalytic properties compared to single-metal nanoparticles.27 Iron and nickel are the most abundant elements on earth. Furthermore, the catalysts in which Fe is alloyed with a second metal possess remarkably enhanced electrocatalytic activity due to the possible variation of geometric and electronic properties of the active sites. Bimetallic (Fe–Ni) is utilized as an electrocatalyst for various applications.28,29 However, to date there has been no report on the use of bimetallic (Fe–Ni) nanoparticle-embedded CNFs as CE for DSSCs.

In the present investigation, bimetallic (Fe–Ni) nanoparticle-embedded CNFs have been prepared by a simple electrospinning technique, and their electrochemical and photovoltaic performance are investigated in detail for use as a newer and low-cost CE in DSSCs.

Experimental

Preparation of (Fe–Ni)-embedded CNFs

Polyacrylonitrile was dissolved in N,N-dimethylformamide to prepare a 10 wt% solution. To this, 0.188 g of Ni acetate and 0.271 g of Fe nitrate were added, and the solution was stirred for about 12 h. This solution was filled into a 15 ml plastic syringe equipped with a 27 gauge needle. The electrospinning was carried out at a high voltage of 25 kV using a high-voltage DC power supply. The flow rate and distance between spinneret and collector were maintained as 0.5 ml h−1 and 15 cm, respectively. The electrospun mat was first stabilized at the temperature of 250 °C for 2 h in air, followed by carbonization at 1200 °C with a heating rate of 2 °C for 2 h in nitrogen atmosphere to obtain (Fe–Ni) nanoparticle-embedded CNFs. The same procedure was adopted to prepare pure CNFs without the addition of metal precursors.

Physical and electrochemical characterization

The phase purity of CNFs and (Fe–Ni)-embedded CNFs was confirmed by X-ray diffraction studies (Rigaku, Model: Ultima IV). The graphitic nature and microstructure of carbonaceous materials were determined using confocal micro-Raman spectrometer with a laser beam of 514 nm (Renishaw, Model: RM 2000). The surface morphology of bimetallic (Fe–Ni)-embedded CNFs was analyzed by FE-SEM (JSM, JEOL 7600F). The presence of Fe and Ni embedded onto the CNFs was observed by energy dispersive X-ray analysis (EDX) and energy dispersive spectroscopy (EDS) equipped with FE-SEM. The inclusion of (Fe–Ni) and graphitic phase in CNFs and crystallinity were identified by TEM and SAED studies (Philips, Model: CM 200). The surface area of CNFs and (Fe–Ni)-embedded CNFs was evaluated using a surface area analyzer (Smart Instruments, Model: Smart Sorb 92/93). The cyclic voltammetry study was carried out in an electrochemical workstation (VSP, Bio-Logic, France) using a three-electrode cell configuration to explore the electrocatalytic activity of CEs towards the reduction of I3 ion in the redox electrolyte. This three-electrode cell consists of the prepared CE material with an active area of 0.25 cm2 as working electrode, Pt with an active area of 1 cm2 as counter electrode and Ag/AgCl as the reference electrode. 0.01 M LiI, 0.001 M I2 and 0.1 M LiClO4 in acetonitrile were used as the electrolyte in the potential range of −1.0 to 1.0 V at different scan rates. The electrochemical impedance measurement was performed for std. Pt, CNFs and (Fe–Ni)-embedded CNF electrodes by fabricating symmetric cells. The Surlyn tape was sandwiched between two symmetrical electrodes as the spacer to determine the charge transfer resistance in the frequency range of 100 kHz to 1 mHz. Tafel polarization measurements were done at a scan rate of 50 mV s−1 to verify the electrocatalytic activity of the CE using the same symmetrical cells.

Fabrication of DSSCs

The ITO glass plates were washed with acetone, ethanol and deionized water in an ultrasonic water bath, and then the plates were dried in air. The ITO glass plates were chosen for their low surface roughness and higher transmittance compared to FTO glass plates.30 A Scotch tape was used as a spacer to control the film thickness. The TiO2 paste (Dyesol Ltd.) was coated on the conducting glass substrate between the Scotch tape by doctor blade technique, and it was sintered at 450 °C for 30 min. The thickness and area of the photoanode films were found to be about 12 μm and 0.20 cm2, respectively. The sintered photoanode was dipped into a solution containing 3 × 10⁻⁴ M of the dye, di-tetrabutyl ammonium cis-bis(isothiocyanato) bis(2,2′-bipyridyl-4,4′-dicarboxylato)ruthenium(II), for 24 h. After dye adsorption, dye-sensitized TiO2 photoanodes were washed with anhydrous ethanol to remove excess dye and left to dry in air.31 The different counter electrodes were prepared by mixing 35 wt% of each prepared CE material (CNFs and (Fe–Ni)-embedded CNFs) mixed with 15 wt% of ethyl cellulose (binder). Subsequently, they were dispersed in 50 wt% of terpineol and then stirred by intermittent sonication. This paste was coated on the pre-cleaned ITO plate by doctor blade technique, with the thickness of 15 μm, and then dried for 30 min. at 300 °C.

The DSSCs were assembled using TiO2 photoanode with various counter electrodes, such as std. Pt paste (Dyesol Ltd.), CNFs and (Fe–Ni)-embedded CNFs, individually, by a hot press at 110 °C. The I/I3 redox mediator, which contains 0.5 M of LiI, 0.05 M of I2, 0.5 M of TBP and 0.5 M of 1-butyl-3-methylimidazolium iodide (ionic liquid) in acetonitrile, was injected into the cells via two small holes drilled on the CE side. Finally, the holes were sealed with the aid of small squares of Surlyn tape.32

The photovoltaic performance of the assembled DSSCs was characterized using a calibrated AM 1.5 solar simulator (Newport, Oriel instruments USA 150W, model: 67005) with a light intensity of 100 mW cm−2 and a computer-controlled digital source meter (Keithley, Model: 2420). The PCE (η) of the assembled cells was calculated from the measured photovoltaic parameters such as fill factor (FF), open-circuit voltage (Voc), short-circuit current density (Jsc) and incident optical power (Pin). We fabricated three DSSCs for each system; their photovoltaic performance values were measured, and average values were taken.

Results and discussion

XRD studies

Phase purities of the prepared CNFs and (Fe–Ni)-embedded CNFs were confirmed by XRD patterns and are shown in Fig. 1. The characteristic peak at 25.4° is indexed as the graphitic structure of CNFs. Furthermore, the diffraction peaks at 43.5° (111), 50.3° (200) and 75.4° (220) are attributed to the characteristic reflections of the face-centered cubic (fcc) (Fe–Ni) alloy nanoparticles (JCPDS 47-1417).33 No individual Fe or Ni nanoparticles were formed during carbonization.
image file: c5ra04963f-f1.tif
Fig. 1 XRD patterns of CNFs and (Fe–Ni)-embedded CNFs carbonized at 1200 °C for 2 h in N2 atmosphere.

Raman spectral studies

Fig. 2 shows the Raman spectra of CNFs and (Fe–Ni)-embedded CNFs, which consist of two characteristic peaks at 1350 cm−1 and 1580 cm−1 representing the defect-induced mode A1g or D band and the ordered E2g mode or G band. The G-band is associated with the (002) diffraction peak of the XRD pattern. R value (ID/IG) of CNFs and (Fe–Ni)-embedded CNFs are 1.04 and 0.69, respectively. The lower D/G intensity ratio of (Fe–Ni)-CNFs suggests that the graphitization, larger surface area and porous nature of the carbonaceous material is attributed to the high catalytic ability of (Fe–Ni) alloy nanoparticles towards carbonization.34,35 These properties of (Fe–Ni)-embedded CNFs may facilitate the fast electron transfer kinetics at the CE electrode/electrolyte interface.36,37
image file: c5ra04963f-f2.tif
Fig. 2 Raman spectra of CNFs and (Fe–Ni)-embedded CNFs carbonized at 1200 °C for 2 h in N2 atmosphere.

FE-SEM studies

The FE-SEM morphologies of (Fe–Ni)-embedded CNFs before and after carbonization are shown in Fig. 3(a and b). The FE-SEM image of (Fe–Ni)-embedded CNFs before carbonization indicates that the fibers are continuous, with bead-free morphology. After carbonization, (Fe–Ni)-embedded CNFs exhibit randomly oriented, interconnected porous morphology and well-embedded bimetallic (Fe–Ni) nanoparticles in the CNFs. The average diameter of (Fe–Ni)-embedded CNFs before and after carbonization are ∼340 nm and ∼230 nm, respectively. Further, the surface area of (Fe–Ni)-embedded CNFs was calculated by using the Brunauer–Emmett–Teller (BET) surface area measurement, showing 240 m2 g−1, which is much higher than the CNFs (94 m2 g−1). The presence of (Fe–Ni) alloy nanoparticles creates more randomly oriented, interconnected pores in CNFs due to the dissolution-precipitation mechanism during catalytic graphitization that leads to the large surface area of CNFs.38 The larger surface area is essential for high electrocatalytic activity. Further, this highly porous structure with larger surface area will enhance diffusion of the I/I3 redox species.39
image file: c5ra04963f-f3.tif
Fig. 3 (a) FE-SEM image of (Fe–Ni)-embedded CNFs before carbonization, (b) FE-SEM image of (Fe–Ni)-embedded CNFs after carbonization at 1200 °C for 2 h in N2 atmosphere.

TEM studies

The presence of bimetallic (Fe–Ni) nanoparticles on CNFs and the crystallinity of CNFs were further examined by TEM analysis. It can be seen that the bimetallic (Fe–Ni) alloy nanoparticles are well embedded in the CNFs. (Fe–Ni)-embedded CNFs consist of both turbostratic amorphous phase and ordered graphitic phase [Fig. 4(a–c)]. The porous and graphitic nature of CNFs provides a large number of active electrocatalytic sites for I3 reduction. The selected area electron diffraction (SAED) pattern exhibits bright diffraction spots that indicating the Fe–Ni nanoparticles are polycrystalline [Fig. 4(d)]. The obtained SAED pattern matches the results of the XRD pattern. The elemental distribution of (Fe–Ni)-embedded CNFs was examined by TEM-EDX and EDX-line analysis pattern [Fig. 4(e and f)]. Furthermore, EDS images of (Fe–Ni)-embedded CNFs show the presence of C, Fe and Ni, which are represented by red, green and blue regions, respectively [Fig. 4(g)]. It confirms the distribution of bimetallic (Fe–Ni) nanoparticles in CNFs.
image file: c5ra04963f-f4.tif
Fig. 4 (a and b) TEM image of (Fe–Ni)-embedded CNFs after carbonization at different magnifications, (c) TEM image of graphitic and (Fe–Ni) planes in CNFs and (d) SAED pattern of (Fe–Ni)-embedded CNFs. (e) TEM-EDX analysis, (f) line analysis of (Fe–Ni)-embedded CNFs after carbonization at 1200 °C for 2 h in N2 atmosphere, (g) EDS elemental mapping images of (Fe–Ni)-embedded CNFs.

Electrochemical studies

Electrochemical behaviors of the (Fe–Ni)-embedded CNF electrode were evaluated using cyclic voltammetry, electrochemical impedance and Tafel polarization studies, and their results are compared with CNFs and std. Pt electrodes.

Cyclic voltammetry studies

Cyclic voltammetry is widely used to study the redox processes and the kinetics of electron transfer reactions. Cyclic voltammograms were generated to evaluate the electrocatalytic activity of the counter materials, std. Pt, CNFs and (Fe–Ni)-embedded CNFs. The obtained cyclic voltammograms for std. Pt, CNFs and (Fe–Ni)-embedded CNFs are shown in Fig. 5(a). It can be seen that each cyclic voltammogram consists of a pair of oxidation (anodic) and reduction (cathodic) peaks. Among them, the left pair of redox peaks directly influences the photovoltaic performance of DSSC. The right pair of redox peaks has no significant impact on DSSCs.40 It can also be observed that the (Fe–Ni)-embedded CNFs possess a higher magnitude of redox peak current intensity and larger electrochemically active surface area. The larger, electrochemically active surface area of the electrode is due to the larger enclosed redox reaction area of the CV curve.7 Furthermore, the cathodic peak potential of (Fe–Ni)-embedded CNFs is more positive than CNFs and also comparable to std. Pt. This indicates lower overpotential losses, improved electrocatalytic activity and fast electron transfer kinetics in the reduction of triiodide ions. The improved electrocatalytic activity is due to the addition of bimetallic (Fe–Ni) nanoparticles, which act as an effective catalyst for the growth of CNFs, thus increasing the graphitic nature as well as the surface area.
 
3I ⇌ I3 + 2e Oxidation (1)
 
I3 + 2e ⇌ 3I Reduction (2)

image file: c5ra04963f-f5.tif
Fig. 5 (a) Cyclic voltammograms of Pt, CNFs and (Fe–Ni)-embedded CNFs in a liquid electrolyte containing a mixture of 0.01 M LiI, 0.001 M I2 and 0.1 M LiClO4 in acetonitrile at the scan rate of 50 mV s−1. (b) Cyclic voltammograms of (Fe–Ni)-embedded CNFs at different scan rates of 10, 25, 50, 100 and 200 mV s−1, (c) the oxidation and reduction current densities of (Fe–Ni)-embedded CNF electrode vs. square root of different scan rates. (d) Cyclic voltammograms of (Fe–Ni)-embedded CNFs for 100 consecutive cycles at the scan rate of 50 mV s−1, (e) the relationship between number of cycles and the maximum reduction peak current density for (Fe–Ni)-embedded CNFs.

CVs were done at various scan rates for std. Pt, CNFs and (Fe–Ni)-embedded CNFs, as shown in Fig. 5(b). As expected, the peak current density varied linearly with different scan rates. The reduction peaks (Jred) shift linearly to the negative side, and the corresponding oxidation peaks shift (Jox) to the positive side with increasing scan rates. A relationship between both the oxidation and reduction peak currents and the square root of different scan rates is shown in Fig. 5(c). The linear relationship at different scan rates suggests that the oxidation and reduction reactions of I3/I are diffusion-limited, which obeys the Randles–Sevcik equation (eqn (3)),41

 
Jred = Kn1.5AC(Dn)0.5ν0.5 (3)
where K is the constant of 2.69 × 10⁵; n is 2 because two electrons are involved in the electrochemical reduction reaction; A is the area of the working electrode (cm2); C represents the bulk concentration of I3 species (mol L−1); Dn is the diffusion constant (cm−2 s−1); and ν is the scan rate (mV s−1). The value Jred is higher for (Fe–Ni)-embedded CNFs than std. Pt and CNFs, which could enhance the charge transfer and diffusion of iodide species. Further, cyclic voltammetry was carried out for 100 consecutive cycles at the scan rate of 50 mV s−1 to verify compatibility of (Fe–Ni)-embedded CNFs with the electrolyte for a long time, as shown in Fig. 5(d). The relationship between the number of cycles and maximum reduction peak current densities is shown in Fig. 5(e). Unexpectedly, it is observed that there is only trivial variation in the maximum Jred between the 1st and 100th cycle, indicating the excellent electrochemical stability of (Fe–Ni)-embedded CNF electrode with the electrolyte.42,43 CV analysis of (Fe–Ni)-embedded CNFs revealed both promising electrocatalytic activity and electrochemical stability with the redox electrolyte; hence, it can be exploited as an effective CE for DSSC in place of Pt.

EIS studies

Electrochemical impedance spectroscopy is an additional tool to investigate the charge transfer kinetics of an electrochemical system. The Nyquist plots of std. Pt, CNFs and (Fe–Ni)-embedded CNFs compared with the corresponding Randles-type equivalent circuit is shown in Fig. 6. The equivalent circuit is shown as inset, and the parameters were determined from Z-fit software. The Nyquist plots contain series resistance (Rs), representing the resistance of the substrate in the higher-frequency region, charge transfer resistance at the electrode-electrolyte interface and Nernst diffusion impedance (Zw) in the lower-frequency region.22,24 The EIS parameters, such as series resistance and charge transfer resistance, were calculated from the Nyquist plots and summarized in Table 1. The series resistance of the CNF electrode was about twice that of Pt electrode. This is probably caused by the high thickness (∼15 μm) of the CNF electrode and higher electronic conductivity of the Pt, which are consistent with previous reports.44 Furthermore, the Rs value of (Fe–Ni)-embedded CNFs is reduced due to the graphitic character of CNFs, which provides sufficient electrical conductivity that leads to better contact with the substrate. The value of Rct determines the electrocatalytic activity of the electrode. It can be observed that the Rct value of (Fe–Ni)-embedded CNFs (3.01 Ω) is slightly lower than std. Pt (3.12 Ω).45,46 This might be attributed to the large surface area and randomly interconnected, porous morphology with graphitized structure from the addition of (Fe–Ni) nanoparticles in CNFs when compared to std. Pt. They enhanced the electrocatalytic activity and reduced the overpotential of (Fe–Ni)-embedded CNFs for the reduction of I3, which is evident from the cyclic voltammograms [Fig. 5(a)]. In addition, the addition of bimetallic (Fe–Ni) nanoparticles in CNFs improved contact with the substrate compared to pure CNFs. The porous network enhances the contact of a large quantity of ionic liquid electrolyte, which leads to the faster redox reaction kinetics of I3/I.45
image file: c5ra04963f-f6.tif
Fig. 6 Nyquist plots of symmetrical cells fabricated with two identical std. Pt, CNF and (Fe–Ni)-embedded CNF electrodes.
Table 1 Electrochemical parameters derived from Nyquist and Tafel plots for various counter electrode materials
Electrodes Rs (Ω) Rct (Ω) J0 (mA cm−2)
Pt (std) 5.07 3.12 4.12
CNFs 10.06 9.12 1.41
(Fe–Ni)-CNFs 7.50 3.01 4.26


Tafel polarization studies

Tafel polarization curves were also generated to further verify the electrocatalytic activity using the same symmetric cells. The Tafel plot comprises three regions. The curve at high potential (horizontal part) is attributed to the diffusion zone, the one at low potential region is ascribed to the polarization zone, and the curve at middle potential (with a sharp slope) is represented as the Tafel zone (potential region higher than 120 mV) related to charge transfer between triiodide and the CE. In theory, the charge-transfer resistance inversely varies with the exchange current density (J0), where R and F are constant, T is the room temperature, and n is the number of electrons involved in the reduction reaction [eqn (4)]. The J0 value can be estimated from an intersection of the tangent line of the Tafel zone and the extension line of the zero bias; then the large slope of Tafel zone tangent line will lead to a large J0 and small Rct. The electrocatalytic activity of the material depends on the J0 and limiting diffusion current density (Jlim).42,47 The cathodic branch of the curve exhibits a large slope in the Tafel zone that indicates a higher J0 for (Fe–Ni)-embedded CNFs than CNFs, signifying better catalytic performance [Fig. 7]. The J0 can be also calculated using eqn (4), and their values are given in Table 1. The Tafel polarization measurement result is in good agreement with EIS results.
 
J0 = RT/nFRct (4)

image file: c5ra04963f-f7.tif
Fig. 7 Tafel plots for std. Pt, CNF, and (Fe–Ni)-embedded CNF counter electrode materials at the scan rate of 50 mV s−1 using symmetric cells.

Photovoltaic performance studies

The photovoltaic performance for DSSCs fabricated separately using (Fe–Ni)-embedded CNFs, std. Pt and CNFs as CEs are shown in Fig. 8. Their corresponding photovoltaic parameters are summarized in Table 2. The DSSC based on (Fe–Ni)-embedded CNFs achieved almost comparable PCE to std. Pt. However, it is higher than other previously reported systems (Table 3). The CNF-based DSSCs have lesser fill factor (FF) compared to Pt-based DSSC, which has high Rs due to the thick CNF layer. The inclusion of bimetallic nanoparticles has reduced the total series resistance of (Fe–Ni)-embedded CNF-based DSSC, which facilitates the improvement of FF compared to CNF-based DSSC. The open circuit voltage (Voc) of (Fe–Ni)-embedded CNFs was higher compared to the std. Pt-based DSSC, attributed to the superior electrocatalytic activity of (Fe–Ni)-embedded CNF-based CE.48–50 Therefore, the overall improvement on the photovoltaic performance of (Fe–Ni)-embedded CNF-based DSSC is due to the large surface area and randomly oriented, interconnected, porous morphology with graphitized structure that facilitate high electrocatalytic activity, low charge transfer resistance at the electrode/electrolyte interface and fast reaction kinetics for the reduction of I3 to I.
image file: c5ra04963f-f8.tif
Fig. 8 Photovoltaic performance of DSSCs fabricated using different CEs in a calibrated AM 1.5 solar simulator with a light intensity of 100 mW cm−2.
Table 2 Photovoltaic parameters of DSSC fabricated using different counter electrodes
Counter electrodes Voc (V) Jsc (mA cm−2) FF η (%)
Pt (std) 0.71 9.8 0.66 4.6
CNFs 0.74 7.3 0.58 3.1
(Fe–Ni)- CNFs 0.72 10.1 0.65 4.7


Table 3 Comparison of photovoltaic performances of DSSCs fabricated using CNF-based composites as counter electrodes
Counter electrode Voc (V) Jsc (mA cm−2) FF Cell efficiency, η (%) Achieved PCE w.r.t std. Pt (%) References
Std. Pt CNF composites
CNFs 0.76 12.60 0.57 6.97 5.50 78.9 21
CNFs/TiO2 0.84 13.69 0.63 7.57 7.46 95.8 22
Ni–CNT–CNFs 0.80 15.83 0.63 8.32 7.96 95.7 23
TiC/CNFs–Pt 0.78 14.40 0.64 7.54 7.21 95.6 24
(Pd–Co) in CNFs 0.71 9.80 0.37 2.50 25
Ni–Cu in CNFs 0.70 7.67 0.65 5.60 3.50 62.5 26
(Fe–Ni) in CNFs 0.72 10.10 0.65 4.60 4.70 ∼102.2 This work


Conclusion

The electrospinning technique was employed to effectively prepare (Fe–Ni)-embedded CNFs. XRD results confirm the formation of (Fe–Ni) alloy nanoparticle-embedded CNFs. The inclusion of Fe and Ni in CNFs and an average diameter (∼230 nm) of nanofibers were identified from FE-SEM images. The TEM results confirmed that CNFs were embedded with polycrystalline (Fe–Ni) nanoparticles. The superior electrocatalytic activity of (Fe–Ni)-embedded CNFs was confirmed from the outcomes of CV, EIS and Tafel polarization studies. The photovoltaic performance of DSSC fabricated using (Fe–Ni)-embedded CNFs as counter electrode exhibited Voc, Jsc, FF and PCE values of 0.72 V, 10.1 mA cm−2, 0.65 and 4.7%, respectively. The (Fe–Ni)-embedded CNF-based DSSC achieved almost comparable PCE to the same fabricated using std. Pt due to enhanced electrocatalytic activity, electrochemical stability, charge transfer rate and faster reaction kinetics with high exchange current density. Therefore, the proposed outcomes highlighted the promising CE material performance of (Fe–Ni)-embedded CNFs. Hence, it could be a cost effective substitute to std. Pt-based CE and also opens up the possibility for the commercialization of DSSCs.

Acknowledgements

One of the authors, Dr AS, thanks the Pondicherry University for the financial support under Start-up Research Grant (Ref. no. PU/PC/start-up/2011-12/310) and the authors thank the CIF of Pondicherry University for extending the instrumentation facilities.

References

  1. B. O'Regan and M. Gratzel, Nature, 1991, 353, 737–740 CrossRef PubMed.
  2. M. K. Nazeeruddin, A. Kay, I. Rodicio, R. Humphry-Baker, E. Mueller, P. Liska, N. Vlachopoulos and M. Graetzel, J. Am. Ceram. Soc., 1993, 115, 6382–6390 CrossRef CAS.
  3. S. Mathew, A. Yella, P. Gao, R. Humphry-Baker, F. E. Curchod, N. Ashari-Astani, I. Tavernelli, U. Rothlisberger, K. Nazeeruddin and M. Grätzel, Nat. Chem., 2014, 6, 242–247 CrossRef CAS PubMed.
  4. E. Olsen, G. Hagen and S. Eric Lindquist, Sol. Energy Mater. Sol. Cells, 2000, 63, 267–273 CrossRef CAS.
  5. G. Hashmi, K. Miettunen, T. Peltola, J. Halme, I. Asghar, K. Aitola, M. Toivola and P. Lund, Renewable Sustainable Energy Rev., 2011, 15, 3717–3732 CrossRef CAS PubMed.
  6. K. Saranya, M. Rameez and A. Subramania, Eur. Polym. J., 2015, 66, 207–227 CrossRef CAS PubMed.
  7. M. Wu, X. Lin, Y. Wang, L. Wang, W. Guo, D. Qi, X. Peng, A. Hagfeldt, M. Grätzel and T. Ma, J. Am. Ceram. Soc., 2012, 134, 3419–3428 CrossRef CAS PubMed.
  8. S. I. Cha, B. K. Koo, S. H. Seo and D. Y. Lee, J. Mater. Chem., 2010, 20, 659–662 RSC.
  9. P. Srinivasu, S. P. Singh, A. Islam and L. Han, Int. J. Photoenergy, 2011, 2011, 757421–757426 CrossRef PubMed.
  10. H. Wang and Y. H. Hu, Energy Environ. Sci., 2012, 5, 8182–8188 CAS.
  11. S. P. Lim, A. Pandikumar, Y. S. Lim, N. M. Huang and H. N. Lim, Sci. Rep., 2014, 4, 5305–5311 Search PubMed.
  12. S. Thomas, T. G. Deepak, G. S. Anjusree, T. A. Arun, S. V. Nair and A. S. Nair, J. Mater. Chem. A, 2014, 2, 4474–4490 CAS.
  13. W. Kwon, J.-M. Kim and S. W. Rhee, J. Mater. Chem. A, 2013, 1, 3202–3215 CAS.
  14. L. Zhang, A. Aboagye, A. Kelkar, C. Lai and H. Fong, J. Mater. Sci., 2014, 49, 463–480 CrossRef CAS.
  15. M. Inagaki, Y. Yang and F. Kang, Adv. Mater., 2012, 24, 2547–2566 CrossRef CAS PubMed.
  16. L. Feng, N. Xie and J. Zhong, Materials, 2014, 7, 3919–3945 CrossRef CAS PubMed.
  17. X. Zhang, P. Suresh Kumar, V. Aravindan, H. H. Liu, J. Sundaramurthy, S. G. Mhaisalkar, H. M. Duong, S. Ramakrishna and S. Madhavi, J. Phys. Chem. C, 2012, 116, 14780–14788 CAS.
  18. X. Zhang, V. Thavasi, S. G. Mhaisalkar and S. Ramakrishna, Nanoscale, 2012, 4, 1707–1716 RSC.
  19. X. Zhang, H. Liu, S. Petnikota, S. Ramakrishna and H. J. Fan, J. Mater. Chem. A, 2014, 2, 10835–10841 CAS.
  20. X. Zhang, V. Aravindan, P. S. Kumar, H. Liu, J. Sundaramurthy, S. Ramakrishna and S. Madhavi, Nanoscale, 2013, 5, 5973–5980 RSC.
  21. P. Joshi, L. Zhang, Q. Chen, D. Galipeau, H. Fong and Q. Qiao, ACS Appl. Mater. Interfaces, 2010, 2, 3572–3577 CAS.
  22. S. Sigdel, A. Dubey, H. Elbohy, A. Aboagye, D. Galipeau, L. Zhang, H. Fong and Q. Qiao, J. Mater. Chem. A, 2014, 2, 11448–11453 CAS.
  23. P. Joshi, Z. Zhou, P. Poudel, A. Thapa, X.-F. Wu and Q. Qiao, Nanoscale, 2012, 4, 5659–5664 RSC.
  24. Y. Zhao, A. Thapa, Q. Feng, M. Xi, Q. Qiao and H. Fong, Nanoscale, 2013, 5, 11742–11747 RSC.
  25. N. A. M. Barakat, M. Shaheer Akhtar, A. Yousef, M. El-Newehy and H. Y. Kim, Chem. Eng. J., 2012, 211–212, 9–15 CrossRef CAS PubMed.
  26. A. Yousef, M. S. Akhtar, N. A. M. Barakat, M. Motlak, O. B. Yang and H. Y. Kim, Electrochim. Acta, 2013, 102, 142–148 CrossRef CAS PubMed.
  27. C. Burda, X. Chen, R. Narayanan and M. A. El-Sayed, Chem. Rev., 2005, 105, 1025–1102 CrossRef CAS PubMed.
  28. G. Chieffi, C. Giordano, M. Antonietti and D. Esposito, J. Mater. Chem. A, 2014, 2, 11591–11596 CAS.
  29. S. Gurmen, B. Ebin, S. Stopić and B. Friedrich, J. Alloys Compd., 2009, 480, 529–533 CrossRef CAS PubMed.
  30. H. Bisht, H. T. Eun, A. Mehrtens and M. A. Aegerter, Thin Solid Films, 1999, 351, 109–114 CrossRef CAS.
  31. K. Saranya, N. Sivasankar and A. Subramania, RSC Adv., 2014, 4, 36226–36233 RSC.
  32. A. R. S. Priya, A. Subramania, Y.-S. Jung and K. J. Kim, Langmuir, 2008, 24, 9816–9819 CrossRef CAS PubMed.
  33. H. Wu, C. Qian, Y. Cao, P. Cao, W. Li, X. Zhang and X. Wei, J. Phys. Chem. Solids, 2010, 71, 290–295 CrossRef CAS PubMed.
  34. H. Zhou, Q. Yu, Q. Peng, H. Wang, J. Chen and Y. Kuang, Mater. Chem. Phys., 2008, 110, 434–439 CrossRef CAS PubMed.
  35. X. An, D. Shin, J. D. Ocon, J. K. Lee, Y.-i. Son and J. Lee, Chin. J. Catal., 2014, 35, 891–895 CrossRef CAS.
  36. G. Veerappan, K. Bojan and S. W. Rhee, ACS Appl. Mater. Interfaces, 2011, 3, 857–862 CAS.
  37. W. J. Lee, E. Ramasamy, D. Y. Lee and J. S. Song, ACS Appl. Mater. Interfaces, 2009, 1, 1145–1149 CAS.
  38. T. V. Reshetenko, L. B. Avdeeva, Z. R. Ismagilov, V. V. Pushkarev, S. V. Cherepanova, A. L. Chuvilin and V. A. Likholobov, Carbon, 2003, 41, 1605–1615 CrossRef CAS.
  39. K. Imoto, K. Takahashi, T. Yamaguchi, T. Komura, J. I. Nakamura and K. Murata, Sol. Energy Mater. Sol. Cells, 2003, 79, 459–469 CrossRef CAS.
  40. X. Pan, K. Zhu, G. Ren, N. Islam, J. Warzywoda and Z. Fan, J. Mater. Chem. A, 2014, 2, 12746–12753 CAS.
  41. J. Jin, X. Zhang and T. He, J. Phys. Chem. C, 2014, 118, 24877–24883 CAS.
  42. M. H. Yeh, L. Y. Lin, J. S. Su, Y. A. Leu, R. Vittal, C. L. Sun and K. C. Ho, ChemElectroChem, 2014, 1, 416–425 CrossRef CAS PubMed.
  43. Z. Tang, Q. Tang, J. Wu, Y. Li, Q. Liu, M. Zheng, Y. Xiao, G. Yue, M. Huang and J. Lin, RSC Adv., 2012, 2, 5034–5037 RSC.
  44. T. N. Murakami, S. Ito, Q. Wang, M. K. Nazeeruddin, T. Bessho, I. Cesar, P. Liska, R. Humphry-Baker, P. Comte, P. Péchy and M. Grätzel, J. Electrochem. Soc., 2006, 153, A2255–A2261 CrossRef CAS PubMed.
  45. S. H. Park, H. R. Jung, B. K. Kim and W. J. Lee, J. Photochem. Photobiol., A, 2012, 246, 45–49 CrossRef CAS PubMed.
  46. X. Zheng, J. Deng, N. Wang, D. Deng, W. H. Zhang, X. Bao and C. Li, Angew. Chem., 2014, 53, 7023–7027 CrossRef CAS PubMed.
  47. C.-W. Kung, H. W. Chen, C. Y. Lin, K. C. Huang, R. Vittal and K. C. Ho, ACS Nano, 2012, 6, 7016–7025 CrossRef CAS PubMed.
  48. S. H. Park, H.-R. Jung and W. J. Lee, Electrochim. Acta, 2013, 102, 423–428 CrossRef CAS PubMed.
  49. G. Veerappan, W. Kwon and S. W. Rhee, J. Power Sources, 2011, 196, 10798–10805 CrossRef CAS PubMed.
  50. Q. Wang, S. Ito, M. Grätzel, F. Fabregat-Santiago, I. Mora-Seró, J. Bisquert, T. Bessho and H. Imai, J. Phys. Chem. B, 2006, 110, 25210–25221 CrossRef CAS PubMed.

This journal is © The Royal Society of Chemistry 2015