Preparation of t-ZrO2 by a sol–gel process with carbon as a phase transformation promoter
Yu Liu,
Weidong Chi*,
Hui Liu,
Yueyang Su and
Liang Zhao
Key Laboratory of Carbon Fiber and Functional Polymers, Beijing University of Chemical Technology, National Carbon Fiber Engineering Research Center, State Key Laboratory of Organic–Inorganic Composites, Beijing 100029, China. E-mail: wdchi@163.com
First published on 8th April 2015
Abstract
Cubic and tetragonal ZrO2 were synthesized by a sol–gel method using ethanol and glycerol as solvents and ZrOCl2·8H2O as zirconium source. The effect of phase stabilization with amorphous carbon was observed and discussed. The structural evolution, phase transformation and morphological characteristics of powders were investigated by thermogravimetric analysis (TG), differential scanning calorimetric analysis (DSC), powder X-ray diffraction (XRD), X-ray photoelectron spectroscopy (XPS) and scanning electron microscopy (SEM). Cubic and tetragonal phase could be generated in this system.
1. Introduction
Zirconia (ZrO2) ceramic is one of the advanced ceramic materials. It has a series of outstanding properties, such as high melting point, high specific strength, excellent corrosion resistance, low thermal conductivity and low heat capacity.1,2 Zirconia ceramics are used for production of catalysts, dielectric materials, chemical sensors, high-performance ceramic materials, solid oxide fuel cells and functional coatings.3–5 Pure ZrO2 presents three forms of crystal structure: monoclinic phase (m-ZrO2), tetragonal phase (t-ZrO2) and cubic phase (c-ZrO2).6,7 The m-ZrO2 is stable at room temperature, while the t-ZrO2 and c-ZrO2 are commonly observed in high temperature environments. The transitions between them usually happen in particular circumstances. The m-ZrO2 reversibly transforms to t-ZrO2 and then to c-ZrO2 at 1170 °C and 2370 °C, respectively. However, the mechanical property of m-ZrO2 is too poor for use. In most cases, t-ZrO2 or c-ZrO2 ceramics are more suitable for application. Therefore, the preparation of them has become a challenge in research now.For obtaining t-ZrO2 ceramics, various methods have been developed and investigated, including rare earth stabilization method, annealing method, low temperature calcination method and sol–gel method.8 The homogeneous mixture of the components makes sol–gel method an outstanding synthesis, which allows obtaining the powder with well-controlled homogeneity, purity, reactivity, particle morphology and microstructure.9–11 However, the ZrO2 ceramics synthesized by sol–gel method are commonly mixed with tetragonal and monoclinic phase in most cases. Storing energy in the system could be a way to stabilize t-ZrO2 and c-ZrO2, and to solve this problem.
This paper discusses the sol–gel system with alcohols as solvent and origin of phase transformation component in the synthesis of c-ZrO2 and t-ZrO2 from ZrOCl2·8H2O by thermal decomposition. Suitable alcohols could be able to change into amorphous carbon and provide the energy of c-ZrO2 generation. The addition of Y2O3 would benefit the stability of t-ZrO2.
2. Experimental
The zirconia ceramics were synthesized using the sol–gel process. 0.4 mol L−1 zirconium oxychloride octahydrate (ZrOCl2·8H2O, 99.9%, Aladdin Industrial Corporation) was dissolved in the mixture of anhydrous ethanol and glycerol(C2H6O, C3H8O3, 99%, Beijing Chemicals) with a volume ratio of 1![[thin space (1/6-em)]](https://www.rsc.org/images/entities/char_2009.gif) :
:![[thin space (1/6-em)]](https://www.rsc.org/images/entities/char_2009.gif) 3 (sample Z1). For the comparative experiment, 3 wt% of Nanometer yttrium oxide (Y2O3, 99.99%, Aladdin Industrial Corporation) was added to stabilize tetragonal or cubic phase (sample Z2). Sols fully transform into gels under 500 W ultrasound and 50 °C water bath assisted for 20 minutes. Additionally, Nano carbon powder (99.5%, Aladdin Industrial Corporation) and m-ZrO2 (99%, Aladdin Industrial Corporation) were mixed in 1
3 (sample Z1). For the comparative experiment, 3 wt% of Nanometer yttrium oxide (Y2O3, 99.99%, Aladdin Industrial Corporation) was added to stabilize tetragonal or cubic phase (sample Z2). Sols fully transform into gels under 500 W ultrasound and 50 °C water bath assisted for 20 minutes. Additionally, Nano carbon powder (99.5%, Aladdin Industrial Corporation) and m-ZrO2 (99%, Aladdin Industrial Corporation) were mixed in 1![[thin space (1/6-em)]](https://www.rsc.org/images/entities/char_2009.gif) :
:![[thin space (1/6-em)]](https://www.rsc.org/images/entities/char_2009.gif) 1 mass ratio (sample MS) to check the role of amorphous carbon as phase transformation promoter.
1 mass ratio (sample MS) to check the role of amorphous carbon as phase transformation promoter.
The precursor powders were produced by heating the sols above the fully weight loss point. The weight loss point has been determined by thermogravimetric analysis (TG, Netzsch TG-209F-3) in N2 atmosphere with a heat rate of 10 °C min−1. The powders were calcined at 1300 °C in N2 atmosphere for phase and structure evolution study. Thermal analyses of the phase variation were carried out by differential scanning calorimetric analysis (DSC, Netzsch DSC-404F-3) in N2 atmosphere with a heat rate of 10 °C min−1. Morphological characteristic of powders were investigated by scanning electron microscopy (SEM, HITACHI S-4700). The crystalline phases of ZrO2 powders calcined at different conditions (600 °C, 1300 °C and 1300 °C second sintering) and MS calcined at 1300 °C were identified by powder X-ray diffraction (XRD, Bruker D8 Advance). The scans were taken within the 2θ between 20° and 90°, and operated at an accelerating voltage of 40 kV and an emission current of 40 mA. The powders of sample MS after calcination at 1300 °C were analyzed by X-ray photoelectron spectroscopy (XPS, ESCALAB 250) with Monochromated Al Kalph (150 W). The spot size was focused to∼500 μm (Fig. 1).
3. Results and discussion
3.1. Generation of c-ZrO2
Sample MS (C![[thin space (1/6-em)]](https://www.rsc.org/images/entities/char_2009.gif) :
:![[thin space (1/6-em)]](https://www.rsc.org/images/entities/char_2009.gif) m-ZrO2 = 1
m-ZrO2 = 1![[thin space (1/6-em)]](https://www.rsc.org/images/entities/char_2009.gif) :
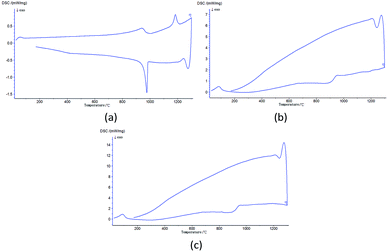
:![[thin space (1/6-em)]](https://www.rsc.org/images/entities/char_2009.gif) 1) was designed to investigate the generation process of c-ZrO2. Fig. 2 shows the XRD patterns of sample MS calcined at 1300 °C. After the heat treatment m-ZrO2 partly transformed into c-ZrO2 and remained stable in the cubic phase after natural cooling to room temperature. Fig. 3(a) shows the DSC curve of the process. Under normal conditions, m-ZrO2 would first become t-ZrO2 at around 1170 °C, and change back in the cooling process. However, the crystal form transition process underwent in sample MS was completely different (Fig. 3(b)). The phase transformation from monoclinic to tetragonal phase was entirely prevented in the heating process. The only peak corresponded to the endothermic behavior of nano carbon powder (Fig. 3(c)) is observed in the heating process of sample MS. The steep curves in Fig. 3(b) and (c) indicate the great amount of heat absorbed by nano carbon powder. The following next heat release rapidly increase the internal energy of the m-ZrO2 in sample MS and provide it transformation into c-ZrO2. The energy stored in amorphous carbon increase the surface energy of ZrO2 phase, that stabilizes the c-ZrO2 and overlap the bulk energy difference of c-ZrO2–m-ZrO2 transformation. Thus, c-ZrO2 is not able to transform back into t-ZrO2 or m-ZrO2 and keep stable. However, the nonuniform mixing of the two powders makes the m-ZrO2 presence possible.
1) was designed to investigate the generation process of c-ZrO2. Fig. 2 shows the XRD patterns of sample MS calcined at 1300 °C. After the heat treatment m-ZrO2 partly transformed into c-ZrO2 and remained stable in the cubic phase after natural cooling to room temperature. Fig. 3(a) shows the DSC curve of the process. Under normal conditions, m-ZrO2 would first become t-ZrO2 at around 1170 °C, and change back in the cooling process. However, the crystal form transition process underwent in sample MS was completely different (Fig. 3(b)). The phase transformation from monoclinic to tetragonal phase was entirely prevented in the heating process. The only peak corresponded to the endothermic behavior of nano carbon powder (Fig. 3(c)) is observed in the heating process of sample MS. The steep curves in Fig. 3(b) and (c) indicate the great amount of heat absorbed by nano carbon powder. The following next heat release rapidly increase the internal energy of the m-ZrO2 in sample MS and provide it transformation into c-ZrO2. The energy stored in amorphous carbon increase the surface energy of ZrO2 phase, that stabilizes the c-ZrO2 and overlap the bulk energy difference of c-ZrO2–m-ZrO2 transformation. Thus, c-ZrO2 is not able to transform back into t-ZrO2 or m-ZrO2 and keep stable. However, the nonuniform mixing of the two powders makes the m-ZrO2 presence possible.
3.2. Characterization of ZrO2 precursor powders
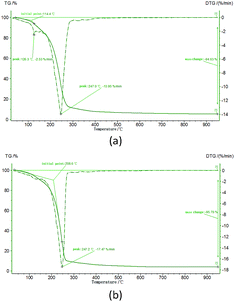
The precursor powders are used to provide homogeneously mixed carbon and ZrO2. Sol–gel method could mix carbon and ZrO2 in molecular level to make better use of the energy that carbon stored. Fig. 4 shows the TG curves of sample Z1 and Z2. The weight loss peaks at around 247 °C correspond to the evaporation of solvents and the reduction of the organic phase of the gels. The solid phase was generated at around 247 °C and had no more weight loss with the temperature increasing, indicating the molecular level mixed precursor powders of amorphous carbon and ZrO2 were prepared. As it is shown in Fig. 5, no crystalline substance could be observed in the precursor powders.3.3. Crystallization process of ZrO2 ceramics
Fig. 6 shows the DSC curves of sample Z1 and Z2. There are two exothermic peaks and one endothermic peak in both of the two curves. The exothermic peaks at around 350 °C and 500 °C are associated with the structural variation of the ZrO2 powders. These peaks might be attributed to the energy of chain scission or bond breaking. Organic substance of the system vanished completely after calcination at 300 °C. The structure of the ZrO2 powders might be the chain of –Zr–O–Zr– or the bulk of Zr and O. The morphology of these structures is amorphous as it can be seen in Fig. 5. These structures were destroyed in the heating process from 300 °C to 550 °C with energy release. The endothermic peaks at around 1000 °C should be related to endothermic peak of carbon in Fig. 3(c). Affected by the energy stored in amorphous carbon, we could not detect the crystal form of sample Z1 and Z2 in the heating process.Shown in Fig. 7 is the XRD patterns of ZrO2 powders calcined at 1300 °C. The ZrO2 sample of Z1 was in a fully stabilized tetragonal state, while the sample of Z2 was in a heterogeneous state formed by tetragonal and cubic phase. As it has been mentioned above (see in 3.1), cubic phase should be generated in the cooling process, and the energy source is amorphous carbon. In sample Z1, the energy that amorphous carbon provides was able to form cubic phase, but not high enough to stabilize the c-ZrO2 at low temperature, which is caused by the low ratio of C![[thin space (1/6-em)]](https://www.rsc.org/images/entities/char_2009.gif) :
:![[thin space (1/6-em)]](https://www.rsc.org/images/entities/char_2009.gif) ZrO2. In normal cases, t-ZrO2 would transform back into m-ZrO2 in cooling procedure. However, no evidence of monoclinic phase could be observed in these samples, because the transformation from c-ZrO2 to t-ZrO2 would release energy and slow down or inhibit the transition from t-ZrO2 to m-ZrO2. For sample Z2, the Y2O3 as a stabilizer could form liquid phase in the sample. During the heat treatment, the Y2O3 doping could diffuse into the ZrO2 crystal lattice.12,13 In the process of temperature reduction, the Y2O3 could slow down the crystal structure transformation which cause the stabilization of the cubic phase of sample Z2 in room temperature.
ZrO2. In normal cases, t-ZrO2 would transform back into m-ZrO2 in cooling procedure. However, no evidence of monoclinic phase could be observed in these samples, because the transformation from c-ZrO2 to t-ZrO2 would release energy and slow down or inhibit the transition from t-ZrO2 to m-ZrO2. For sample Z2, the Y2O3 as a stabilizer could form liquid phase in the sample. During the heat treatment, the Y2O3 doping could diffuse into the ZrO2 crystal lattice.12,13 In the process of temperature reduction, the Y2O3 could slow down the crystal structure transformation which cause the stabilization of the cubic phase of sample Z2 in room temperature.
Furthermore, the surface morphology of the samples has been investigated. The SEM images of these two samples are shown in Fig. 8. It is observed that the fine structure was affected by whether adding yttria or not. For sample Z1, the SEM reveals a flat and loose morphology of ZrO2 surface (see Fig. 8(a)). And the morphology of sample Z2 is rough and uneven (see Fig. 8(b)). It is affected by the volume differences of t-ZrO2 and c-ZrO2.
3.4. Stabilization process of tetragonal phase
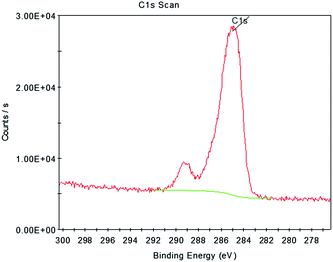
To investigate the principle of stabilization of tetragonal phase, the crystalline structure under other thermal conditions was taken into consideration. The XRD patterns of ZrO2 samples went through second sintering are shown in Fig. 9. No cubic peaks but trace amount of monoclinic peaks could be observed in these XRD patterns. Tetragonal and cubic phases were still unstable during additional heat treatment without the addition of Y2O3. Amorphous carbon could largely prevent the change to m-ZrO2, but the trace of the variation still could be found. And yet, the ratio of monoclinic in sample Z2 was obviously lower than Z1. It would be attributed to the effect of Y2O3, and the energy released by the transformation from c-ZrO2 to t-ZrO2.In former studies, amorphous carbon was found to have the ability to diffuse into the ZrO2 crystal lattice and stabilize tetragonal phase. The XPS peaks at around 282.9 eV which were assigned to C 1s binding energy from Zr–C bonds could be a proof of it.14 However, this phenomenon could not be detected in all cases.15 For sample MS after calcined at 1300 °C, as it can be seen in Fig. 10, no Zr–C bindings, which would be respected by a C 1s binding energy at 281.1 eV or 282.1 eV, was detected. There are no chemical reactions between ZrO2 and C. It proves that the stored energy of amorphous carbon played an important role in stabilizing tetragonal and cubic phases in sample Z1 and Z2.
The XRD patterns of ZrO2 powders calcined at 600 °C are displayed in Fig. 11. Clearly, there is no evidence of monoclinic phase in the samples. The broadening of diffraction peaks was attributed to the amorphous component of the ZrO2 samples. It was clear that for the ZrO2 powders prepared by Z1 and Z2 system, calcination of 600 °C would transform part of the ZrO2 powders from amorphous phase to tetragonal phase. Amorphous carbon could also store and release energy to make ZrO2 crystal. But the energy value would be much lower than it was in 1300 °C.
Through the above analysis, there are ways to generate better crystalized and more stable t-ZrO2 or c-ZrO2 by increase the ratio of C/ZrO2. Choosing the higher carbon content solvents or just adding some carbon powder would be useful.
4. Conclusions
ZrO2 ceramics were synthesized by sol–gel method using ethanol and glycerol as solvent and ZrOCl2·8H2O as zirconium source. It could synthesize and stabilize t-ZrO2 and c-ZrO2 at a low temperature. The energy source is the amorphous carbon in the system. The energy release from carbon and the transformation from c-ZrO2 to t-ZrO2 could slow down or inhabit the transformation from t-ZrO2 to m-ZrO2. Y2O3 in the sample as a stabilizer would also stabilize the tetragonal phase.Notes and references
- X. Pian, B. Fan and H. Chen, Preparation of m-ZrO2 compacts by microwave sintering, Ceram. Int., 2014, 40, 10483–10488 CrossRef CAS PubMed.
- L. Kong, S. Zhu and Q. Bi, Friction and wear behavior of self-lubricating ZrO2(Y2O3)-CaF2-Mo-graphite composite from 20 °C to 1000 °C, Ceram. Int., 2014, 40, 10787–10792 CrossRef CAS.
- T. Sreethawong, S. Ngamsinlapasathian and S. Yoshikawa, Synthesis of crystalline mesoporous-assembled ZrO2 nanoparticles via a facile surfactant-aided sol–gel process and their photocatalytic dye degradation activity, Chem. Eng. J., 2013, 228, 256–262 CrossRef CAS PubMed.
- S. Jaenicke, G. K. Chuah and V. Raju, Structural and Morphological Control in the Preparation of High Surface Area Zirconia, Catal. Surv. Asia, 2008, 12, 153–169 CrossRef CAS.
- Q. Chang, J.-e Zhou and Y. Wang, Formation mechanism of zirconia nano-particles containing pores prepared via sol–gel–hydrothermal method, Adv. Powder Technol., 2010, 21, 425–430 CrossRef CAS PubMed.
- W. Huang, J. Yang and X. Meng, Effect of the organic additions on crystal growth behavior of ZrO2 nanocrystals prepared via sol–gel process, Chem. Eng. J., 2011, 168, 1360–1368 CrossRef CAS PubMed.
- R. Zhang, H. Liu and D. He, Pure monoclinic ZrO2 prepared by hydrothermal method for isosynthesis, Catal. Commun., 2012, 26, 244–247 CrossRef CAS PubMed.
- V. G. Deshmane and Y. G. Adewuyi, Synthesis of thermally stable, high surface area, nanocrystalline mesoporous tetragonal zirconium dioxide (ZrO2): Effects of different process parameters, Microporous Mesoporous Mater., 2012, 148, 88–100 CrossRef CAS PubMed.
- H. Ji, M. Yang and M. Li, Low-temperature synthesis of ZrB2 nano-powders using a sorbitol modified sol–gel processing route, Adv. Powder Technol., 2014, 25, 910–915 CrossRef CAS PubMed.
- H. Bensouyad, H. Sedrati and H. Dehdouh, Structural, thermal and optical characterization of TiO2:ZrO2 thin films prepared by sol–gel method, Thin Solid Films, 2010, 519, 96–100 CrossRef CAS PubMed.
- R. Caruso, O. de Sanctis and A. Macias-Garcia, Influence of pH value and solvent utilized in the sol–gel synthesis on properties of derived ZrO2 powders, J. Mater. Process. Technol., 2004, 152, 299–303 CrossRef CAS PubMed.
- N. Mamana, A. Díaz-Parralejo and A. L. Ortiz, Influence of the synthesis process on the features of Y2O3-stabilized ZrO2 powders obtained by the sol–gel method, Ceram. Int., 2014, 40, 6421–6426 CrossRef CAS PubMed.
- A. L. Ortiz, A. Díaz-Parralejo and O. Borrero-López, Effect of ion nitriding on the crystal structure of 3 mol% Y2O3-doped ZrO2 thin-films prepared by the sol–gel method, Appl. Surf. Sci., 2006, 252, 6018–6021 CrossRef CAS PubMed.
- H. Xiang, X. Lu and J. Li, Influence of carbon on phase stability of tetragonal ZrO2, Ceram. Int., 2014, 40, 5645–5651 CrossRef CAS PubMed.
- N. Laidani, V. Micheli and M. Anderle, Carbon effect on the phase structure and the hardness of RF sputtered zirconia films, Thin Solid Films, 2001, 382, 23–29 CrossRef CAS.
| This journal is © The Royal Society of Chemistry 2015 |


