Identification of disinfection by-product precursors from the discharge of a coking wastewater treatment plant

Chong Lin*ab, Xianrong Zhuoa, Xubiao Yub, Mengyang Yuanb and Chaohai Weibc
aCollege of Urban Construction, Zhongkai University of Agriculture and Engineering, Guangzhou 510225, P. R. China. E-mail: huagong246@gmail.com; Fax: +86 20 89002073; Tel: +86 20 89002073
bCollege of Environment and Energy, South China University of Technology, Guangzhou 510006, P. R. China
cThe Key Lab of Pollution Control and Ecosystem Restoration in Industry Clusters, Ministry of Education, Guangzhou 510006, P. R. China

Received 20th March 2015 , Accepted 8th May 2015

First published on 11th May 2015


Abstract

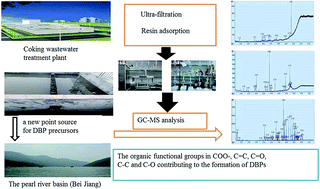
Coking wastewater discharge can lead to pollution, due to water reuse or release to surface water after the disinfection process. In this work, the dissolved organic matter (DOM) in the effluent was isolated into 42 classes using molecular weight distribution and resin adsorbents. The trihalomethane and haloacetonitrile formation potential (THMFP and HANFP) from each fraction were measured and correlated with the UV-vis absorption and fluorescence excitation-emission matrix (EEM), and the compounds in the classes as precursors were determined by solid phase extraction, silica chromatography and GC/MS. The results show that the highest SUVA in the >100 kDa faction was 12.1 L mg−1 cm−1. The lower MW fractions (5–10 kDa, 3–5 kDa, 1–3 kDa and <1 kDa) had similar SUVA of about 4.1 L mg−1 cm−1. The HiA (Hydrophilic acids) fraction was found to be the most abundant, constituting about 45% of DOC. The THMFP and HANFP show that the DOM fraction with low MW and HiA was the dominant fraction and contributed more precursors. The EEM spectra indicated there were notable amounts of soluble microbial products and aromatic proteins in the >100 kDa fraction. Based on the results of the GC/MS analysis, nitriles, amines, nitrogenous heterocyclics, hydrocarbons, polycyclic aromatic hydrocarbons, esters, phenols, alcohol, ketones, and organic acids determined were as precursors in the <1 kDa fraction. Both precursors have functional groups with high chlorine reactivity, such as carboxylate salt COO–, aromatic structures C[double bond, length as m-dash]C, aldehydes and ketones groups C[double bond, length as m-dash]O, carbohydrates C–C and O-alky group C–O contributing greatly to the formation of disinfection by-production precursors.

1. Introduction

The steel industry generates various wastewaters during the manufacturing and processing of iron, and this is known as coking wastewater, which is very toxic and thus needs to be treated before being discharged into the environment. This wastewater is mostly generated from a cooling step after heating the coking coals to a high temperature (900–1100 °C) and the liquid-stripping step of the produced coke oven gas,1–3 which contains various toxic compounds such as ammonia, thiocyanide, cyanides, phenols, nitrogenous heterocyclic compounds and polycyclic aromatic hydrocarbons in a high concentration range.4 China has the largest coke production and exports in the world, with more than 40% of global coke output and more than 60% of global coke exports. This leads to the production of more than 200 million tons coking wastewater each year.5 The Chinese government issued the consultation of Technical Specifications for Coking Wastewater Treatment in 2010, which proposed that the treated coking wastewater should be preferred direct reused or recycled after thorough purification, with the aim of gradually achieving zero discharge of coking wastewater after treatment.6 Wastewater reuse is increasingly regarded as a potential water resource way to reduce pressure on existing water supplies. Most sewage treatment plants receive complex mixtures of urban and industrialized discharges. Even after secondary treatment, they still contain a large amount of dissolved organic matter (DOM), which serves as a precursor in the chlorination process and can lead to the formation of potentially harmful disinfection by-products (DBPs) including trihalomethanes (THMs), haloacetonitriles (HANs).7–9 The chemical characteristics of DOM are thought to significantly influence the chlorine consumption and formation of DBPs. Therefore, the effects of the characteristics of DOM in the discharge of coking wastewater treatment plant with regard to the formation of DBPs are an issue that requires more research.

Compared with natural water, the compositions of DOM in biologically treated coking wastewater are more complex and distinct, containing a heterogeneous mixture of synthetic organic chemicals produced during coking production, as well as soluble microbial products. The reactions that occur between chlorine and DOM during wastewater chlorination are significantly more complex than those that occur during chlorine disinfection of drinking water.10,11 As a result, fractionation of DOM is required to better understand the formation of DBPs in biologically treated wastewater during the chlorine disinfection process. Resin isolation is the currently most common method for the fractionation of DOM in biologically treated wastewater.12 Different resins can fractionate DOM into various components (e.g. hydrophobic and hydrophilic fractions) that meet specific research needs based on the chemical properties of DOM. About 90% of the DOM in the water tested in most studies was recovered by using the resin adsorption method.13 An ultra-filtration (UF) membrane is commonly used to fraction and measure DOM by molecular weight distribution, with UF separation being more efficient than resin adsorption with regard to this.14 The strong acidic and basic treatment required in the resin adsorption process may change the characteristics of DOM and result in hydrolysis and other reactions.15 Therefore, combining with resin adsorption and UF separation in the fractionation of DOM is a better method of realizing the characteristics of DOM. The relationship between the formation of THMs or HANs and chlorine kinetics with regard to DOM molecular size during the chlorine disinfection of natural water or municipal wastewater has been widely investigated in previous research.16–18 However, few studies examine the role of DOM molecular size in the formation DBPs during the chlorination of biologically treated industrial wastewater.

The characteristics of DOM, such as the amount of dissolved organic carbon (DOC), ultraviolet absorbance at 254 nm (UV254), specific UV absorbance (SUVA), excitation emission matrix (EEM), fluorescence regional integration (FRI), molecular weight and hydrophobicity have been studied in water and wastewater from different sources.19–22 In order to determine the chlorination of DBP precursors in each fraction, it is better to apply the method of gas chromatography-mass spectrometry (GC-MS) after separating them. However, the chemical compounds in coking wastewater discharge are very small, complicated and numerous. Solid phase extraction is a simple and convenient sample pre-treatment technology, which integrates the extraction and enrichment of organic from wastewater. It has been applied in micro-organic pollution detection in relation to PCBs and PAHs in different environmental media.3,6 Silica column chromatography can collect different polarities of organic compounds according to the different eluents, and is suitable for use with complex coking wastewater discharge. It is therefore necessary to establish a solid phase extraction, silica column chromatography and GC-MS analysis method to determine the DBPs precursors in coking wastewater, in order to obtain detail of the chemical composition and the general concentration levels in it.

The main objective of the present study was thus to investigate the characteristics of DOM in coking wastewater discharge, the associations of these with the formation of THMs and HANs, and the identification of DBPs precursors. Fractionation of the coking wastewater discharge was conducted by using UF separation and resin adsorption in turn. Dissolved organic matter (DOC), UV254 and EEM were then used to quantify NOM in each part of the fractionated samples. After chlorination, THMs and HANs were analyzed in the solutions, and the links between DBPs and NOM were further examined. Moreover, the organic components with the highest disinfection by-product formation potential were detected by GC-MS. The results can provide important information with regard to the new DBPs precursors and their reactivity in relation to the formation of DBPs.

2. Material and methods

2.1 Wastewater samples

Wastewater samples were collected from a coking wastewater treatment plant at Songshan coking plant in Shanguan, Guangdong Province of China, with an average treatment capacity of 2000 m3 day−1. The plant has primary treatment process that includes a flotation-degreasing tank and an equalization basin, an anoxic–oxic–oxic system coupled with a biological fluidized bed, a biological aerated filter and coagulation. The coking wastewater consists of distilled ammonia wastewater, desulfurization waste solution and domestic wastewater. The monthly average characteristics of the coking wastewater discharge are listed in Table 1.
Table 1 Main physical and chemical properties of coking wastewater discharge in this plant
Parameter Concentration (mean) Unit
Temperature 24 ± 2 °C
pH 7.4 ± 0.3  
CODCr 84.6 ± 5.4 mg L−1
TOC 32.1 ± 2.6 mg L−1
BOD5 7.65 ± 0.81 mg L−1
NH4–N 4.51 ± 1.25 mg L−1
CN 0.046 ± 0.005 mg L−1
NO3 151.2 ± 5.6 mg L−1
SO42− 0.84 ± 0.08 mg L−1
PO43− 0.32 ± 0.04 mg L−1
S2− 0.14 ± 0.02 mg L−1
F 41.6 ± 1.8 mg L−1
Cl 681.2 ± 5.9 mg L−1
Br 15.05 ± 1.6 mg L−1
I 5.12 ± 0.7 mg L−1
Ca2+ 90.82 ± 3.64 mg L−1
Mg2+ 7.59 ± 1.52 mg L−1
Na+ 1135.2 ± 8.69 mg L−1
Conductivity 3.35 ± 0.68 mS cm−1
Turbidity 32.5 ± 2.65 NTU
Chroma 40 ± 5  
Redox potential (mV) −23 ± 1 mV
Suspended solids 1.845 ± 0.36 mg L−1


2.2 Molecular weight fractionation

The raw water was filtered through a 0.45 μm cellulose membrane (Sinopharm) in order to obtain the dissolved organic matter (DOM). The DOM was fractionated using six types of regenerated cellulose membranes (Millipore Corp): (1) 100[thin space (1/6-em)]000 nominal molecular weight limit (NWML), (2) 30[thin space (1/6-em)]000 NWML, (3) 10[thin space (1/6-em)]000 NWML, (4) 5000 NWML (5) 3000 NWML, and (6) 1000 NWML. The effective surface area of the membrane was 31.75 cm2. Prior to filtration, Milli-Q water was passed through the membranes to remove any possible leached organics until the amount of DOC in the permeate was less than 0.1 mg L−1. High purity nitrogen (99.999%) was used to pressurize the filtration process (∼0.15 MPa). The initial sample volume was 500 mL. After 400 mL of sample volume permeated the membrane, the remaining 100 mL was collected for analysis. The percentages of DOC in each size range were calculated as follows:
 
image file: c5ra04930j-t1.tif(1)
 
image file: c5ra04930j-t2.tif(2)
 
image file: c5ra04930j-t3.tif(3)
 
image file: c5ra04930j-t4.tif(4)
 
image file: c5ra04930j-t5.tif(5)
 
image file: c5ra04930j-t6.tif(6)
 
image file: c5ra04930j-t7.tif(7)
Craw: the concentration of DOC in the raw water, CnkDa: the concentration of DOC in each size range (Fig. 1).

image file: c5ra04930j-f1.tif
Fig. 1 A schematic program for determination of molecular weight cut-off (MCE: Mixed Cellulose Esters; PLHK: Ultracel Millipore 100 kDa; PLTK: Ultracel Millipore 30 kDa; PLGC: Ultracel Millipore 10 kDa; PLCC: Ultracel Millipore 5 kDa; PLBC: Ultracel Millipore 3 kDa; PLAC Ultracel Millipore 1 kDa).

2.3 Hydrophilic/hydrophobic components fractionation

After UF separation of DOM, the adsorbent resin method was followed to use in DOM fractionation. In this, adsorbent resins (Amberlite XAD-8 nonionic resin, Dowex 50WX2 H+ cation exchange resin and Amberlite IRA-900(Cl) anion exchange resin) were used to separate the water-soluble organic substances into six groups: hydrophobic acids (HoA), hydrophobic neutrals (HoN), hydrophobic bases (HoB), hydrophilic acids (HiA), hydrophilic neutrals (HiN), and hydrophilic bases (HiB). The XAD-8 resin, Dowex 50WX2 H+ cation exchange resin and Amberlite IRA-900(Cl) anion exchange resin were Soxhlet-extracted with methanol for 24 h. The Amberlite IRA-900(Cl) anion exchange resin was then converted into a free-base-form with 1 M NaOH and rinsed with Milli-Q water until the pH of the resin slurry was approximately neutral. Five milliliters (wet volume) of the XAD-8 resin was packed into a glass column and rinsed three times, alternating 0.1 M NaOH with 0.1 M HCl each time, and then rinsed with about 200 mL of Milli-Q water just before sample application. Glass columns containing 5 mL (wet volume) of the cation and anion resins were connected in series and conditioned by pumping Milli-Q water through the resins. Blank samples were taken from each column after conditioning. A flow chart of the DOM fractionation procedure is shown in Fig. 2, and this included the following steps. (1) passing 200 mL of the filtrate through the XAD-8 column at a flow rate of about 1 mL min−1, and rinsing the column with two bed volumes of 0.1 M HCl (HoB); (2) acidifying the filtrate to pH 2.0, pumping it from the XAD-8 column through the series of cation and anion resin columns at a flow rate of about 1 mL min−1, and eluting the column with more than three bed volumes of 0.1 M NaOH at a flow rate not exceeding 0.5 mL min−1 (HoA, HiB and HiA in sequence); (3) the effluent from the series resins columns was HiN, while HoN was adsorbed in XAD-8.
image file: c5ra04930j-f2.tif
Fig. 2 A flow chart of the DOM fractionation procedure by resin adsorption.

2.4 Reagent and analytical methods

THMs and HANs were chosen as typical C-DBP and N-DBP for coking wastewater discharge disinfection respectively. Most information about DBP yields from specific precursors comes from laboratory-based formation potential (FP) tests using activated compounds, such as example NaClO.23 These tests are designed to maximize DBP formation and so use an excess of disinfectant, and they typically consider a contact times of seven days, temperatures of 25 °C and pH 7.0. DBPFP tests will overestimate DBPs relative to the same precursors exposed to lower disinfectant concentrations, disinfectant contact times, and temperatures.24 DBPFP can thus reveal almost the whole activity of each fractioned sample.

The THMs and HANs in Table 2 were generated during pre-chlorination and disinfection by the reaction between chlorine and some DOM. The concentration of these organic precursors could be determined as THMFP and HANFP. THMs and HANs were analyzed in accordance with EPA method 551 (USEPA Methods 551.1).25 NaClO (analytical reagent) was used as the disinfection agent in the THMFP and HANFP measured process. All samples were buffered to pH 7.2 with a phosphate buffer before chlorination at m(Cl2)[thin space (1/6-em)]:[thin space (1/6-em)]m(DOC) = 10(DOC calculation with C). All chlorinated samples were stored headspace-free in the dark, at room temperature (25 ± 1 °C) and underwent seven days reaction time. A series of aqueous DBPs standards was generated by adding a range of volumes of the stock solutions to Milli-Q water. A blank (0 g L−1 as DBPs standards) of Milli-Q water was included in the development of all standard curves. Under the assumption of linear response behavior, the regression analyses always yielded R2 > 0.99.

Table 2 The species of tested THMs and HANs
DBPs Formula Name Analytical method
Trihalomethanes (THMs) CHCl3 Chloroform (TCM) USEPA Methods 551.1
CHCl3Br Bromodichloromethane (BDCM)
CHBr2Cl Dibromochloromethane (DBCM)
CHBr3 Bromoform (TBM)
Haloacetonitriles (HANs) CCl3C[triple bond, length as m-dash]N Trichloroacetonitrile (TCAN)
CCl2C[triple bond, length as m-dash]N Dichloroacetonitrile (DCAN)
CHBrClC[triple bond, length as m-dash]N Bromochloroacetonitrile (BCAN)
CBr2C[triple bond, length as m-dash]N Dibromoacetonitrile (DBAN)


GC-MS analysis: based on the contents and concentrations of the organic compounds, 1000 mL of fractionation was extracted onto C18 cartridges (Spherigel). The aqueous extract was loaded onto a 1[thin space (1/6-em)]:[thin space (1/6-em)]2 alumina/silica gel glass column with 1 g of anhydrous sodium sulfate overlaying the silica gel for clean-up and fractionation. First, 15 mL of hexane was applied to remove aliphatic hydrocarbons. The eluents containing medium polarity compounds were then collected by eluting 70 mL of dichloromethane/hexane (3[thin space (1/6-em)]:[thin space (1/6-em)]7, v/v). Finally, the polar compounds were eluted with 30 mL methanol and all eluents were concentrated to 0.5 mL under a gentle stream of purified N2. The samples were analyzed by GC/MS (Agilent, 7890A-5973C) with a 30 m × 0.25 mm i.d. × 0.25 μm film thickness HP-5 MS fused silica capillary column in selected ion mode. Before sample injection, the polar compounds underwent a derivatization by N,O-bis(trimethylsilyl)trifluoroacetamide (BSTFA). The steps used in the derivatization are introduced briefly as follows. First, 2.0 mL of an extract was transferred to a 10 mL glass tube (KiMAX, USA) with a polytetrafluoroethylene screw cap. 2.0 mL saturated NaCl aqueous solution was added to the tube, and the solution pH was regulated to < 2. 4.0 mL of dichloromethane was added to the tube, and the tube was tightly capped and manually shaken vigorously for 5 min, then left at the room temperature for 10 min. The dichloromethane phase was then carefully transferred to a 10.0 mL glass centrifugal tube using a glass pipette. Another 4.0 mL of dichloromethane was added to the 10.0 mL tube, which was manually shaken for 5 min. After separation, the dichloromethane was transferred to the 10.0 mL glass centrifugal tube and combined with the previous sample. The dichloromethane was then dried under a gentle nitrogen stream. The final extract was re-dissolved in 200 μL of acetone, which was transferred to a 2.0 amber glass vial. Then 50 μL of 10% pyridine in toluene and 50 μL of 2% BSTFA were added into the amber glass vial in sequence, and the vial was left at room temperature for 1 h. Finally, the samples were ready for GC-MS analysis. The GC/MS conditions for sample analysis were as follow: the injection port, interface line and ion source temperature were maintained at 280, 290 and 250 °C, respectively. The column temperature was programmed from 60 to 310 °C at 5 °C min−1 and held for 10 min. Helium was the carrier gas at a flow of 1.2 mL min−1 with a linear velocity of 42.4 cm s−1. The mass spectrometer was operated in electron impact ionization mode (70 eV). 1 μL volume of each sample was injected in the split mode; the split ratio was 10[thin space (1/6-em)]:[thin space (1/6-em)]1.

DOC measurements were conducted as non-purgeable DOC with a Shimadzu TOC-VCPH. At least three measurements were made for each sample. Ultraviolet (UV) absorbance was measured with a Shimadzu UV-2500 UV-vis spectrometer at 254 nm using a quartz cell with a 1 cm path length. There-dimensional EEM spectroscopy (HITACHI F-7000 FL, 5J1-004, Japan) was also applied to characterize the organic compounds. The pH value was measured with a pH meter (pHS-3C, China).

EEM fluorescence spectra were recorded using a Hitachi F-7000 fluorescence spectrometer (Hitachi High-Technologies, Tokyo, Japan). Excitation (Ex) and emission (Em) slit widths were set to 5 nm and PMT voltage to 400 V with scanning speed at 1200 nm min−1. The Em was determined every 5 nm from 280 to 550 nm, while the Ex region was set every 2 nm from 200 to 450 nm. Before analysis, the Raman scattering and Rayleigh scatter effects should be removed.26

3. Results and discussion

3.1 SUVA and TOC of different molecular fraction of the coking wastewater discharge

Although the quality of coking wastewater discharge can meet the national discharge standards (GB 12356-2012),27 some organic components still exist in it, including phenols, amines, and nitrogen heterocyclic, which have high levels of activity in the disinfection process. In our best knowledge, DOM act as a group of DBP precursors, and SUVA is defined as UV254 by DOC, which can be a useful indicator for the characteristics of DOM. A low SUVA value implies the water contains few aromatic carbons and is more hydrophilic.28,29 The raw water samples from the coking wastewater treatment plant were filtered through a series of UF membranes to characterize the DOM species in each size fraction. TOC and UV254 were also measured at the same time. Fig. 3 shows the TOC and SUVA compositions in each of the MW factions. Based on the TOC data, the MW factions of >100 k, 30–100 k, 10–30 k, 5–10 k, 3–5 k, 1–3 k and <1 kDa were 1.7, 1.6, 3.0, 2.7, 2.5, 4.5 and 20.1 mg L−1, respectively. Given that the MW fractions of <1 kDa accounted for approximately 55.7% of the total TOC concentrations, it was concluded that the most of the TOC present in coking wastewater discharge was composed of small molecules. Moreover, the percentage of SUVA was slightly lower in the <1 kDa fraction of the sample than other factions. The highest SUVA was found in the >100 kDa faction at 12.1 L mg−1 cm−1. The lower MW fractions (5–10 k, 3–5 k, 1–3 k and <1 kDa) had similar SUVA about 4.1 L mg−1 cm−1. The DOM in coking wastewater had different components, even though the total DOC concentration in each of the water samples was approximately the same. It can thus be concluded that some hydrophobic, aromatic and unsaturated organic matter existed in the >100 kDa fraction, like extracellular polymers and microorganism metabolites. The high TOC of the <1 kDa fraction showed that a variety of organic compounds still remained in the coking wastewater. Both the >100 kDa and the <1 kDa fractions could have high levels of activity with regard to DBP generation.
image file: c5ra04930j-f3.tif
Fig. 3 TOC and SUVA254 of different molecular weight fractions of treated coking wastewater discharge.

3.2 Hydrophilic and hydrophobic fractions of DOM

Using UF membrane and resin separation fractionation, 42 fractions were chosen to show the characteristics of DOM. Fig. 4 presents the results of distribution of hydrophilic and hydrophobic fractions in the DOC of the coking wastewater discharge. The fraction of hydrophilic DOM was higher than that of hydrophobic DOM in different molecular weight distributions. In particular, the HiA fraction was found to be the most abundant fraction, constituting about 45% of DOC. HiN was the second most dominant fraction, accounting for about 15%. The amount of HoB and HoN were similar, at about 4%, the lowest of all the fractions. The amount of AHS fell gradually along with the molecular weight. The DOM-fraction distribution varies significantly depending on the kind of wastewater and type of treatment process. In this study it was found that the percentage of hydrophilic organic compounds was higher than that of the hydrophobic organic compounds, and the acid part was the most common among the fractions. This may be because a large amount of hydrophobic organic matter was degraded by microorganisms or adsorbed during the activated sludge process.22 On the other hand, microbial aerobic respiration could produce some carboxylic acid and alcohol, leading to a more acid in the coking wastewater discharge.30
image file: c5ra04930j-f4.tif
Fig. 4 The distribution of hydrophilic and hydrophobic fractions in the DOC of coking wastewater discharge.

3.3 THMs and HANs formation potentials (THMFP and HANFP) of DOM fractions

In order to investigate the reactivity with chlorine on a per carbon basis, all the DBPs data were normalized relative to the DOM concentrations to obtain the specific yields. In this study, DBP yields were determined for two types of halogenated DBPs, namely, THMs and HANs, using chlorination. Fig. 5 shows the THMFP and HANFP in each fraction by different molecular weights and degrees of hydrophobicity of coking wastewater discharge. There were only three THM species formed in each fraction during the chlorination experiments, namely, chloroform, biomodichloromethane, and dibromochloromethane. The concentration of biomoform was below the detection limit, which is consistent with the results of earlier research. The MW fraction of <1 kDa contained the maximum concentration of THMFP (7.01 mol THM: mmol C, i.e., 53.9% of the total THMFP), and the >30, 5–30, 1–5 and <1 kDa, fractions contained steadily decreasing concentrations of THMFP. The results indicates that DOM with <1 kDa is a dominant factor in the formation of THMs during the chlorination process. According to the levels of hydrophobicity, the HiA fraction contained the maximum concentration of THMFP (4.31 mol THM: mmol C, i.e., 89.9% of the total THMFP), and the HiN, HiB, AHS, HoN and HoB, fractions contained decreasing concentrations of THMFP. The results indicate that HiA is also a dominant factor in the formation of THMs, which was also found in the work of Chang.31 Generally, high MW fractions contain more aliphatic groups in surface water, whereas low MW fractions contain more aromatic and carboxyl groups, which are more reactive to the formation of THMs during chlorination. The small size DOM in treated coking wastewater was more reactive to form THMs in the disinfection process. It was found that HiN contained relatively more humic acid and thus had greater chlorine reactivity.
image file: c5ra04930j-f5.tif
Fig. 5 Distribution of DBPFP with weight and hydrophobicity (a) THMs, (b) HANs. (Cl2 dose = 10[thin space (1/6-em)]:[thin space (1/6-em)]1, temperature = 25 °C, reaction time = 7d).

In the HANFP experiments, four HAN species were detected, i.e., trichloroacetonitrile, dichloroacetonitrile, bromochloroacetonitrile and dibromoacetonitrile. Similar to the distribution of THMFP, the <1 kDa MW fraction contained most of the HANFP, followed by the >30, 5–30, 1–5 and <1 kDa fractions in decreasing order. The HiA fraction is more reactive with regard to the formation of dichloroacetonitrile than other HANs, which have the same level of reactivity as each other. It has been reported that HANs are produced from the chlorination of selected free amino acids, heterocyclic nitrogen in nucleic acids, proteinaceous materials, and combined amino acids bound to humic structures.17 A low MW and hydrophilic fraction, like nitrile or aldehyde, can act as HANs' precursors.

In terms of controlling DBPs in the chlorination process, the results of DBPFP in each fraction in this study pose a challenge to plant designers, because most of the currently employed physical and chemical treatment processes are not capable of removing low MW and hydrophilic organics effectively.

3.4 Analysis of Br-DBPFP for different fractions of treated coking wastewater

Bromide ions are nearly ubiquitous in coking wastewater discharge, and chlorine can rapidly oxidize bromide ions in the waters to form bromine during the chlorination process. Bromine and chlorine are active oxidants that react with organic matter to produce halogenated DBPs. Bromine is a more efficient substituting agent than chlorine, as it participates in more oxidation reactions. Bromide concentrations thus have a significant impact on the formation and speciation of DBPs. The formation of DBPs shifts to more brominated species as the bromide concentration increase.32 The percentages of Br-DBPFP for each fraction of coking wastewater discharge are shown in Fig. 6. With regard to the molecular weight distribution, bromine DBPs are readily generated with a low molecular weight of organic matter. Acidic organic matters are more reactive than alkaline compounds with regard to bromine DBPs. For the hydrophobic fraction, the THMs and HANs concentration percentages show the different distributions, with the concentration percentage of the THMs components after chlorination being in the order of HiA > HoA > HiB > HoB > HiN > HoN. The concentration percentage of the HANs after chlorination was in the order of HoA > HoB > HiA > HoN > HiN > HiB. Compared to THMFP, the proportion of Br-HANs is higher, mainly because a certain amount of organic nitrogen compounds with unsaturated bonds exist in coking wastewater discharge. The formation of Br-DBP is related to characteristics such as molecular weight, hydrophobicity and chemical structure.
image file: c5ra04930j-f6.tif
Fig. 6 Percentages of Br-DBPFP for different fractions of treated coking wastewater (Cl2 dose = 10[thin space (1/6-em)]:[thin space (1/6-em)]1, temperature = 25 °C, reaction time = 7d).

3.5 3D EEM of molecular weight distribution

Previous studies demonstrated that treated wastewater effluent contained residual DOM present in drinking water, soluble microbial products contributed during biological sludge treatment and refractory DOM added by water users. In order to trace the source of DOM and investigate the chemicals contributing to DBPs, excitation emission matrices (EEM) were used to characterize different DOM fractions.20 The contour maps of the results showed that different molecular weight fractions exhibited different peaks (Fig. 7). The fluorescence intensity corresponding to the peaks are shown in Table 3. The DOM of treated coking wastewater (>100 kDa) has three peaks, namely Ex/Em = 280/370 of fluorescence intensity 3415 a.u, Ex/Em = 330/380 of fluorescence intensity 1755 a.u and Ex/Em = 250/450 of fluorescence intensity 1688 a.u. Humic/fulvic acid, aromatic proteins and some other soluble microbial by-products, such as protein-like or phenol-like organics were found in the DOM fractions. After intercepting the molecular weight of 100 kDa using membrane ultrafiltration, the emission wavelength of the peak 280/370 redshifted by 50 nm, and at the same time, the strength weakened by 49%. The area of solution fluorescent microbial metabolites has no fluorescence peak. Other molecular weights <100, <30, <10, <5, and <1 kDa have the same peaks. The results thus show that the soluble metabolic product is an important part of treated coking wastewater in the >100 kDa molecular weight fraction. The same fluorescence structures or organisms are also found in other fraction, which leads to the phenomenon of peak overlapping. The fluorescence substance in the <1 kDa fraction thus needs to further analysis.
image file: c5ra04930j-f7.tif
Fig. 7 3D EEMs of the molecular weight distribution in the control samples.
Table 3 Analysis of 3DEEMs for molecular weight distribution
Molecular weight distribution Peak A/A′ Peak B/B′ Peak C
Ex/Em/nm Fluorescence intensity/a.u Ex/Em/nm Fluorescence intensity/a.u Ex/Em/nm Fluorescence intensity/a.u
>100 kDa 280/370 3415 330/380 1755 250/450 1688
<100 kDa 280/420 1146 320/420 1369 250/450 1168
<30 kDa 280/420 1178 320/420 1400 250/450 1196
<10 kDa 280/420 1227 320/420 1455 250/450 1258
<5 kDa 280/420 1411 320/420 1586 250/450 1549
<1 kDa 280/420 1668 320/420 1748 250/450 1940


3.6 Precursors of THMs and HANs in treated coking wastewater by GC-MS

Many studies have shown that DOC and DON serve as the main reactive precursors for DBP formation, and although much information has been obtained on this, such as the related structural characteristics, the detailed organic compounds of DOC and DON still need to be determined. Such knowledge would help in developing a more effective and economical approach to control these precursors when treating coking wastewater. Fig. 8 shows the chromatogram of the <1 kDa molecule weight fraction. About 10 classes and 92 species were found in this fraction, including nitriles, amines, nitrogenous heterocyclic, hydrocarbons, polycyclic aromatic hydrocarbons, esters, phenols, alcohol, ketones, and organic acids, as shown in Table S1. In general, previous studies have identified a number of precursors which produce high levels of THMs and HANs.33 The most striking examples are carboxylic acids functional groups, amino acids, proteins, polypeptide, and carbohydrates. In contrast to coking wastewater discharge, nitrogenous heterocyclic and phenols would serves as new DBPs precursors. Schematics of the THMs and HANs formation pathways are showed in Fig. 9.28,34–36 It can be seen that the chlorine substitution reaction, chloride addition reaction, decarboxylic reaction, and dehydration reaction are the most important steps. In each fraction, both hydrophobic and hydrophobic organics have high chlorine reactivity with regard to the functional groups, such as carboxylate salt COO–, aromatic structures C[double bond, length as m-dash]C, aldehydes and ketones groups C[double bond, length as m-dash]O, carbohydrates C–C or O-alky group C–O. It is thus necessary to develop an appropriate technology if coking wastewater discharge is to be reused or released to surface water.
image file: c5ra04930j-f8.tif
Fig. 8 GC-MS chromatogram of <1 kDa molecule weight fraction by polarity (from top to bottom: non polarity, mid polarity and polarity).

image file: c5ra04930j-f9.tif
Fig. 9 Schematics of the THMs and HANs formation pathways.

4. Conclusions

DOM in the effluent from a coking wastewater treatment plant was fractionated using molecular weight and then divided based on resin adsorption into 42 classes. The DOM-fraction distribution, SUVA, source, molecular weight and chemical structure of the precursors were found to influence the formation of DBPs to a significant extent. Some new precursors were identified in coking wastewater discharge. The highest SUVA was found in the >100 kDa faction, at 12.1 L mg−1 cm−1. The lower MW fractions (5–10 k, 3–5 k, 1–3 k and <1 kDa) had similar characteristics of SUVA, at about 4.1 L mg−1 cm−1. The HiA fraction was found to be the most abundant, constituting about 45% of DOC. The THMFP and HANFP results showed that the DOM fraction with low MW and HiA was the dominant fraction and contributed more precursors. The EEM spectra indicated there were significant amounts of soluble microbial products and aromatic proteins in the >100 kDa fraction. The results of GC/MS analysis showed that nitriles, amines, nitrogenous heterocyclic, hydrocarbons, polycyclic aromatic hydrocarbons, esters, phenols, alcohol, ketones, and organic acids were the precursors in the <1 kDa fraction. All of these have high chlorine reactivity with regard to the functional groups, such as carboxylate salt COO–, aromatic structures C[double bond, length as m-dash]C, aldehydes and ketones groups C[double bond, length as m-dash]O, carbohydrates C–C or O-alky group C–O, which all contribute significantly to the formation of DBPs.

Abbreviations

THMFPTrihalomethane formation potential
HANFPHaloacetonitrile formation potential
EEMFluorescence excitation-emission matrix
DOMDissolved organic matter
UFUltra-filtration
SUVASpecific UV absorbance
NWMLNominal molecular weight limit
HoAHydrophobic acids
HoNHydrophobic neutrals
HoBHydrophobic bases
HiAHydrophilic acids
HiNHydrophilic neutrals
HiBHydrophilic bases

Acknowledgements

This research was supported by the Fundamental Research Funds for the Central Universities (2013ZP0009) and the Key Program of National Natural Science Foundation of China (21037001); Research Project of Production, Education and Research of Guangdong Province, China (2012B091100450).

References

  1. G. H. Jefferson, China's iron and steel industry: sources of enterprise efficiency and the impact of reform, J. Dev. Econ., 1990, 33(2), 329–355 CrossRef.
  2. E. Worrell, L. Price and N. Martin, et al., Energy intensity in the iron and steel industry: a comparison of physical and economic indicators, Energy Policy, 1997, 25(7), 727–744 CrossRef.
  3. W. Zhang, C. Wei and X. Chai, et al., The behaviors and fate of polycyclic aromatic hydrocarbons (PAHs) in a coking wastewater treatment plant, Chemosphere, 2012, 88(2), 174–182 CrossRef CAS PubMed.
  4. Y. Chenglong, S. Zhongjian and Z. Jinzhi, Problems and Solutions of Wastewater Treatment of Coking Plant, Water & Wastewater Engineering, 2000, 6, 10 Search PubMed.
  5. L. A. Price, Comparison of Iron and Steel Production Energy Intensity in China and the US, ACEEE Industrial Summer Study, New York, USA, July 2011, p. 2014 Search PubMed.
  6. C. Lin, W. Zhang and M. Yuan, et al., Degradation of polycyclic aromatic hydrocarbons in a coking wastewater treatment plant residual by an O3/ultraviolet fluidized bed reactor, Environ. Sci. Pollut. Res., 2014, 1–10 Search PubMed.
  7. T. Bond, E. H. Goslan and S. A. Parsons, et al., A critical review of trihalomethane and haloacetic acid formation from natural organic matter surrogates, Environ. Technol. Rev., 2012, 1(1), 93–113 CrossRef CAS PubMed.
  8. C. M. Bougeard, E. H. Goslan and B. Jefferson, et al., Comparison of the disinfection by-product formation potential of treated waters exposed to chlorine and monochloramine, Water Res., 2010, 44(3), 729–740 CrossRef CAS PubMed.
  9. B. Chen, S. Nam and P. K. Westerhoff, et al., Fate of effluent organic matter and DBP precursors in an effluent-dominated river: a case study of wastewater impact on downstream water quality, Water Res., 2009, 43(6), 1755–1765 CrossRef CAS PubMed.
  10. T. Bond, J. Huang and M. R. Templeton, et al., Occurrence and control of nitrogenous disinfection by-products in drinking water–a review, Water Res., 2011, 45(15), 4341–4354 CrossRef CAS PubMed.
  11. L. Liang and P. C. Singer, Factors influencing the formation and relative distribution of haloacetic acids and trihalomethanes in drinking water, Environ. Sci. Technol., 2003, 37(13), 2920–2928 CrossRef CAS.
  12. S. W. Krasner, P. Westerhoff and B. Chen, et al., Impact of wastewater treatment processes on organic carbon, organic nitrogen, and DBP precursors in effluent organic matter, Environ. Sci. Technol., 2009, 43(8), 2911–2918 CrossRef CAS.
  13. T. H. Boyer and P. C. Singer, Bench-scale testing of a magnetic ion exchange resin for removal of disinfection by-product precursors, Water Res., 2005, 39(7), 1265–1276 CrossRef CAS PubMed.
  14. C. Chen, X. Zhang and L. Zhu, et al., Disinfection by-products and their precursors in a water treatment plant in North China: seasonal changes and fraction analysis, Sci. Total Environ., 2008, 397(1), 140–147 CAS.
  15. S. Navalon, M. Alvaro and H. Garcia, Carbohydrates as trihalomethanes precursors. Influence of pH and the presence of Cl and Br on trihalomethane formation potential, Water Res., 2008, 42(14), 3990–4000 CrossRef CAS PubMed.
  16. G. Hua and D. A. Reckhow, Characterization of disinfection byproduct precursors based on hydrophobicity and molecular size, Environ. Sci. Technol., 2007, 41(9), 3309–3315 CrossRef CAS.
  17. T. F. Marhaba, A. Mangmeechai and C. Chaiwatpongsakorn, et al., Trihalomethanes formation potential of shrimp farm effluents, J. Hazard. Mater., 2006, 136(2), 151–163 CrossRef CAS PubMed.
  18. Z. Zhao, J. Gu and X. Fan, et al., Molecular size distribution of dissolved organic matter in water of the Pearl River and trihalomethane formation characteristics with chlorine and chlorine dioxide treatments, J. Hazard. Mater., 2006, 134(1), 60–66 CrossRef CAS PubMed.
  19. N. Ates, M. Kitis and U. Yetis, Formation of chlorination by-products in waters with low SUVA—correlations with SUVA and differential UV spectroscopy, Water Res., 2007, 41(18), 4139–4148 CrossRef CAS PubMed.
  20. R. Hao, H. Ren and J. Li, et al., Use of three-dimensional excitation and emission matrix fluorescence spectroscopy for predicting the disinfection by-product formation potential of reclaimed water, Water Res., 2012, 46(17), 5765–5776 CrossRef CAS PubMed.
  21. H. Kim and M. Yu, Characterization of natural organic matter in conventional water treatment processes for selection of treatment processes focused on DBPs control, Water Res., 2005, 39(19), 4779–4789 CrossRef CAS PubMed.
  22. H. Zhang, J. Qu and H. Liu, et al., Characterization of isolated fractions of dissolved organic matter from sewage treatment plant and the related disinfection by-products formation potential, J. Hazard. Mater., 2009, 164(2), 1433–1438 CrossRef CAS PubMed.
  23. H. Huang, Q. Wu and H. Hu, et al., Dichloroacetonitrile and dichloroacetamide can form independently during chlorination and chloramination of drinking waters, model organic matters, and wastewater effluents, Environ. Sci. Technol., 2012, 46(19), 10624–10631 CrossRef CAS PubMed.
  24. F. J. Díaz, A. T. Chow and A. T. O Geen, et al., Restored wetlands as a source of disinfection byproduct precursors, Environ. Sci. Technol., 2008, 42(16), 5992–5997 CrossRef.
  25. The US Environmental Protection Agency method 551.1.
  26. H. Ou, C. Wei and C. Mo, et al., Novel insights into anoxic/aerobic1/aerobic2 biological fluidized-bed system for coke wastewater treatment by fluorescence excitation–emission matrix spectra coupled with parallel factor analysis, Chemosphere, 2014, 113, 158–164 CrossRef CAS PubMed.
  27. The national discharged standards of China. GB 12356–2012.
  28. S. D. Boyce and J. F. Hornig, Reaction pathways of trihalomethane formation from the halogenation of dihydroxyaromatic model compounds for humic acid, Environ. Sci. Technol., 1983, 17(4), 202–211 CrossRef CAS PubMed.
  29. T. Sirivedhin and K. A. Gray, Comparison of the disinfection by-product formation potentials between a wastewater effluent and surface waters, Water Res., 2005, 39(6), 1025–1036 CrossRef CAS PubMed.
  30. J. Liu and X. Li, Biodegradation and biotransformation of wastewater organics as precursors of disinfection byproducts in water, Chemosphere, 2010, 81(9), 1075–1083 CrossRef CAS PubMed.
  31. H. Chang, C. Chen and G. Wang, Identification of potential nitrogenous organic precursors for C-, N-DBPs and characterization of their DBPs formation, Water Res., 2011, 45(12), 3753–3764 CrossRef CAS PubMed.
  32. Y. Sun, Q. Wu and H. Hu, et al., Effect of bromide on the formation of disinfection by-products during wastewater chlorination, Water Res., 2009, 43(9), 2391–2398 CrossRef CAS PubMed.
  33. Chu W. H., Gao N. Y., Yin D. Q., et al., A predictive model for the formation potential of dichloroacetamide, a nitrogenous disinfection by-product formed during chlorination[EB/OL]. [4], http://link.springer.com/10.1007/s13762-012-0104-0, http://www.springerlink.com/index/pdf/10.1007/s13762-012-0104-0.
  34. T. Bond, M. R. Templeton and N. Graham, Precursors of nitrogenous disinfection by-products in drinking water––a critical review and analysis, J. Hazard. Mater., 2012, 235, 1–16 CrossRef PubMed.
  35. M. Deborde and U. von Gunten, Reactions of chlorine with inorganic and organic compounds during water treatment—kinetics and mechanisms: a critical review, Water Res., 2008, 42(1), 13–51 CrossRef CAS PubMed.
  36. S. H. Joo and W. A. Mitch, Nitrile, aldehyde, and halonitroalkane formation during chlorination/chloramination of primary amines, Environ. Sci. Technol., 2007, 41(4), 1288–1296 CrossRef CAS.

Footnote

Electronic supplementary information (ESI) available: See DOI: 10.1039/c5ra04930j

This journal is © The Royal Society of Chemistry 2015
Click here to see how this site uses Cookies. View our privacy policy here.