Enhanced visible-light-driven photocatalytic performances using Bi2WO6/MS (M = Cd, Zn) heterostructures: facile synthesis and photocatalytic mechanisms†
Rongfeng Tang,
Huaifen Su,
Shengxia Duan,
Yuanwei Sun,
Lei Li,
Xianxi Zhang,
Suyuan Zeng* and
Dezhi Sun*
Shandong Provincial Key Laboratory of Chemical Energy Storage and Novel Cell Technology, Department of Chemistry and Chemical Engineering, Liaocheng University, Liaocheng 252059, China. E-mail: drzengsy@163.com; sundezhi@lcu.edu.cn; Fax: +86-635-8230196; Tel: +86-635-8230614
First published on 23rd April 2015
Abstract
The formation of type II heterostructures is proved to be an effective method to improve the photocatalytic performance of semiconductors. In this report, a surface functionalization method using 3-mercaptopropionic acid (MPA) as the surface functionalizing agent was adopted for the fabrication of Bi2WO6/MS (M = Cd and Zn) heterostructures. The composition and microstructures of the as-prepared heterostructures were characterized by X-ray diffraction (XRD), scanning electron microscopy (SEM), transmission electron microscopy (TEM), high-resolution TEM (HRTEM) and X-ray photoelectron spectroscopy (XPS). The as-prepared Bi2WO6/CdS and Bi2WO6/ZnS heterostructures exhibit enhanced photocatalytic activities for the degradation of Rhodamine B (Rh B) as compared to pure Bi2WO6, CdS, ZnS nanoparticles and Degussa P25. The enhanced photocatalytic activities of the as-prepared heterostructures may relate to the effective electron–hole separation during the photocatalytic process. A series of scavengers (benzoquinone for O2˙−, ammonium oxalate for h+, AgNO3 for e−, and t-BuOH for ˙OH) were employed to investigate the possible mechanism of the photocatalytic process. The results clearly indicate that the photogenerated holes are the main active species during the photocatalytic process.
1. Introduction
Photocatalysts for the degradation of organic pollutants using solar light energy have attracted increasing interest in the past few years because of the growing environmental concerns and energy demand.1–5 Compared with the traditional methods, semiconductor-based photocatalysis offers a greener route for the elimination of a variety of contaminants, especially for azo dyes.6 For this purpose, a great number of visible-light-driven photocatalysts have been successfully synthesized, which have been proved to be effective for the elimination of organic pollutants.7–12 Among these photocatalysts, Bi2WO6 has attracted increasing attention because of its excellent visible-light-driven photocatalytic activity. The unique layered structure of Bi2WO6 favors the charge transfer process and retards the recombination of holes and electrons during the photocatalytic process,13 making it an ideal candidate for the photo-degradation of organic pollutants. As a result, a variety of Bi2WO6 nano-structures with different morphologies including nest,14 flake-ball,15 disk,16 cage,17 flowers18–20 have been successfully prepared. Although these Bi2WO6 nanostructures have been found to display strong visible light response, the photocatalytic activity is expected to be further improved to satisfy the large-scale application under visible light irradiation. According to the previous reports, two formidable challenges still remain.21,22 One centers on the difficult migration and high recombination of photo-generated electron–hole pairs, which will greatly reduce the photocatalytic activity of Bi2WO6. A second entails its wide band gap, which severely precludes the employment of visible light with wavelength longer than ∼450 nm.It is widely believed that the coupling of two semiconductors is an effective way to enhance the photocatalytic performance, which would lead to a more efficient photoelectron–hole separation or expansion of the spectral absorption range.23,24 The electrons excited by the visible light would transfer from conduction band of semiconductor with low band gap to the conduction band of Bi2WO6, which will facilitate the charge separation and improve the visible-light photocatalytic activities of the heterostructures dramatically. As a result, a variety of Bi2WO6 based heterostructures have been successfully prepared, including Bi2WO6/WO3,25 Bi2WO6/Bi2S3,26 Bi2WO6/BiOBr,27 Bi2WO6/TiO2,28 Bi2WO6/Bi2O3![[thin space (1/6-em)]](https://www.rsc.org/images/entities/char_2009.gif) 29 and so on. All of these works clearly indicate that the coupling of another semiconductor is indeed an effective method to improve the photocatalytic activities of Bi2WO6. For example, Huang and co-workers have succeeded in the preparation of layered Bi2WO6/BiIO4 heterojunctions by a one-step hydrothermal preparation strategy. The degradation rate for Rh B was almost 34.4 and 4.1 times higher than the corresponding values of BiIO4 and Bi2WO6, respectively.30 Fu and co-workers have also reported the preparation of Bi2WO6/Ag3PO4 hierarchical heterostructures, whose degradation rate for phenol under visible light irradiation was about 1.7 and 1.1 times higher than pure Bi2WO6 and Ag3PO4, respectively.31 However, the synthesis of the Bi2WO6 based heterostructure is still a big challenge for the chemists, especially by a simple and economic method.
29 and so on. All of these works clearly indicate that the coupling of another semiconductor is indeed an effective method to improve the photocatalytic activities of Bi2WO6. For example, Huang and co-workers have succeeded in the preparation of layered Bi2WO6/BiIO4 heterojunctions by a one-step hydrothermal preparation strategy. The degradation rate for Rh B was almost 34.4 and 4.1 times higher than the corresponding values of BiIO4 and Bi2WO6, respectively.30 Fu and co-workers have also reported the preparation of Bi2WO6/Ag3PO4 hierarchical heterostructures, whose degradation rate for phenol under visible light irradiation was about 1.7 and 1.1 times higher than pure Bi2WO6 and Ag3PO4, respectively.31 However, the synthesis of the Bi2WO6 based heterostructure is still a big challenge for the chemists, especially by a simple and economic method.
Recently, the coupling of metal sulfides with other semiconductors has been found to be an effective route for the preparation of photocatalysts with high photocatalytic activities.32–37 Thus, it is speculated that the sensitization property of metal sulfides will be helpful in overcoming the drawbacks of Bi2WO6 and lead to the formation of highly efficient photocatalysts. In this study, two Bi2WO6 based heterostructure (Bi2WO6/CdS and Bi2WO6/ZnS) have been successfully prepared using a simple surface functionalization route. Evaluated by the degradation of Rhodamine B (Rh B), the as-formed Bi2WO6/MS (M = Cd and Zn) heterostructures exhibit enhanced photocatalytic activities for the degradation of Rh B under visible light irradiation. Based on experimental results and the band gap positions, a possible photodegradation mechanisms of these heterostructures were also systematically investigated.
2. Experimental section
2.1 Preparations of flower-like Bi2WO6
All the reagents were of analytical grades and used without further purification. Flower-like Bi2WO6 structures was prepared by a hydrothermal process as we have reported previously.38 In a typical process, 2 mmol Bi(NO3)3·5H2O and 1 mmol Na2WO4·2H2O were dissolved separately in 22.5 mL de-ionized water. Then, the two solutions were mixed under vigorous stirring. The resulting slurries were stirred for 30 min and then transferred into a 50 mL Teflon-lined autoclave. The autoclaves were maintained at 200 °C for 12 h and then cooled to room temperature naturally. The precipitates were collected by centrifugation, washed four times with deionized water and ethanol, and then dried at 60 °C for 6 h in vacuum.2.2 Preparations of Bi2WO6/CdS and Bi2WO6/ZnS heterostructures
For the growth of CdS and ZnS nanoparticles onto flower-like Bi2WO6 structures, a surface functionalization route using 3-mercaptopropionic acid (MPA) as the functionalizing agent was adopted.39 The synthetic process of Bi2WO6/CdS heterostructures is illustrated in Scheme 1. In a typical process, 20 μL of MPA was added to the suspension containing 1.0 g Bi2WO6. The suspension was stirred for 4 h at room temperature to complete the surface functionalization of the Bi2WO6 surfaces. Afterward, 0.1 g Cd(CH3COO)2·4H2O was added to the above suspension under constant magnetic stirring. After stirring for 2 h, 0.09 g of Na2S·9H2O was added slowly to the system and stirred constantly for 1 h at room temperature. The solution gradually turned to be faded yellow, which suggest the formation of Bi2WO6/CdS heterostructures, and the nominal content of CdS with respect to Bi2WO6 is about 23.4% (molar ratio). Subsequently, the resulting product was separated by centrifugation and washed repeatedly with water and absolute alcohol and then dried in vacuum at 60 °C for 6 h. As for the preparation of Bi2WO6/ZnS heterostructure, Cd(CH3COO)2·4H2O added in the second step was replaced by Zn(NO3)3·6H2O, keeping the other reactions conditions unchanged. By calculation, the nominal content of ZnS with respect to Bi2WO6 is about 23.5% (molar ratio).2.3 Preparations of CdS and ZnS nanoparticles
For comparison purpose, CdS and ZnS nanoparticles were prepared by a simple precipitation method. Take the synthesis of CdS nanoparticles for example, 1.0 g of Cd(CH3COO)2·4H2O was firstly dissolved in 40 mL of deionized water to form a transparent solution. In the next step, 0.9 g Na2S·9H2O was added into the above solution and stirred for 1 h at room temperature. Finally, the product was separated by centrifugation, washed repeatedly with deionizer water and ethanol and then dried at 60 °C for 6 h in vacuum. ZnS nanoparticles were synthesized by a similar process during which Zn(NO3)3·6H2O was used as the starting material.2.4 Sample characterizations
The phase and composition of the samples were characterized by X-ray powder diffraction (XRD) on a Philips X'Pert Pro Super diffractometer with Cu Kα radiation (λ = 1.5416 Å). The XRD pattern was recorded in the 2θ range of 10–70° with scan rate of 0.05° s−1. The S-4800 (Hitachi) field emission scanning electron microscope (FESEM) equipped with a GENESIS4000 energy dispersive X-ray spectroscope was applied to observe the size and morphology of the product. The transmission electron microscope (TEM) image was taken on a Hitachi H-7650 transmission microscope, using an accelerating voltage of 120 kV. High-resolution transmission electron microscopy (HRTEM) images were obtained on a JEOL-2010 TEM at an acceleration voltage of 200 kV. X-ray photoelectron spectroscopy (XPS) was recorded on Thermo ESCALAB 250 system with a monochromatic Al Kα source with 1486.6 eV of energy, 15 kV of voltage, and 150 W of power. The Brunauer–Emmett–Teller (BET) tests were carried out via a Quantachrome autosorb IQ-C nitrogen adsorption apparatus. All the as-prepared samples were degassed at 150 °C for 4 h prior to nitrogen adsorption measurements. UV-vis diffuse reflectance spectra (DRS) were recorded on a UV-vis spectrometer (Shimadzu UV-2550) by using BaSO4 as a reference and were converted from reflection to absorbance by the Kubelka–Munk method. The photoluminescence (PL) spectra of the photocatalysts were detected using an F-7000 FL Spectrophotometer.2.5 Photocatalytic experiments
In a general process, the photocatalytic activities of the photocatalysts were evaluated by the degradation of rhodamine B (Rh B). In a typical process, 80 mg of the as-synthesized photocatalysts were dispersed in 80 mL 1.0 × 10⁻⁵ mol L−1 rhodamine B (Rh B) solution and then magnetically stirred in the dark for 30 min to reach the adsorption–desorption equilibrium. The solution was then exposed to a 500 W Xe lamp with a cutoff filter (λ > 400 nm). And the working distance from the Xe lamp to the beaker is kept to be 20 cm. The optical power was measured to be 25.8 mW cm−2 during the whole photocatalytic process. To avoid the increase of the temperature during the irradiation process, the beaker containing the dispersion of Rh B and photocatalyst was cooled by circulating water during the whole photocatalysis process. The temperature of the solution was maintained to be 20 °C during the whole process to prevent the thermal catalytic effect. At given irradiation time, adequate aliquots (6 mL) of the suspension were extracted and centrifuged at 9000 rpm to remove the residual photocatalyst for analysis. The concentration of Rh B in the solution was calculated by the intensity of UV-Vis absorption (Agilent Cary 5000E UV-visible spectrophotometer).2.6 Active species trapping experiments
To explore the possible photocatalytic mechanism, active species trapping experiments was carried out using various kinds of scavengers such as benzoquinone (BQ) (a quencher of O2˙−), ammonium oxalate (AQ) (a quencher of h+), AgNO3 (a quencher of e−), and t-BuOH (a quencher of ˙OH). And the amount of scavenger was 10 mM except for BQ, which was 1 mM. The whole process is carried out in the similar way as the photocatalytic experiments.2.7 Photocurrent measurements
The ITO glass was cut into 3 cm × 0.7 cm slices and washed with water for two times before being bathed in 1 M NaOH solution for 10 min, and then washed with water several times and dried before use. For the preparation of the photoelectrode, 10 mg of photocatalyst was dispersed in 1 mL of absolute ethanol by ultrasonication firstly. In the next step, 10 μL of the resulting dispersion (10 mg mL−1) was drop-casted onto a piece of ITO slice with a fixed area of 0.7 cm2 and dried in air at room temperature to form Bi2WO6/MS modified ITO electrode. The photocurrent were measured by using an electrochemical analyzer (CHI660B, Chen Hua Instruments, Shanghai, China) with a standard three-electrode configuration, in which a Pt wire was employed as the counter electrode, a saturated Ag/AgCl electrode as the reference electrode and indium tin oxide (ITO) as the working electrode. The 500 W Xe lamp was used as the photo source, and the measured optical power on the ITO electrode was determined to be 70 mW cm−2. The electrolyte solution of photocurrent was phosphate buffered saline (0.1 mol L−1) and the pH value was adjusted to 7.4.3. Results and discussion
3.1 Sample characterizations
The addition of MPA in the synthetic process is of vital importance for the formation of Bi2WO6 based heterostructures. Take the formation of Bi2WO6/CdS as an example, no CdS will be observed on the nanoplates of Bi2WO6 without MPA (ESI, Fig. S1a†). To further investigate the effect of MPA, FTIR was employed. Pure MPA was reported to possess several typical peaks centering at 2667, 2573, 1711 and 1411 cm−1, which can be assigned to the O–H(νO–H), S–H(νS–H), C![[double bond, length as m-dash]](https://www.rsc.org/images/entities/char_e001.gif) O(νC
O(νC![[double bond, length as m-dash]](https://www.rsc.org/images/entities/char_e001.gif) O) and C–O(νC–O) stretching bands, respectively.40,41 As for the sample obtained by adding MPA into the dispersion of Bi2WO6, the peaks corresponding to νS–H disappears (ESI, Fig. S1b,† black line). Because the pKa of the thiol moiety is quite high (10.3), the disappearance of S–H peak can't be assigned to the deprotonation of sulfhydryl group in MPA.42 Meanwhile, the solution pH during the synthetic process is about 6, which also suggest that the MPA added during the synthetic process will not be the sulfur source for the formation of the heterostructures. The disappearance of this peak indicate the coordination interaction between Bi3+ and MPA, in which Bi3+ is bounded to the sulfhydryl group. When Cd2+ is added in to the solution during the synthetic process, the intermediate product was also separated and investigated with FTIR (ESI, Fig. S1b,† red line). The peaks corresponding to νC
O) and C–O(νC–O) stretching bands, respectively.40,41 As for the sample obtained by adding MPA into the dispersion of Bi2WO6, the peaks corresponding to νS–H disappears (ESI, Fig. S1b,† black line). Because the pKa of the thiol moiety is quite high (10.3), the disappearance of S–H peak can't be assigned to the deprotonation of sulfhydryl group in MPA.42 Meanwhile, the solution pH during the synthetic process is about 6, which also suggest that the MPA added during the synthetic process will not be the sulfur source for the formation of the heterostructures. The disappearance of this peak indicate the coordination interaction between Bi3+ and MPA, in which Bi3+ is bounded to the sulfhydryl group. When Cd2+ is added in to the solution during the synthetic process, the intermediate product was also separated and investigated with FTIR (ESI, Fig. S1b,† red line). The peaks corresponding to νC![[double bond, length as m-dash]](https://www.rsc.org/images/entities/char_e001.gif) O shift from 1637 to 1560 cm−1, which clearly indicate the coordination interaction between carboxyl group of MPA and Cd2+. This kind of coordination interaction favors for the adsorption of Cd2+ onto the surfaces of Bi2WO6 nanoplates, which is of vital importance for the fabrication of Bi2WO6/CdS heterostructures. In the next step, when Na2S was added, CdS nanoparticles finally formed on the surfaces of Bi2WO6 nanoplates. Based on the above experimental results and analysis, the role of MPA molecule can be considered to be a “linker”, which connect the host material and modifiers together, leading to the formation of the Bi2WO6/MS (M = Cd and Zn) heterostructures.
O shift from 1637 to 1560 cm−1, which clearly indicate the coordination interaction between carboxyl group of MPA and Cd2+. This kind of coordination interaction favors for the adsorption of Cd2+ onto the surfaces of Bi2WO6 nanoplates, which is of vital importance for the fabrication of Bi2WO6/CdS heterostructures. In the next step, when Na2S was added, CdS nanoparticles finally formed on the surfaces of Bi2WO6 nanoplates. Based on the above experimental results and analysis, the role of MPA molecule can be considered to be a “linker”, which connect the host material and modifiers together, leading to the formation of the Bi2WO6/MS (M = Cd and Zn) heterostructures.
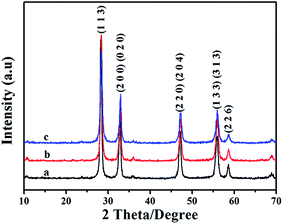
Bi2WO6 with flower-like structure were prepared by a hydrothermal process at 200 °C for 12 hours. The phase purities of the sample is examined by X-ray diffraction (XRD), and the corresponding XRD pattern is displayed as Fig. 1a. The diffraction peaks on Fig. 1a can be indexed to be the orthorhombic phased Bi2WO6 (JCPDS Card, no. 73-1126),43 indicating the formation of Bi2WO6. The XRD patterns of the samples modified with CdS (BW-Cd) and ZnS (BW-Zn) are displayed as Fig. 1b and c. Compared to Fig. 1a, no obvious difference can be observed on these two XRD patterns. Although no peak corresponding to CdS or ZnS is detected on the XRD pattern, the existence of CdS or ZnS can't be precluded. This phenomenon may be related to the small amount of CdS or ZnS and their high dispersion in the samples.44 Meanwhile, the synthetic processes were carried out under room temperature, which may lead to the poor crystallinities of MS (M = Cd or Zn). The poor crystallinities of MS would make them difficult to be detected by the XRD examination. To verify the existence of CdS and ZnS in samples BW-Cd and BW-Zn, the chemical compositions of the as-prepared composite photocatalysts were further investigated using X-ray fluorescence (XRF). The results of XRF clearly indicate the existence of CdS and ZnS in sample BW-Cd and BW-Zn. For sample BW-Cd, the atomic ratio between Bi, W, Cd and S is determined to be 2![[thin space (1/6-em)]](https://www.rsc.org/images/entities/char_2009.gif) :
:![[thin space (1/6-em)]](https://www.rsc.org/images/entities/char_2009.gif) 1
1![[thin space (1/6-em)]](https://www.rsc.org/images/entities/char_2009.gif) :
:![[thin space (1/6-em)]](https://www.rsc.org/images/entities/char_2009.gif) 0.18
0.18![[thin space (1/6-em)]](https://www.rsc.org/images/entities/char_2009.gif) :
:![[thin space (1/6-em)]](https://www.rsc.org/images/entities/char_2009.gif) 0.18. While for sample BW-Zn, the corresponding value is determined to be 2
0.18. While for sample BW-Zn, the corresponding value is determined to be 2![[thin space (1/6-em)]](https://www.rsc.org/images/entities/char_2009.gif) :
:![[thin space (1/6-em)]](https://www.rsc.org/images/entities/char_2009.gif) 1
1![[thin space (1/6-em)]](https://www.rsc.org/images/entities/char_2009.gif) :
:![[thin space (1/6-em)]](https://www.rsc.org/images/entities/char_2009.gif) 0.14
0.14![[thin space (1/6-em)]](https://www.rsc.org/images/entities/char_2009.gif) :
:![[thin space (1/6-em)]](https://www.rsc.org/images/entities/char_2009.gif) 0.14.
0.14.
The chemical state of the constituent elements for the as-obtained two samples (BW-Cd and BW-Zn) were further investigated by XPS analysis, which is based on the limited escape depth of electrons with relatively low kinetic energy and reveals information on the topmost few angstroms of the surface.45 The peak positions in all the XPS spectra were calibrated with C 1s at 284.60 eV. Fig. 2a is the overall XPS spectrum of sample BW-Cd, which clearly indicates the formation of Bi2WO6/CdS heterostructure. Fig. 2b and c are the high resolution XPS spectra of S 2s and Cd 3d, respectively. The binding energy centering at 226.4 eV can be assigned to S 2s. Meanwhile, Cd 3d exhibits characteristic peaks at 411.95 and 405.2 eV, corresponding to Cd 3d3/2 and Cd 3d5/2. Two peaks centering at 158.85 eV and 164.15 eV can be ascribed to Bi 4f7/2 and Bi 4f5/2![[thin space (1/6-em)]](https://www.rsc.org/images/entities/char_2009.gif) 46 (ESI, Fig. S2a†). And the peaks centering at 37.2 and 35.05 eV correspond to W 4f5/2 and W 4f7/2,47,13a respectively (Fig. S2b†). The formation of Bi2WO6/ZnS heterostructure can be also verified by the XPS investigation of sample BW-Zn, which clearly indicate the existence of Bi, W, Zn and S in sample BW-Zn (Fig. 2d). The peaks locating at 225.8 eV (shown in Fig. 2e) and 1021.75 eV (shown in Fig. 2f) belong to S 2s and Zn 2p peaks,48 respectively. Peaks centering at 37.45 and 35.3 eV, as shown in Fig. S2c,† correspond to W 4f5/2 and W 4f7/2. The binding energies for Bi 4f7/2 and Bi 4f5/2 are 159 and 164.3 eV, which can be observed in Fig. S2d.† For sample BW-Cd, the atomic ratio of Bi
46 (ESI, Fig. S2a†). And the peaks centering at 37.2 and 35.05 eV correspond to W 4f5/2 and W 4f7/2,47,13a respectively (Fig. S2b†). The formation of Bi2WO6/ZnS heterostructure can be also verified by the XPS investigation of sample BW-Zn, which clearly indicate the existence of Bi, W, Zn and S in sample BW-Zn (Fig. 2d). The peaks locating at 225.8 eV (shown in Fig. 2e) and 1021.75 eV (shown in Fig. 2f) belong to S 2s and Zn 2p peaks,48 respectively. Peaks centering at 37.45 and 35.3 eV, as shown in Fig. S2c,† correspond to W 4f5/2 and W 4f7/2. The binding energies for Bi 4f7/2 and Bi 4f5/2 are 159 and 164.3 eV, which can be observed in Fig. S2d.† For sample BW-Cd, the atomic ratio of Bi![[thin space (1/6-em)]](https://www.rsc.org/images/entities/char_2009.gif) :
:![[thin space (1/6-em)]](https://www.rsc.org/images/entities/char_2009.gif) W
W![[thin space (1/6-em)]](https://www.rsc.org/images/entities/char_2009.gif) :
:![[thin space (1/6-em)]](https://www.rsc.org/images/entities/char_2009.gif) Cd
Cd![[thin space (1/6-em)]](https://www.rsc.org/images/entities/char_2009.gif) :
:![[thin space (1/6-em)]](https://www.rsc.org/images/entities/char_2009.gif) S is determined to be 2
S is determined to be 2![[thin space (1/6-em)]](https://www.rsc.org/images/entities/char_2009.gif) :
:![[thin space (1/6-em)]](https://www.rsc.org/images/entities/char_2009.gif) 1
1![[thin space (1/6-em)]](https://www.rsc.org/images/entities/char_2009.gif) :
:![[thin space (1/6-em)]](https://www.rsc.org/images/entities/char_2009.gif) 0.35
0.35![[thin space (1/6-em)]](https://www.rsc.org/images/entities/char_2009.gif) :
:![[thin space (1/6-em)]](https://www.rsc.org/images/entities/char_2009.gif) 0.35. While for sample BW-Zn, the corresponding atom ratios of Bi
0.35. While for sample BW-Zn, the corresponding atom ratios of Bi![[thin space (1/6-em)]](https://www.rsc.org/images/entities/char_2009.gif) :
:![[thin space (1/6-em)]](https://www.rsc.org/images/entities/char_2009.gif) W
W![[thin space (1/6-em)]](https://www.rsc.org/images/entities/char_2009.gif) :
:![[thin space (1/6-em)]](https://www.rsc.org/images/entities/char_2009.gif) Zn
Zn![[thin space (1/6-em)]](https://www.rsc.org/images/entities/char_2009.gif) :
:![[thin space (1/6-em)]](https://www.rsc.org/images/entities/char_2009.gif) S is determined to be 2
S is determined to be 2![[thin space (1/6-em)]](https://www.rsc.org/images/entities/char_2009.gif) :
:![[thin space (1/6-em)]](https://www.rsc.org/images/entities/char_2009.gif) 1
1![[thin space (1/6-em)]](https://www.rsc.org/images/entities/char_2009.gif) :
:![[thin space (1/6-em)]](https://www.rsc.org/images/entities/char_2009.gif) 0.22
0.22![[thin space (1/6-em)]](https://www.rsc.org/images/entities/char_2009.gif) :
:![[thin space (1/6-em)]](https://www.rsc.org/images/entities/char_2009.gif) 0.22. It should be noted that the content of CdS or ZnS determined by the XPS are much larger than the corresponding values determined by the XRF investigation, which suggest that MS (M = Cd, Zn) nanoparticles is mainly dispersed on the surfaces of flower-like Bi2WO6 structures. Meanwhile, the content of CdS determined by XPS is much larger than the corresponding value of ZnS. This phenomenon can be attributed to the different measure modes between XRF and XPS. Because XPS is a micro-area analysis technique, the relatively high value for CdS content may relate to the non-uniform distribution of CdS nanoparticles on the naoplates of Bi2WO6.
0.22. It should be noted that the content of CdS or ZnS determined by the XPS are much larger than the corresponding values determined by the XRF investigation, which suggest that MS (M = Cd, Zn) nanoparticles is mainly dispersed on the surfaces of flower-like Bi2WO6 structures. Meanwhile, the content of CdS determined by XPS is much larger than the corresponding value of ZnS. This phenomenon can be attributed to the different measure modes between XRF and XPS. Because XPS is a micro-area analysis technique, the relatively high value for CdS content may relate to the non-uniform distribution of CdS nanoparticles on the naoplates of Bi2WO6.
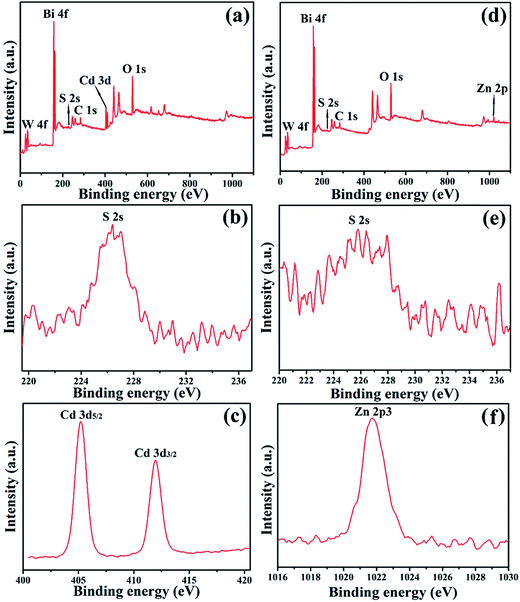 | ||
| Fig. 2 XPS analysis of (a) Bi2WO6/CdS sample, (b) S 2s, (c) Cd 3d, (d) Bi2WO6/ZnS sample, (e) S 2s, (f) Zn 2p. | ||
The morphologies and microstructures of samples BW-Cd and BW-Zn were further investigated by SEM, TEM and HRTEM, and the corresponding results are shown in Fig. 3. Fig. 3a is the SEM image of sample BW-Cd, which clearly indicate that the sample is composed of flower-like microstructures with diameter of about 2.0 μm, which agrees well with the microstructure of bare Bi2WO6 in our previous report.38 Fig. 3b is the high-magnification TEM image of the Bi2WO6 nanoplates, suggesting the existence of small nanoparticle on the surfaces of these nanoplates. The sizes of these nanoparticles is about 5–10 nm. These small nanoparticles can be designated to be CdS according to the EDS analysis (ESI, Fig. S3a†). To gain further insight into the detailed structure of sample BW-Cd, HRTEM was employed. Fig. 3c is the HRTEM image of sample BW-Cd, which clearly indicate the formation of the Bi2WO6/CdS heterostructure. The typical lattice spacing, being determined to be 0.315 nm, is consistent with the (1 1 3) planes of Bi2WO6. The lattice spacing taken on the tiny nanocrystals is about 0.242 nm, which is consistent with the (1 0 2) planes of CdS (JCPDS no. 89-2944). Fig. 3d–f shows the SEM, TEM, and HRTEM images of Bi2WO6/ZnS heterostructures, which also suggest that the existence of ZnS nanoparticles on the surfaces of Bi2WO6 nanoplates. Fig. 3f is the HRTEM image of sample BW-Zn, which clearly suggest the formation of Bi2WO6/ZnS heterostructures. The typical lattice spacing, being determined to be 0.415 nm, is consistent with the (0 0 4) planes of Bi2WO6. The lattice spacing taken on the tiny nanocrystals is about 0.546 nm, which is consistent with the (0 0 1) planes of ZnS (JCPDS no. 80-0020).
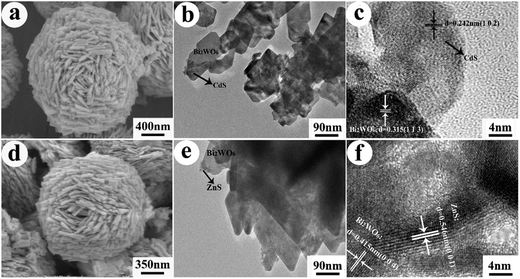 | ||
| Fig. 3 (a) SEM, (b) TEM and (c) HRTEM images of sample BW-Cd; (d) SEM, (e) TEM and (f) HRTEM images of sample BW-Zn. | ||
The BET specific surface areas of Bi2WO6, BW-Cd and BW-Zn were determined by nitrogen adsorption BET method. And the measurement indicate that the specific surface area of pure Bi2WO6, BW-Cd and BW-Zn were about 13.6, 13.9 and 13.7 m2 g−1, respectively. No obvious change in BET surface area (as displayed in ESI Fig. S4†) has been observed among these three samples, which uncovered that the surface area may not be the influencing factor for the different photocatalytic performances of BW-Cd and BW-Zn.
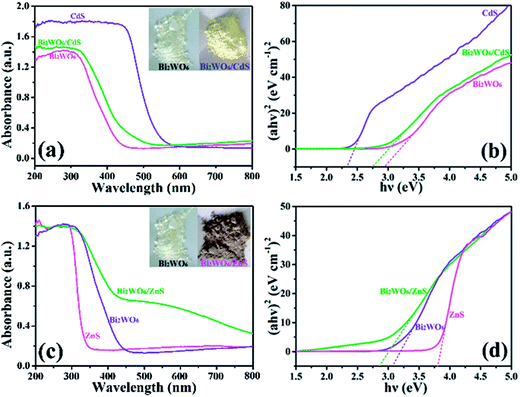
The optical properties of the as-prepared photocatalysts are investigated using the UV-vis diffuse reflectance spectrum (DRS) (Fig. 4a and c). Bare Bi2WO6 exhibit fundamental absorbance edge at 450 nm because of the intrinsic band-gap transition,49 and the absorbance edge of bare CdS and ZnS is at ∼540 nm and ∼338 nm, respectively. The adsorption edge of the sample BW-Cd is at 477 nm, which lies between the absorbance edges between Bi2WO6 and CdS. Compared with bare Bi2WO6, the absorbance edge of sample BW-Cd has an obvious red shift because of the introduction of CdS onto the Bi2WO6 nanoplates. As a result, the colors of samples BW-Cd changes from white to yellow (inset of Fig. 4a), resulting from the interfacial interactions between Bi2WO6 and CdS. As for sample BW-Zn, the absorbance edge is determined to be 575 nm, which show obvious red shift as compared to both bare Bi2WO6 and ZnS. Liu and co-workers have investigate the optical property of ZnO/ZnAl2O4 heterostrucures,50 whose absorbance edge also exhibit obvious red shift as compared to both ZnO and ZnAl2O4. This kind of change is attributed to the middle band gap between the CB bottom of ZnO and the VB top of ZnAl2O4. In our synthesis, the red shift of absorbance edge for sample BW-Zn could also be attributed to the middle band gap formed between the CB bottom of Bi2WO6 and the VB top of ZnS, which is mainly caused by the interfacial interaction between ZnS and Bi2WO6. This phenomena have also been reported by several groups for a variety of semiconductor heterostructures such as Bi2MoO6/TiO2,51 and TiO2/MMT.52
The optical band gaps of the as-form heterostructures can be calculated using the Tauc plot, which is described as follows:53
Based on the result of DRS, the band edge positions of the as-prepared semiconductors can be theoretically predicted using the electronegativity concept.54,55 The CB and VB potentials of the semiconductor at the point of zero charge can be calculated by the following equation:
| ECB = X + E0 − 0.5Eg |
| EVB = ECB + Eg |
| Sample | Band gap (eV) | Conduction band (eV) | Valence band (eV) |
|---|---|---|---|
| Bi2WO6 | 3.08 | 0.36 | 3.44 |
| CdS | 2.33 | −0.56 | 1.76 |
| ZnS | 3.78 | −1.12 | 2.66 |
| Bi2WO6/CdS | 2.74 | 0.36 (Bi2WO6) | 3.44 (Bi2WO6) |
| −0.56 (CdS) | 1.76 (CdS) | ||
| Bi2WO6/ZnS | 2.86 | 0.36 (Bi2WO6) | 3.44 (Bi2WO6) |
| −1.12 (ZnS) | 2.66 (ZnS) |
3.2 Visible-light-driven photocatalytic activities
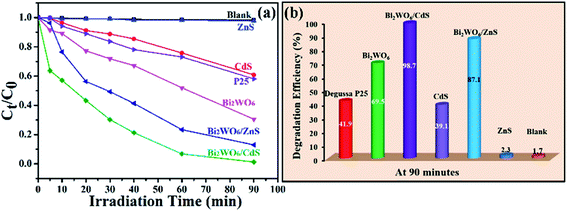
Dyes are pervasive commercial chemicals which have arisen unique environmental problems.56,57 So it is imperative to remove them before draining them to the environment. Compared to technologies involving physical or biological treatments,58,59 semiconductor-based photocatalysis can achieve significant organic dye pollutant degradation, which is considered as an alternative treatment strategy to solve the environmental problems successfully. To investigate the photocatalytic activities of the as-prepared heterostructures, rhodamine B (Rh B) is chosen as the target pollutant. For comparison purpose, the blank experiment (without photocatalysts), the photocatalytic activities of bare Bi2WO6, CdS nanoparticles, ZnS nanoparticles and Degussa P25 were also investigated. The photodegradation efficiencies of Rh B over BW-Cd, BW-Zn, bare Bi2WO6, CdS, ZnS, Degussa P25 and the blank experiment under visible light are shown in Fig. 5a. The blank experiment shows that Rh B molecules are very stable and the photolysis is negligible. In addition, both of the as-formed heterostructures (BW-Cd and BW-Zn) display enhanced photocatalytic activities as compared to bare Bi2WO6, CdS nanoparticles and ZnS nanoparticles. The photocatalytic activities among these samples follow the sequence: BW-Cd > BW-Zn > Bi2WO6 > P25 > CdS > ZnS. Among these samples, sample BW-Cd exhibits the highest photocatalytic activity toward the degradation of Rh B under visible light, and almost 98.7% of the Rh B can be degraded in 90 min (Fig. 5b). The photocatalytic activity of sample BW-Zn is a little poorer than sample BW-Cd and 87.1% of the Rh B can be degraded after irradiating for 90 minutes (Fig. 5b). Considering the fact that the two samples possess the similar BET surface areas, the difference in photocatalytic activities may relate to the different band gaps of the two heterostructures. ZnS nanoparticles exhibit the lowest photocatalytic activity, which may result from its large band gap. According to the band gap calculation above, the band gap of ZnS is 3.78 eV, indicating the poor absorbance of light in the visible region. Although the band gap of P25 is also large (3.2 eV), P25 shows a notably higher photoactivity than ZnS. Besides the band gap, the photocatalytic activity of semiconductor is also greatly influenced by a series of factors, such as BET surface areas and crystallinity.60,61 Fig. S5† are the XRD patterns of the as-obtained ZnS nanoparticles and P25, which clearly indicate that the ZnS nanoparticles are poorly crystallized than P25. The difference in the crystallinity could also be reflected by the corresponding SAED pattern taken on these two samples. The poor crystallinity of ZnS nanoparticles could be verified by the ring-like ED pattern. Meanwhile, the BET surface areas of P25 and ZnS nanoparticles are determined to be 50.4 m2 g−1 and 21 m2 g−1, which shows that P25 possess a much larger surface area than ZnS nanoparticles. So the difference in photocatalytic activities between P25 and ZnS nanoparticles could be attributed to their different crystallinities and surface areas.As the band gap of P25 is large, it can be anticipated that the photocatalytic activity under visible light will be handicapped. To compare it with BW-MS (M = Cd or Zn), the Xe lamp was replaced by mercury lamp to offer useful photons for both P25 and BW-MS systems. The photocatalytic activities sequence among the three samples follow the sequence: P25 > BW-Zn > BW-Cd, which is in the opposite sequence as compared to the photocatalytic activities under visible light (Fig. S6†). Therefore, it can be concluded that the as-synthesized BW-MS (M = Cd or Zn) is a good visible-light responsive but not a good UV-light responsive photocatalyst.
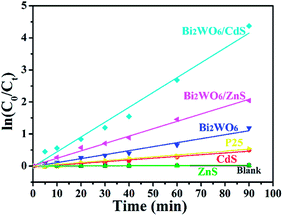
To quantitatively understand the reaction kinetics of Rh B degradation in our experiments, Langmuir–Hinshelwood model was employed. This model is well-established for photocatalytic experiments when the concentration of the organic pollutant is in the millimolar range,62 which is expressed as follows:
| Sample | Photocatalytic efficiency | Rate constant (min−1) |
|---|---|---|
| Bi2WO6 | 69.5% | 1.244 × 10⁻² |
| CdS | 39.1% | 5.420 × 10⁻³ |
| ZnS | 2.3% | 2.472 × 10⁻⁴ |
| P25 | 41.9% | 5.940 × 10⁻³ |
| Bi2WO6/ZnS | 87.1% | 2.301 × 10⁻² |
| Bi2WO6/CdS | 98.7% | 4.633 × 10⁻² |
| Blank (no photocatalyst) | 1.7% | 1.862 × 10⁻⁴ |
The stability of the Bi2WO6/MS (M = Cd or Zn) heterostructures were also investigated by the degradation of Rh B under visible-light irradiation (shown in Fig. S7†). It should be noted that the photocatalytic activity of BW-Cd and BW-Zn catalyst exhibit obvious loss after five cycles. And the photodegradation efficiency decreased to 86.2% and 90% of their initial photocatalytic efficiency, respectively. According to the previous report, both CdS and ZnS are easily suffered from photocorrosion in aqueous media containing oxygen when exposed to visible light.63–66 Thus, the decrease in the photocatalytic activities of the as-obtained heterostructures may result from the photocorrosion of metal sulfides during the photocatalytic process.
The improved photocatalytic activities of BW-Cd and BW-Zn is closely to the enhanced separation efficiency of photogenerated electrons and holes. To clarify this view, the photocurrent and photoluminescence spectra of bare Bi2WO6, BW-Cd and BW-Zn are investigated. Electrons in the conduction band and holes in the valence band were generated in the semiconductor under irradiation. As well known, the separation efficiency of electrons and holes play a crucial role during the photocatalytic reaction.67 A higher photocurrent indicate the presence of photogenerated electrons and holes longer lives and hence the higher the photocatalytic activity can be achieved.68 From the I–t curves (shown in Fig. 7), it can be seen that the BW-Cd and BW-Zn exhibit higher transient photocurrent density than bare Bi2WO6, which indicate an enhanced photo-induced electrons and holes separation efficiency. And the enhancement in the separation efficiency of electrons and holes for these two samples is higher than bare Bi2WO6, resulting from the interactions between Bi2WO6 and MS (M = Cd and Zn).
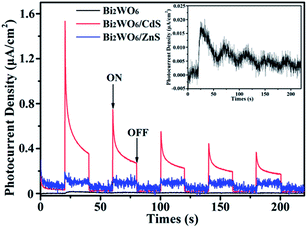 | ||
| Fig. 7 Transient photocurrent response for the sample Bi2WO6, BW-Cd, and BW-Zn. The inset shows the amplifying photocurrent of bare Bi2WO6. | ||
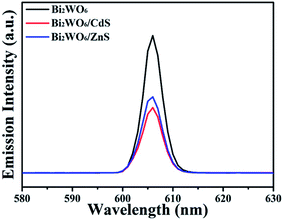
Photoluminescence (PL) spectrum is also a useful technique to survey the separation efficiency of the photogenerated charge carriers in a semiconductor, because the PL emission mainly results from the recombination of free carriers.69 In general, lower PL intensity means lower recombination rate of the electron–hole pairs under light irradiation. The PL spectra (excited at 300 nm) of bare Bi2WO6, BW-Cd and BW-Zn at room temperature is shown in Fig. 8. It can be found that the PL emission intensities of samples BW-Cd and BW-Zn composite are dramatically weakened as compared to bare Bi2WO6. Sample BW-Cd exhibits the lowest emission peaks, which indicates that the formation of the heterostructures between Bi2WO6 and CdS would greatly facilitate the separation of the photo-generated charge carriers. As a result, the photocatalytic activity of the BW-Cd was greatly enhanced, and that is the reason why sample BW-Cd exhibits the highest photocatalytic activity.
3.3 Mechanism of photocatalysis
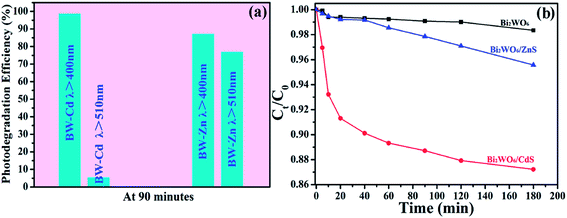
As for the photodecomposition process of Rh B, two photocatalytic mechanisms are generally proposed. One is achieved by the degradation of the conjugated structure via a photocatalytic process,70 during which a decrease of the absorption band without shifting of the maximum absorbance wavelength at 555 nm could be observed. The second pathway is really a photosensitized process, during which the degradation of Rh B occurs via the N-deethylation of Rh B in a stepwise process. To be specific, Rh B initially tetra-ethylated (λmax = 555 nm) becomes tri, di-, mono-, and no-ethylated (λmax is, respectively, 539, 522, 510, and 498 nm).71–73 And this process is usually featured by the blue shifting of the absorption band. According to the absorption spectra variation of Rh B upon irradiation with the visible light in the presence of BW-Cd and BW-Zn (ESI, Fig. S8†), the occurrence of the photosensitization process could be confirmed. To figure out the main driving force in the photocatalytic process, a series of comparative experiments were carried out. In the first step, a 510 nm cutoff filter was employed during the whole photocatalytic process, which could only allow the transmission of light with wavelength longer than 510 nm. In this region, both BW-Cd and BW-Zn can't be effectively excited, and the photocatalytic process mainly relate to the photosensitized process. The photodegradation efficiency of BW-Cd sharply decreased when the 510 nm cutoff filter was employed, and only 5.4% of Rh B was degraded in 90 minutes. As for sample BW-Zn, the photodegradation efficiency can reach to 77% in 90 minutes, which is a little smaller than the corresponding value when the 400 cutoff filter was employed. This result clearly demonstrate that the photodecomposition of Rh B over BW-Cd is mainly driven by the first pathway (photocatalytic process). While for sample BW-Zn, the photodecomposition of Rh B is a photosensitization process indeed. So, although both photocatalytic process and photosensitization process exist during the photodecomposition of Rh B, the influence of these two pathways are totally different for this two samples. To further clarify our view, 4-chlorophenol (4-CP) was chosen as the target pollutant, because it has no light absorption in the visible-light region and no photosensitization in the visible light region. The initial concentration of 4-CP was 7.5 × 10⁻⁵ mol L−1, and the dosage of photocatalyst was same to the typical photocatalytic experiments. The photocatalytic of the three sample bare Bi2WO6, BW-Zn and BW-Cd over 4-CP were shown in Fig. 9b, which clearly indicate that all of the three samples exhibit photocatalytic activities under visible light. Among the three sample, BW-Cd exhibits the highest photocatalytic activity. It should be noted that the photocatalytic activity of BW-Zn exhibits much lower photocatalytic activity as compared to BW-Cd, which also suggest that the photosensitization process play a key role in the photodecomposition process.In order to reveal the active species during the photocatalytic process, the trapping experiments were conducted. A series of quenchers such as benzoquinone (BQ, scavenger for O2˙−), ammonium oxalate (AO, scavenger for h+), AgNO3 (scavenger for e−), and t-BuOH (scavenger for ˙OH) were introduced to the Rh B solution before the addition of photocatalyst to ascertain the ruling active species,74 and the corresponding results are shown in Fig. 10. The amount of these quenchers is 10 mM except for the BQ, which is 1 mM to avoid the reaction with Rh B. For both the two heterostructures, the addition of t-butanol (hydroxyl radicals scavenger) only cause a small decrease on the photodegradation rate of Rh B, indicating that hydroxyl radicals are not the driving force for the degradation of Rh B. On the contrary, the introduction of ammonium oxalate (the holes scavenger) cause an inhibition phenomenon on the photodegradation of Rh B, suggesting that the photo-generated holes play vital roles in the degradation of Rh B. Meanwhile, the photodegradation of Rh B was also substantially reduced by the addition of AgNO3 (electrons scavenger) and BQ (superoxide radical anions scavenger), indicating that both electron and superoxide radical anions also exist in the solution.
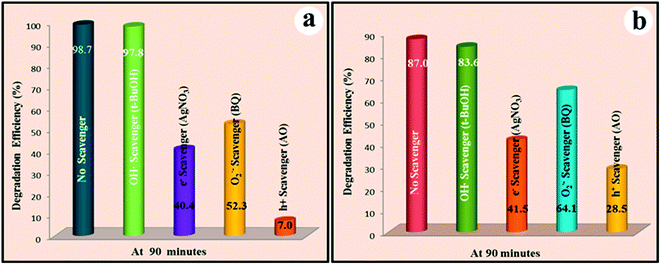 | ||
| Fig. 10 Effects of a series of scavengers on the photodegradation efficiency of Rh B using sample (a) BW-Cd, and (b) BW-Zn. | ||
For sample BW-Cd, the enhanced photocatalytic performance can be well ascribed to the interfacial interaction between CdS and Bi2WO6. And the process of photodegradation can be described as follows:
| CdS + hv → CdS(eCB−…hVB+) |
| CdS(eCB−) + Bi2WO6 → CdS + Bi2WO6(eCB−) |
| Bi2WO6(eCB−) + O2 → Bi2WO6 + O2˙− |
| CdS(hVB+) + Rh B → CO2 + H2O |
While for BW-Zn, the photosensitization process play an important role in the photocatalytic process. Besides the band gap coupling of the two semiconductors, Rh B can also absorb incident photon flux owing to the intermolecular π–π* transition. So the photodegradation process of BW-Zn is different from sample BW-Cd, which could be described as follows:
| Rh B + hv → Rh B(e−…h+) |
| Rh B(e−) + ZnS → ZnS(eCB−) + Rh B |
| ZnS(eCB−) + O2 → ZnS + O2˙− |
| Bi2WO6 + hν → Bi2WO6(eCB−) + Bi2WO6(hVB+) |
| Bi2WO6(eCB−) + O2 → Bi2WO6 + O2˙− |
| Bi2WO6(hVB+) + ZnS → Bi2WO6 + ZnS(hVB+) |
| ZnS(hVB+) + Rh B → CO2 + H2O |
Based on the above experimental results, the schematic diagrams for the photocatalytic processes in the presence of BW-Cd and BW-Zn are presented in Scheme 2. When BW-Cd is irradiated, electrons are excited from the valence band (VB) of CdS to its conduction band (CB). Then, the CB-electrons of CdS could easily transfer to the CB of Bi2WO6, driven by the decrease in potential energy. This process could facilitate their participation in an electron reduction reaction of oxygen to activate molecular oxygen (e.g., the formation of superoxide radical anion). As a result, the recombination of electron–hole pairs were efficiently inhibited and the lifetime of charge carriers were prolonged, which would lead to the enhanced photocatalytic performances of the as-formed heterostructures.
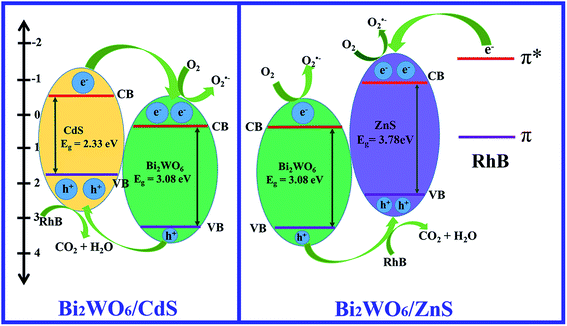 | ||
| Scheme 2 Schematic diagram showing separation of photo-generated charge carriers in sample BW-Cd and BW-Zn. | ||
As for BW-Zn, the photocatalytic mechanism is different to BW-Cd. Because of the large band gap of ZnS, ZnS can't be excited under visible light. So, when BW-Zn was irradiated with visible light, electrons are easily excited from the VB of Bi2WO6 to its CB. Then the photo-generated holes will transfer to the VB of ZnS because of the inter-built electric field. Meanwhile, Rh B dye could absorb the incident photon flux upon visible light irradiation. Then, the photo-generated electrons were transferred to the excited state of the dye owing to the intramolecular π–π* transition and the dyes were oxidized. The photoelectrons of the excited state were immediately injected into the conducting band of Bi2WO6. The photoelectrons in the CB were then captured by O2, and the succeeding reactions can lead to the decomposition of the dyes. Because of the formation of heterostructures, the separation efficiency of photo-generated electrons and holes are greatly enhanced, which will lead to the fast decomposition of Rh B in our experiment.
4. Conclusions
In this report, Bi2WO6/CdS and Bi2WO6/ZnS heterostructures was successfully prepared by a surface functionalization method using 3-mercaptopropionic (MPA) as the surface functionalizing agent. The formation of these type II heterostructure is proved to be an effective method to improve the photocatalytic performance of Bi2WO6. And the photodegradation efficiency of sample BW-Cd and BW-Zn for Rh B was approximately 3.72 and 1.85 times higher than bare Bi2WO6, respectively. The enhanced photocatalytic activities of the as-obtained heterostructures could be attributed to the facilitated interfacial charge transfer and inhibited electron–hole recombination, which has been confirmed by the photocurrent and PL measurement. The trapping experiments indicate the dominant active species in the photocatalytic process are photo-generated holes. Based on the experimental results, the photocatalytic mechanisms for samples BW-Cd and BW-Zn are proposed. Thus, these novel heterostructured materials are supposed to have potential applications in waste water treatment.Acknowledgements
This work was supported by the National Natural Science Foundation of China (Grant no. 21373106) and Program for Scientific Research Innovation Team in Colleges and Universities of Shandong Province.References
- A. Hagfeldt and M. Gratzel, Chem. Rev., 1995, 95, 49–68 CrossRef CAS.
- Z. G. Zou, J. H. Ye and K. Sayama, Nature, 2001, 414, 625–627 CrossRef CAS PubMed.
- N. Z. Bao, L. M. Shen, T. Takata and K. Domen, Chem. Mater., 2008, 20, 110–117 CrossRef CAS.
- R. Asahi, T. Morikawa, T. Ohwaki, K. Aoki and Y. Taga, Science, 2001, 293, 269–271 CrossRef CAS PubMed.
- W. Morales, M. Cason, O. Aina, N. R. Tacconi and K. Rajeshwar, J. Am. Chem. Soc., 2008, 130, 6318–6319 CrossRef CAS PubMed.
- M. R. Hoffmann, S. T. Martin, W. Choi and D. W. Bahneman, Chem. Rev., 1995, 95, 6996 CrossRef.
- Z. G. Zou, J. H. Ye, S. Kazuhiro and A. Hironori, Nature, 2001, 414, 625–627 CrossRef CAS PubMed.
- R. Asahi, T. Morikawa, T. Ohwaki, K. Aoki and Y. Taga, Science, 2001, 293, 269–271 CrossRef CAS PubMed.
- K. Maeda, K. Teramura, D. L. Lu, T. Takata, N. Saito, Y. Inoue and K. Domen, Nature, 2006, 440, 295 CrossRef CAS PubMed.
- X. C. Wang, K. Maeda, A. Thomas, K. Takanabe, G. Xin, J. M. Carlsson, K. Domen and M. Antonietti, Nat. Mater., 2009, 8, 76–80 CrossRef CAS PubMed.
- (a) Z. G. Yi, J. H. Ye, N. Kikugawa, T. Kako, S. X. Ouyang, H. Stuart-Williams, H. Yang, J. Y. Cao, W. J. Luo, Z. S. Li, Y. Liu and R. L. Withers, Nat. Mater., 2010, 9, 559–564 CrossRef CAS PubMed; (b) Y. P. Bi, S. X. Ouyang, N. Umezawa, J. Y. Cao and J. H. Ye, J. Am. Chem. Soc., 2011, 133, 6490–6492 CrossRef CAS PubMed.
- X. X. Xu, C. Randorn, P. Efstathiou and J. T. S. Irvine, Nat. Mater., 2012, 11, 595–598 CrossRef CAS PubMed.
- (a) H. B. Fu, C. S. Pan, W. Q. Yao and Y. F. Zhu, J. Phys. Chem. B, 2005, 109, 22432–22439 CrossRef CAS PubMed; (b) Y. Tsunoda, W. Sugimoto and Y. Sugahara, Chem. Mater., 2003, 15, 632–635 CrossRef CAS.
- J. Wu, F. Duan, Y. Zheng and Y. Xie, J. Phys. Chem. C, 2007, 111, 12866–12871 CAS.
- F. Amano, K. Nogami, R. Abe and B. Ohtani, J. Phys. Chem. C, 2008, 112, 9320–9326 CAS.
- C. X. Xu, X. Wei, Y. M. Guo, H. Q. Wu, Z. H. Ren, G. Xu, G. Shen and G. R. Han, Mater. Res. Bull., 2009, 44, 1635–1641 CrossRef CAS PubMed.
- M. Shang, W. Z. Wang and H. L. Xu, Cryst. Growth Des., 2009, 9, 991–996 CAS.
- L. S. Zhang, W. Z. Wang, Z. G. Chen, L. Zhou, H. L. Xu and W. Zhu, J. Mater. Chem., 2007, 17, 2526–2532 RSC.
- Z. Chen, L. W. Qian, J. Zhu, Y. P. Yuan and X. F. Qian, CrystEngComm, 2010, 12, 2100–2106 RSC.
- X. F. Cao, L. Zhang, X. T. Chen and Z. L. Xue, CrystEngComm, 2011, 13, 306–311 RSC.
- L. Wu, J. H. Bi, Z. H. Li, X. X. Wang and X. Z. Fu, Catal. Today, 2008, 131, 15–20 CrossRef CAS PubMed.
- Z. J. Zhang, W. Z. Wang, M. Shang and W. Z. Yin, J. Hazard. Mater., 2010, 177, 1013–1018 CrossRef CAS PubMed.
- S. B. Zhu, T. G. Xu, H. B. Fu, J. C. Zhao and Y. F. Zhu, Environ. Sci. Technol., 2007, 41, 6234–6239 CrossRef CAS.
- S. M. Lopez, M. C. Hidalgo, J. A. Navio and G. Colon, J. Hazard. Mater., 2011, 185, 1425–1434 CrossRef PubMed.
- M. S. Gui, W. D. Zhang, Y. Q. Chang and Y. X. Yu, Chem. Eng. J., 2012, 197, 283–288 CrossRef CAS PubMed.
- Z. J. Zhang, W. Z. Wang, L. Wang and S. M. Sun, ACS Appl. Mater. Interfaces, 2012, 4, 593–597 CAS.
- J. X. Xia, J. Di, S. Yi, H. Xu, J. Zhang, Y. G. Xu, L. Xu, H. M. Li and M. X. Ji, RSC Adv., 2014, 4, 82–90 RSC.
- Q. C. Xu, D. V. Wellia, Y. H. Ng, R. Amal and T. T. Y. Tan, J. Phys. Chem. C, 2011, 115, 7419–7428 CAS.
- X. N. Li, R. K. Huang, Y. H. Hu, Y. J. Chen, W. J. Liu, R. S. Yuan and Z. H. Li, Inorg. Chem., 2012, 51, 6245–6250 CrossRef CAS PubMed.
- H. W. Huang, S. B. Wang, N. Tian and Y. H. Zhang, RSC Adv., 2014, 4, 5561–5567 RSC.
- G. K. Fu, G. N. Xu, S. P. Chen, L. Lei and M. L. Zhang, Catal. Commun., 2013, 40, 120–124 CrossRef CAS PubMed.
- Y. Hu, Y. Liu, H. Qian, Z. Li and J. Chen, Langmuir, 2010, 26, 18570–18575 CrossRef CAS PubMed.
- D. Jing and L. Guo, J. Phys. Chem. C, 2007, 111, 13437–13441 CAS.
- D. Barpuzary and M. Qureshi, ACS Appl. Mater. Interfaces, 2013, 5, 11673–11682 CAS.
- G. S. Li, D. Q. Zhang and J. C. Yu, Environ. Sci. Technol., 2009, 43, 7079–7085 CrossRef CAS.
- Y. X. Yu, W. X. Ouyang, Z. T. Liao, B. B. Du and W. D. Zhang, ACS Appl. Mater. Interfaces, 2014, 6, 8467–8474 CAS.
- Z. Fang, Y. F. Liu, Y. T. Fan, Y. H. Ni, X. W. Wei, K. B. Tang, J. M. Shen and Y. Chen, J. Phys. Chem. C, 2011, 115, 13968–13976 CAS.
- Y. W. Mi, S. Y. Zeng, L. Li, Q. F. Zhang, S. N. Wang, C. H. Liu and D. Z. Sun, Mater. Res. Bull., 2012, 47, 2623–2630 CrossRef CAS PubMed.
- M. R. Kim, Y. Kang and D. Jang, J. Phys. Chem. C, 2007, 111, 18507–18511 CAS.
- A. Ihs and B. Liedberg, J. Colloid Interface Sci., 1991, 144, 282–292 CrossRef CAS.
- N. Mahapatra, S. Panja, A. Mandal and M. Halder, J. Mater. Chem. C, 2014, 2, 7373 RSC.
- U. Srinivasan, P. A. Mieyal and J. J. Mieyal, Biochemistry, 1997, 36, 3199–3206 CrossRef CAS PubMed.
- S. Y. Zeng, R. F. Tang, S. X. Duan, L. Li, C. H. Liu, X. L. Gu, S. S. Wang and D. Z. Sun, J. Colloid Interface Sci., 2014, 432, 236–245 CrossRef CAS PubMed.
- L. Ge and J. Liu, Mater. Lett., 2011, 65, 1828–1831 CrossRef CAS PubMed.
- P. Tierno and W. A. Goedel, J. Phys. Chem. B, 2006, 110, 3043–3050 CrossRef CAS PubMed.
- K. L. Zhang, C. M. Liu, F. Q. Huang, C. Zheng and W. D. Wang, Appl. Catal., B, 2006, 68, 125–129 CrossRef CAS PubMed.
- M. S. Gui, W. D. Zhang, Q. X. Su and C. H. Chen, J. Solid State Chem., 2011, 184, 1977–1982 CrossRef CAS PubMed.
- G. Marci, V. Augugliaro, M. J. López-Muñoz, C. Martin, L. Palmisano, V. Rives, M. Schiavello, R. J. D. Tilley and A. M. Venezia, J. Phys. Chem. B, 2001, 105, 1026–1032 CrossRef CAS.
- A. Kudo, I. Tsuji and H. Kato, Chem. Commun., 2002, 17, 1958–1959 RSC.
- L. Zhang, J. H. Yan, M. J. Zhou, Y. P. Yu, Y. Liu and Y. N. Liu, Trans. Nonferrous Met. Soc. China, 2014, 24, 743–749 CrossRef CAS.
- N. Li, L. Zhu, W. D. Zhang, Y. X. Yu, W. H. Zhang and M. F. Hou, J. Alloys Compd., 2011, 509, 9770–9775 CrossRef CAS PubMed.
- G. K. Zhang, X. M. Ding, F. S. He, X. Y. Yu, J. Zhou, Y. J. Hu and J. W. Xie, Langmuir, 2008, 24, 1026–1030 CrossRef CAS PubMed.
- P. Sippel, D. Denysenko, A. Loidl, P. Lunkenheimer, G. Sastre and D. Volkmer, Adv. Funct. Mater., 2014, 24, 3885–3896 CrossRef CAS PubMed.
- D. N. Ke, T. Y. Peng, L. Ma, P. Cai and P. Jiang, Appl. Catal., A, 2008, 350, 111–117 CrossRef CAS PubMed.
- L. Ren, J. Lei, J. B. Wang, M. Qiu and Y. Yu, Nanotechnology, 2009, 20, 405602 CrossRef PubMed.
- K. Vinodgopal, I. Bedja and P. V. Kamat, Chem. Mater., 1996, 8, 2180–2187 CrossRef CAS.
- S. Chatterjee, A. K. Tyagi and P. Ayyub, J. Nanomater., 2014, 2014, 1–7 CrossRef PubMed.
- E. Forgacs, T. Cserháti and G. Oros, Environ. Int., 2004, 30, 953–971 CrossRef CAS PubMed.
- S. Senthilkumaar, K. Porkodi, R. Gomathi, A. Geetha Maheswari and N. Manonmani, Dyes Pigm., 2006, 69, 22–30 CrossRef CAS PubMed.
- S. Ikeda, N. Sugiyama, S. Murakami, H. Kominami, Y. Kera, H. Noguchi, K. Uosaki, T. Torimoto and B. Ohtani, Phys. Chem. Chem. Phys., 2003, 5, 778–783 RSC.
- B. Ohtani, R. M. Bowman, D. P. Colombo Jr, H. Kominami, H. Noguchi and K. Uosaki, Chem. Lett., 1998, 27, 579–580 CrossRef.
- V. A. Sakkas, I. M. Arabatzis, I. K. Konstantinou, A. D. Dimou, T. A. Albanis and P. Falaras, Appl. Catal., B, 2004, 49, 195–205 CrossRef CAS PubMed.
- H. Zhang and Y. F. Zhu, J. Phys. Chem. C, 2010, 114, 5822–5826 CAS.
- D. E. Dunstan, A. Hagfeldt, M. Almgren, H. O. G. Siegbahn and E. Mukhtart, J. Phys. Chem., 1990, 94, 6197–6804 CrossRef.
- W. R. Becquerel, J. Chem. Phys., 1960, 32, 1505–1514 CrossRef PubMed.
- H. Gerischer, Pure Appl. Chem., 1980, 52, 2649–2667 CrossRef CAS.
- H. Xu, J. Yan, Y. G. Xu, Y. H. Song, H. M. Li, J. X. Xia, C. J. Huang and H. L. Wan, Appl. Catal., B, 2013, 129, 182–193 CrossRef CAS PubMed.
- Q. J. Xiang, J. G. Yu and M. Jaroniec, J. Phys. Chem. C, 2011, 115, 7355 CAS.
- H. Q. Li, Y. M. Cui and W. S. Hong, Appl. Surf. Sci., 2013, 264, 581–588 CrossRef CAS PubMed.
- (a) X. K. Li and J. H. Ye, J. Phys. Chem. C, 2007, 111, 13109–13116 CrossRef CAS; (b) T. Watanabe, T. Takizawa and K. Honda, J. Phys. Chem., 1977, 81, 1845–1851 CrossRef CAS.
- (a) P. Qu, J. C. Zhao, T. Shen and H. Hidaka, J. Mol. Catal. A: Chem., 1998, 129, 257–268 CrossRef CAS; (b) T. X. Wu, G. M. Liu, J. C. Zhao, H. Hidaka and N. Serpone, J. Phys. Chem. B, 1998, 102, 5845–5851 CrossRef CAS.
- P. Lei, C. Chen, J. Yang, W. Ma, J. Zhao and L. Zang, Environ. Sci. Technol., 2005, 39, 8466–8474 CrossRef CAS.
- C. Chen, W. Zhao, J. Li and J. Zhao, Environ. Sci. Technol., 2002, 36, 3604–3611 CrossRef CAS.
- Y. Wang, K. Deng and L. Zhang, J. Phys. Chem. C, 2011, 115, 14300–14308 CAS.
Footnote |
| † Electronic supplementary information (ESI) available: EDS spectra and BET spectra for the two heterostructures, XPS patterns of Bi 4f and W 4f of BW-MS samples are provided in supporting information. See DOI: 10.1039/c5ra04655f |
| This journal is © The Royal Society of Chemistry 2015 |


