Introduction of α-MnO2 nanosheets to NH2 graphene to remove Cr6+ from aqueous solutions†
Li Zhanga,
Yaxi Tiana,
Yaopeng Guoa,
Hui Gaob,
Haizhen Lia and
Shiqiang Yan*a
aCollege of Chemistry and Chemical Engineering, Lanzhou University, Lanzhou 730000, PR China. E-mail: yansq@lzu.edu.cn; Fax: +86 931 8912582; Tel: +86 931 8912582
bCollege of Life Science, Lanzhou University, Lanzhou 730000, PR China
First published on 28th April 2015
Abstract
The planar structure of the designed α-MnO2–NH2–RGO hybrid was prepared and characterized and used to remove hexavalent chromium ions (Cr6+) from aqueous solutions. The characterization of the novel adsorbent was carried out using the Fourier transform infrared spectrum (FTIR), X-ray diffraction (XRD), transmission electron microscopy (TEM), and the Brunauer–Emmett–Teller (BET) theory. Cr6+ adsorption efficiency was investigated as a function of the pH of Cr6+ solution, contact time and temperature. The results showed that the adsorption capacity strongly depended on the pH and that the adsorption equilibrium data were best described by the Freundlich isothermal model. The maximum sorption capacity towards Cr6+ was 371 mg g−1. The kinetic adsorption was fitted to the pseudo-second-order kinetics model and it indicated that the adsorption mechanism is physical or chemical sorption on heterogeneous materials. The thermodynamic parameters were obtained, and the results showed that the adsorption process is spontaneous and exothermic. The adsorption capacity of α-MnO2–NH2–RGO can remain as high as 81% after five usage cycles. As a result, these findings propose that α-MnO2–NH2–RGO could be used as an outstanding adsorbent for Cr6+.
1. Introduction
Chromium has been considered to be one of the most common pollutants because of its widespread use in industrial processes.1 The use of chromium in pigment manufacture, leather tanning, metal finishing, ink manufacturing, and automobile spare parts are the main sources of chromium-based pollution. The acute toxicity, mutagenicity and carcinogenicity of chromium are strongly dependent on the oxidation state.2 Chromium exists in the environment in both trivalent [Cr(III)] (Cr3+) and hexavalent [Cr(VI)] (Cr6+) forms. However, hexavalent chromium Cr6+ is more toxic and more mobile in nature than trivalent [Cr(III)]. Because of non-biodegradation and easy accumulation in living beings,3 it can cause various diseases and disorder generating fatal effects, such as corrosion of skin, respiratory tract infection, lung carcinoma, severe diarrhea, and hemorrhage.4 The World Health Organization (WHO) recommends a maximum allowable level of 50 ppb total chromium content in drinking water. The U.S. Environmental Protection Agency established a guideline of 100 ppb maximum contaminant level for total chromium content in drinking water.3,5To meet environmental regulations, effluents or water polluted with chromium must be treated before discharge. The technologies available for controlling Cr6+ in the environment include ion exchange,6 chemical precipitation,7 reverse osmosis,8 and adsorption.4 Adsorption is considered to be an attractive and cost-effective method for removal, recovery and recycling of metals from wastewater. The biosorbents can adequately remove heavy-metal ions, they do not show mechanical strength because of low selectivity.9 As for the chemical reduction precipitation process, hexavalent chromium is reduced to trivalent chromium.10 However, this process is expensive, the treatment is incomplete, and the water still has high Cr6+ concentration. These defects have improved the applications for Cr6+ removal from effluents or wastewater. Thus, there is a pressing need to develop new materials with high specific surface area, high adsorption capacity, easy sorption and stability in extreme conditions.11
Being a one-atom-thick sheet of carbon atoms packed in two-dimensional (2D) honeycomb lattices, graphene possesses a large theoretical specific surface area (2630 m2 g−1),12 superior electronic and outstanding chemical stability.13 Currently, graphene has enjoyed significant attention in the preparation of graphene-based composites because it provides outstanding support.14,15 Among these nanocomposites, considerable attention has been focused on integrating graphene with other inorganic particles for the fabrication of composites or hybrids. In brief, it is believed that the adhesion of inorganic materials to graphene can prevent the graphene sheets from aggregating and keep the specific surface area and pore volume at high levels, which is essential for applications such as adsorption processes and photocatalysis. On the other hand, graphene can efficiently stabilize inorganic particles to prevent aggregation, and the performance of these inorganic materials could be enhanced through graphene loading.16–19
Recent studies have showed that oxide minerals, ubiquitous in soils, rocks and sediments, serve as natural sinks for contaminants in the environment.20,21 Nanosized manganese oxide (MnO2) is among the most reactive minerals that have a large specific surface area, outstanding oxidizing/adsorption abilities, and excellent stability under acidic conditions.22 It provides an effective scavenging pathway for heavy metals in poisonous systems.
In general, the surface charge of MnO2 is negative, and it can be used as a dominant adsorbent for the removal of heavy metals from water effluents. However, as the medium of filtration, pure manganese oxide is uneconomical and disadvantageous and possesses a physical characteristic that MnO2 attenuates numerous heavy-metal ions via adsorption, ion exchange, and co-precipitation. Thus, it is highly desirable to explore the support of MnO2 that can increase the removal efficiency for heavy ions with a low cost and environmentally benign nature.23
In the present work, we demonstrate a novel hybrid nanostructure consisting of distinct ultrathin nanosheets for greatly enhanced adsorption performance. Partially, the structures based on the α-MnO2 nanosheets integrated on NH2 graphene sheets can introduce more active adsorption sites and bring additional interfaces at the hybridized interlayer areas to promote the adsorption process. Moreover, the α-MnO2 integrated on NH2 graphene can potentially tailor the distance between each layer of densely stacked graphene and open up the interlayer space to allow for more Cr6+ ions to adsorb effectively into the hybridized film. Consequently, the hybrid nanostructural design may enhance the adsorption of Cr6+, because it enlarges the specific surface area and improves the distribution channel of graphene. Hierarchically structured α-MnO2–NH2–RGO is obtained by the chemical integration of α-MnO2 nanosheets on NH2 graphene because of the strong electrostatic interaction in the process solution treatment. It is evidenced that the water-exfoliated δ-MnO2 nanosheet is electronegative, and the DMF-exfoliated NH2 graphene is electropositive. The produced composite was characterized by Fourier transform infrared spectrum (FTIR), X-ray diffraction (XRD), transmission electron microscopy (TEM), and the Brunauer–Emmett–Teller (BET) theory. To further evaluate adsorption behaviors, the pH of the Cr6+ solution, contact time and temperature were studied. In addition, the adsorption kinetics model, rate-limiting mechanism and the thermodynamics of the hybrids were also examined.
2. Experimental
2.1 Materials
Natural flake graphite was obtained from Nanyang Boxing Mining Co., Ltd. (China). Other chemicals (analytical grade) were purchased from AiHua Fine Chemicals Co., Ltd. (China) and used as received without any further purification.2.2 Preparation of graphene oxide (GO)
Graphene oxide was synthesized by chemical oxidation in an improved Hummers' method.24 In brief, 500 mg of graphite flakes was added into the mixture of concentrated H2SO4–H3PO4 (60![[thin space (1/6-em)]](https://www.rsc.org/images/entities/char_2009.gif) :
:![[thin space (1/6-em)]](https://www.rsc.org/images/entities/char_2009.gif) 6.7 ml). Then, 3.0 g KMnO4 was slowly added with vigorous stirring and produced a slight exothermic reaction at 35–40 °C. The mixture was stirred vigorously for about 12 h while maintaining a temperature of 323 K. The reaction was then cooled to room temperature and poured into 400 ml of ice with 1.5 ml of 35% hydrogen peroxide aqueous solution. Afterwards, the dispersion was filtered, washed with 200 ml water, HCl and absolute ethanol in succession and finally dried under vacuum conditions. The NH2 graphene was obtained via a hydrothermal method with ethylenediamine.25 Typically, a certain amount of GO was added into the ethanol solution (50 ml) with ultrasonication for 1 h, forming a homogeneous suspension. The ethylenediamine solution was subsequently dropped into the suspension (pH = 12.5) under vigorous stirring. The solution was then sealed in a Teflon-lined, stainless-steel autoclave and placed in an oven at 160 °C for 24 h, and then was cooled to room temperature naturally. The precipitate was collected and washed with deionized water. The yielded product was dried at 80 °C in air for further use.
6.7 ml). Then, 3.0 g KMnO4 was slowly added with vigorous stirring and produced a slight exothermic reaction at 35–40 °C. The mixture was stirred vigorously for about 12 h while maintaining a temperature of 323 K. The reaction was then cooled to room temperature and poured into 400 ml of ice with 1.5 ml of 35% hydrogen peroxide aqueous solution. Afterwards, the dispersion was filtered, washed with 200 ml water, HCl and absolute ethanol in succession and finally dried under vacuum conditions. The NH2 graphene was obtained via a hydrothermal method with ethylenediamine.25 Typically, a certain amount of GO was added into the ethanol solution (50 ml) with ultrasonication for 1 h, forming a homogeneous suspension. The ethylenediamine solution was subsequently dropped into the suspension (pH = 12.5) under vigorous stirring. The solution was then sealed in a Teflon-lined, stainless-steel autoclave and placed in an oven at 160 °C for 24 h, and then was cooled to room temperature naturally. The precipitate was collected and washed with deionized water. The yielded product was dried at 80 °C in air for further use.
The bulk MnO2 was synthesized using a reported method.26 In a typical reaction, 20 ml of a pre-blended solution of 0.6 M tetramethylammonium hydroxide (TMA OH) and 30 wt% hydrogen peroxide were added into 10 ml of 0.3 M MnCl2·4H2O aqueous solution within 15 s. The solution turned dark brown immediately, showing the evidence that Mn2+ was vigorously stirred for 12 h at room temperature. Afterwards, the precipitate was washed with water and methanol and dried in a vacuum oven at 60 °C. In our case, the layered H-type birnessite MnO2 and NH2 graphene can be exfoliated by water and DMF solution. Then, the two solution were mixed and sealed in a Teflon-lined, stainless-steel autoclave and heated at 160 °C for 8 h. The resultant product was washed thoroughly with deionized water and ethanol and dried at 60 °C in an oven.
2.3 Adsorption experiment
Cr6+ was used as an objective pollutant to evaluate the adsorptive performance of the as-prepared materials. Analytical grade potassium dichromate was used to prepare the 1000 mg l−1 stock solution, which was further diluted to the required concentration before use. To investigate the adsorption capacity of the various adsorbents, 0.02 g of different materials were added into 100 ml of a 300 mg l−1 Cr6+ solution at a fixed pH of 2.0. For the equilibrium, the initial Cr6+ concentrations were varied in the range of 50–300 mg l−1. After a specified time, the fixed amounts of the suspension were withdrawn and filtered by 0.45 μm membrane filter for further analysis.The pH effect experiments were performed at the initial Cr6+ concentration of 300 mg l−1 by adjusting the initial pH in the range of 2.0–11.0 using 0.1 mol l−1 HCl and NaOH. Kinetic studies were conducted using 0.1 g α-MnO2–NH2–RGO in 500 ml of the adsorbent solution (100 mg l−1, 200 mg l−1, and 300 mg l−1). Thermodynamic tests were performed at different temperatures (275 K, 298 K, and 328 K) with various solutions ranging from 50 mg l−1 to 300 mg l−1. The adsorbance amount was calculated as follows:
3. Results and discussion
3.1 Characterization of different materials
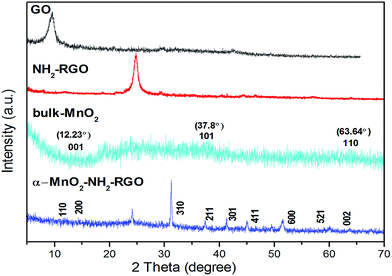
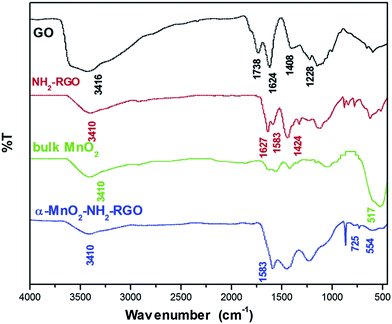
Fig. 1 showed the typical XRD patterns of GO, NH2–RGO, bulk MnO2 and α-MnO2–NH2–RGO, conforming the ultrathin sheet structure of α-type MnO2 on the NH2 graphene. It is apparent that the most intensive peak of GO at around 2θ = 9.8° was in correspondence with the (001) reflection, and the interlayer spacing (0.91 nm) was considerably larger than that of graphite (0.34 nm) because of the introduction of oxygen-containing functional groups on the pristine graphite sheets.27,28 The diffraction peaks of NH2–RGO (25°) explained that the GO was reduced by ethylenediamine. The weak broad peaks of bulk MnO2 at around 12.23°, 37.8°, and 63.64°, corresponding to the (001), (101), and (110) crystal planes of δ-MnO2, showed a low degree of crystallinity. The α-MnO2–NH2–RGO nanocomposite corresponded to the (110), (200), (310), (211), (411) and (521) crystal planes of α-MnO2.29 Hydrothermal treatment facilitated the phase transition from δ-MnO2 to α-MnO2. These findings are in good agreement with the MnO2 crystal growth theory.30,31The FTIR spectra were investigated to affirm the process for the preparation of α-MnO2–NH2–RGO hybrids. From Fig. 2, in the case of GO, the characteristic peaks appearing at 3416 cm−1 and 1408 cm−1 were assigned to the O–H stretching and bending vibrations of intercalated water. The absorption bands of oxygen groups at 1228 cm−1, 1624 cm−1 and 1738 cm−1 were ascribed to the C–OH/C–O–C groups, carbonyl moieties, and C![[double bond, length as m-dash]](https://www.rsc.org/images/entities/char_e001.gif) O stretching of the –COOH, respectively.32 In the FT-IR spectrum of NH2–RGO and α-MnO2–NH2–RGO, the amplitudes of the oxygen-containing functional characteristic bands decrease to a great degree, or the peaks even disappeared. This revealed that the GO was reduced after the hydrothermal treatment. In addition, the new peaks located at 1583 cm−1 of NH2–RGO and α-MnO2–NH2–RGO were ascribed to the stretching vibration of N–H (in the C–NH group).33 Sharp peaks were observed at around 600–500 cm−1, which can be attributed to Mn–O and Mn–O–Mn vibrations in the MnO6 octahedral.34 A new peak at around 725 cm−1 was observed in α-MnO2–NH2–RGO, and it was attributed to the bending vibration of the Mn–O–C bond because of the interactional reaction between carbon and MnO4− ions. These results confirm that an intimate contact exists between graphene and MnO2.35
O stretching of the –COOH, respectively.32 In the FT-IR spectrum of NH2–RGO and α-MnO2–NH2–RGO, the amplitudes of the oxygen-containing functional characteristic bands decrease to a great degree, or the peaks even disappeared. This revealed that the GO was reduced after the hydrothermal treatment. In addition, the new peaks located at 1583 cm−1 of NH2–RGO and α-MnO2–NH2–RGO were ascribed to the stretching vibration of N–H (in the C–NH group).33 Sharp peaks were observed at around 600–500 cm−1, which can be attributed to Mn–O and Mn–O–Mn vibrations in the MnO6 octahedral.34 A new peak at around 725 cm−1 was observed in α-MnO2–NH2–RGO, and it was attributed to the bending vibration of the Mn–O–C bond because of the interactional reaction between carbon and MnO4− ions. These results confirm that an intimate contact exists between graphene and MnO2.35
The morphology of the as-prepared materials was investigated using TEM. Fig. 3a and b show flake-like shapes of GO with wrinkles. Fig. 3c and d show that MnO2 with a sheet-like shape is homogeneously and tightly integrated on the NH2 graphene surfaces, and the ultrathin MnO2 sheets have widths ranging from 10 to 30 nm. It can be observed that the graphene sheets with large areas and flat morphologies served as ideal microscopic substrates to host the α-MnO2 nanosheets (Fig. 3d) for maximum areal utilization. Furthermore, the existence of NH2–RGO and MnO2 in the nanocomposite has been verified by the peaks of C, N, Mn, and O in the EDX analysis, as exhibited in Fig. 3e.
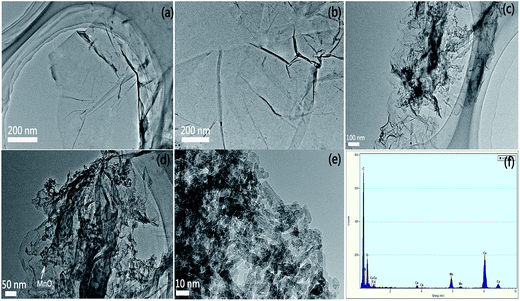 | ||
| Fig. 3 TEM images of (a) GO, (b) NH2–RGO, (c and d) α-MnO2–NH2–RGO, (e) δ-MnO2 sheets, and (f) EDX patterns of α-MnO2–NH2–RGO. | ||
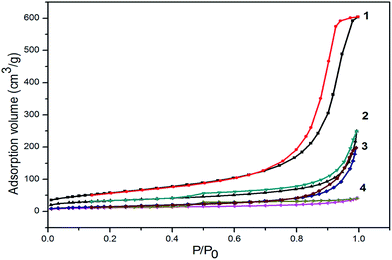
According to the N2 adsorption–desorption isotherms (Fig. 4) of the GO, NH2–RGO, bulk MnO2 and α-MnO2–NH2–RGO, it conformed to the type-IV curves with an H3 hysteresis loop, and the shapes indicated meso- and macro-porous characteristics.36 From Table 1, it can be observed that the α-MnO2–NH2–RGO composite had a higher specific surface area (117 m2 g−1) than that of the GO (41 m2 g−1) and NH2–RGO (57 m2 g−1), but lower than the bulk MnO2 (212 m2 g−1), because the bulk MnO2 was analyzed without exfoliation. The results indicated that ultrathin MnO2 sheets were dispersed on the surface of the NH2–RGO, which can present the aggregation of graphene sheets.35 The α-MnO2–NH2–RGO showed a mesoporous structure with an average pore size of 14.256 nm. The high specific surface area and mesoporous structure of α-MnO2–NH2–RGO make them very promising candidates for the sorption of Cr(VI) in wastewater.
| Materials | Surface area (m2 g−1) | Pore volume (cm3 g−1) | Pore size (nm) |
|---|---|---|---|
| GO | 40.76 | 0.07435 | 5.2689 |
| NH2–RGO | 57.16 | 0.3165 | 20.965 |
| Bulk MnO2 | 211.97 | 1.03948 | 14.537 |
| α-MnO2–NH2–RGO | 117.59 | 0.3904 | 14.256 |
3.2 Adsorption capacities of different materials
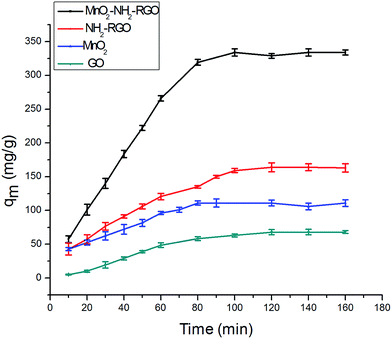
The adsorption capacities of different nanocomposites were discussed, and the results are presented in Fig. 5. The adsorption capacity of NH2–RGO was greater than that of GO, indicating that the amino groups on the NH2–RGO were expected to be the active centers for Cr6+. The adsorption amount of bulk MnO2 is higher than that of GO, because manganese oxides have larger surface areas and higher affinities than GO. The α-MnO2–NH2–RGO nanocomposites were the most effective removal materials, compared with the others, because a greater number of binding sites were provided. The MnO2 loading level on the surface of NH2–RGO was suitable for Cr6+ adsorption, and the morphology of α-MnO2 was uniform and thin, and more binding sites were provided. Thus, the adsorption amounts of various nanocomposites primarily relied on the functional groups, as well as on the morphology of the adsorbent surface.3.3 Effect of pH on Cr6+ adsorption
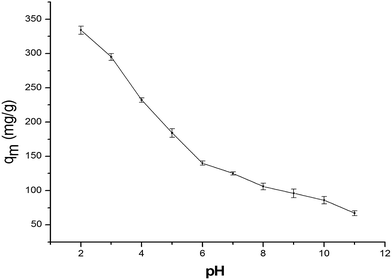
Adjustment of the initial Cr6+ pH value is a crucial parameter, which dominated the adsorption process, particularly the adsorption capacity. This parameter caused a change in the surface charge of the adsorbent, transformation of the chromium species and other ions present in the solution, and the degree of dissociation of functional groups on the active sites of the sorbent.37 From Fig. S8,† we can clearly observe the XRD without any change. Thus, we think that the composite has stability under strong acidic conditions. Fig. 6 shows that the Cr6+ sorption capacity decreases with an increase in pH from 2.0 to 11.0. The Cr6+ species may be represented in an aqueous solution primarily because HCrO4− and Cr2O42− were the predominant species with a pH lower than 6.8, and CrO42− was prime form of Cr6+ when the pH is higher than 6.8.38,39 The uptake of hexavalent chromium at a lower pH indicated that the predominant component (HCrO4−) of Cr6+ necessitated one exchange site from the α-MnO2–NH2–RGO for the adsorption to occur. On the contrary, at high pH, the divalent forms of Cr6+ (Cr2O72−, CrO42−) were almost excited and needed two adsorption sites from the α-MnO2–NH2–RGO to occur for the adsorption.37 Thus, the adsorption amount of α-MnO2–NH2–RGO was considerably larger at lower pH than that at higher pH. Furthermore, the amino groups in α-MnO2–NH2–RGO triggered the protonation and deprotonation due to the interaction mechanism. The reaction in eqn (1) illustrated that the protonation of amino groups enhanced at a low-solution pH, causing the α-MnO2–NH2–RGO surface to be more positively charged, leading to the binding of anionic Cr6+ species strongly. With increasing solution pH, the ability of –NH2 to be protonated weakened, and OH− ions may be adsorbed to the surface of the adsorbent through hydrogen bonds leading to more coulombic repulsion of metals,40| Sur–NH2 + H+ = Sur–NH3+ | (1) |
| Sur–NH2 + OH− = Sur–NH2⋯OH−, | (2) |
| HCrO4− + 7H+ + 3e− ↔ Cr3+ + 4H2O, | (3) |
| Cr2O72− + 6e− + 3H+ ↔ 2Cr3+ + 7H2O. | (4) |
In order to affirm that Cr3+ coexists with Cr6+, we measured the concentration of total chromium and found that Cr3+ exists in the solution. Hydroxyl and carboxyl groups in adsorbents are suspected to bind Cr3+ ions by surface complexation and cation exchange mechanisms.41
In brief, the adsorption of Cr6+ is a complicated process, and the mechanism includes electrostatic attraction and complexation ion exchange.43
3.4 Adsorption isotherm
Adsorption isotherms are the mathematical models that describe the solid–liquid adsorption system. Based on a set of assumptions, isotherms are primarily related to the homogeneity/heterogeneity of adsorbents. In addition, the type of coverage and how adsorbates could interact with the adsorbent are involved. The experimental adsorption equilibrium data were fitted on the Langmuir, Freundlich and Dubinin–Radushkevich (D–R) isotherms to represent the adsorption equilibrium. Fig. 7 shows the adsorption isotherms for Cr6+ on the surface of α-MnO2–NH2–RGO at various temperatures. The Langmuir model is derived from several assumptions, such as the uniform energies of the adsorption site and no transmigration of adsorbates on the surface of materials. The model takes the following linear form:44where qe (mg g−1) was the adsorption capacity at an equilibrium state on adsorbent and qm and b (l mg−1) signified the maximum adsorption amount and the apparent energy of the adsorption, respectively. Ce and C0 (mg l−1) represent the equilibrium concentration and initial concentration of Cr6+, respectively (Fig. S1†). The RL value can demonstrate whether the isothermal type is favorable (0 < RL < 1) or unfavorable (RL > 1). The Freundlich isotherm, which is appreciable to heterogeneous surfaces and multilayer adsorption, is defined as follows:45
where KF (mg g−1 (l mg−1)1/n) and n signified the adsorption capacity and the adsorption intensity, respectively. The Freundlich constants KF and 1/n were obtained from the slope and intercept of the equation process (Fig. S2†). The D–R isotherm was applied to estimate the mean free energy of adsorption (E) in order to confirm whether the process is physical adsorption or chemical adsorption. Dubinin and Radushkevich46 have proposed that the adsorption occurs on a single uniform pore. In this connection, the D–R isotherm is used extensively, because the assumption does not contain the homogeneous surface or similar adsorption energy.47
ln![[thin space (1/6-em)]](https://www.rsc.org/images/entities/char_2009.gif) qe = ln qe = ln![[thin space (1/6-em)]](https://www.rsc.org/images/entities/char_2009.gif) qm − βε2 qm − βε2 |
where β (mol2 kJ−2) is a constant related to sorption mean free energy, and ε is the polony potential (Fig. S3†). The mean free energy of adsorption can be calculated out using the following relationship:
From Table 2, we can see that the hexavalent Cr6+ ions were favorably adsorbed on the α-MnO2–NH2–RGO, and the adsorption amounts of Cr6+ obtained were 333 mg g−1, 350 mg g−1, and 371 mg g−1 at 275 K, 298 K and 328 K, respectively. The sorption amount attained with the α-MnO2–NH2–RGO was considerably higher than that gained with numerous other reported adsorptions. In consideration of the correlation coefficient as a criterion for the goodness of fit in the adsorption process, the Freundlich isothermal adsorption exhibited an improved correlation (R2 = 0.996, 0.993, 0.997) than the Langmuir (R2 = 0.924, 0.928, 0.933) and D–R (R2 = 0.81, 0.85, 0.84) isothermal models, which demonstrated that the Freundlich isothermal adsorption system was more ideal. Table 2 indicates that the adsorption of Cr6+ is a multi-adsorption process, because the Freundlich isothermal adsorption model assumes a multilayer adsorption and the stronger binding sites are occupied first by the adsorbates.48 Furthermore, the KF and n were calculated from Fig. S2.† The values of KF are 34.33, 45.84, and 55.26, whereas n are 2.5, 2.8, and 2.98. The n can be used to predict the adsorption characteristics. For n < 1, the adsorption is unfavorable, n between a value of 1 and 2 adsorption is defined as moderately difficult, and the value of n between 2 and 10 considered as having good adsorption.49 The n determined in our studies represents good adsorption that was in accordance with the larger value of KF. The parameter E (kJ mol−1) indicated the adsorption mechanism, which is physical or chemical. If the magnitude of E is between 8 and 16 kJ mol−1, the adsorption process occurs chemically, whereas the value of E < 8 kJ mol−1 corresponds to a physical adsorption process.50,51 From the calculated value of the mean free adsorption energy, it indicated that the adsorption mechanism of Cr6+ on the α-MnO2–NH2–RGO may be a physical adsorption. However, the D–R isotherm was poorly fitted to the adsorption process with a regression coefficient. Combining with the reference of pseudo-second-order kinetics, it could suggest that the adsorption process may occur by a physical–chemical mechanism.52
| T (K) | Langmuir isotherm | Freundlich isotherm | D–R isotherm | ||||||||
|---|---|---|---|---|---|---|---|---|---|---|---|
| qm | b | r12 | RL | n | KF | r22 | qm | β (mol2 J−2) | E (J mol−1) | r32 | |
| 275 | 333 | 0.0306 | 0.924 | 0.417–0.106 | 2.5 | 34.33 | 0.996 | 257 | 7.61 × 10⁻⁵ | 81 | 0.81 |
| 298 | 350 | 0.0298 | 0.928 | 0.402–0.1 | 2.8 | 45.84 | 0.993 | 284 | 6.27 × 10⁻⁵ | 89 | 0.85 |
| 328 | 371 | 0.0405 | 0.933 | 0.331–0.076 | 2.98 | 55.26 | 0.997 | 302 | 3.97 × 10⁻⁵ | 112 | 0.84 |
3.5 Adsorption kinetics
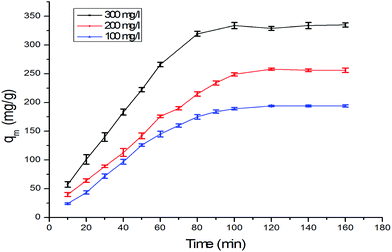
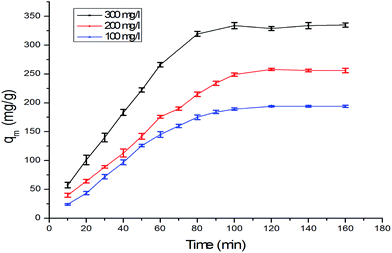
The kinetics of adsorption on the α-MnO2–NH2–RGO for various initial Cr6+ concentrations are shown in Fig. 8. Possible mechanisms can be investigated in accordance with several reaction processes such as chemical, diffusion control and mass-transport kinetics. Pseudo-first-order and pseudo-second-order models and the intraparticle diffusion model were employed to analyze the kinetics of Cr6+ adsorption. The pseudo-first-order model is expressed by the equation as53where qe and qt represented the amount of Cr6+ adsorbed (mg g−1) at the equilibrium time and time t (min), respectively. k1 (min−1) is the rate constant (Fig. S4†). The pseudo-second-order rate equation is given as54
where k2 was the pseudo-second-order rate constant, and qe, qt and t had the same definitions as those in the pseudo-first-order kinetics equation (Fig. S5†). The initial adsorption rate h (mg g−1 min)55 is expressed in the following manner:
| h = kqe2. |
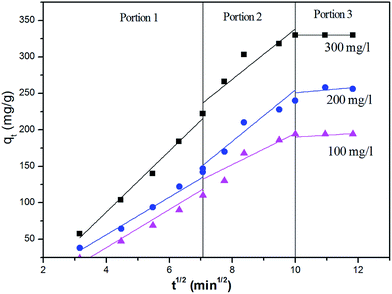
The intra-particle diffusion model is given as56
| qt = kpt0.5 + c, |
| C0 (mg l−1) | qe.exp | Pseudo-first-order kinetic model | Pseudo-second-order kinetic model | |||||
|---|---|---|---|---|---|---|---|---|
| k1 | qe | r12 | k2 | qe ( × 10−4) | h | r22 | ||
| 100 | 194 | 0.0303 | 275 | 0.85 | 1.20 | 209 | 5.24 | 0.993 |
| 200 | 256 | 0.026 | 325 | 0.94 | 1.23 | 261 | 8.38 | 0.995 |
| 300 | 334 | 0.0352 | 398 | 0.95 | 1.32 | 346 | 15.8 | 0.994 |
 | ||
| Fig. 9 Weber–Morris plots for the kinetic modeling of Cr6+ adsorbed onto α-MnO2–NH2–RGO at various temperatures. | ||
3.6 Thermodynamic studies
Thermodynamic parameters provide in-depth information about internal energy changes that are associated with adsorption. The adsorption standard Gibbs free energy changes (ΔG°), the average standard enthalpy change (ΔH°), and the standard entropy charge (ΔS°) can be obtained from the thermodynamic equilibrium constant K0 with a change in the temperature of the Cr6+ adsorption onto α-MnO2–NH2–RGO to evaluate the adsorption process. K0 is calculated as follows:59
 | (1) |
 | (2) |
ΔG° = −RT![[thin space (1/6-em)]](https://www.rsc.org/images/entities/char_2009.gif) ln ln![[thin space (1/6-em)]](https://www.rsc.org/images/entities/char_2009.gif) K0, K0, |
![[thin space (1/6-em)]](https://www.rsc.org/images/entities/char_2009.gif) K0 versus 1/T (Fig. S7†) using the following equation60
K0 versus 1/T (Fig. S7†) using the following equation60Thermodynamic parameters are listed in Table 4. The negative values of ΔG° demonstrate that the adsorption process was spontaneous. In addition, with increased temperature, the ΔG° value becomes more negative, revealing that higher temperature facilitated the spontaneity due to a greater driving force of adsorption or activation of the adsorbent surface.61 The calculated ΔG° values suggest that the adsorption process was primarily a physical process. However, chemical adsorptions may also occur because the calculated value of ΔG° range from 20 kJ mol−1 to 80 kJ mol−1, which is the process in which physical adsorption combines with the chemical adsorption. The obtained result was in good agreement with the result found with the D–R isotherm. The positive value of ΔH° revealed that the interaction of Cr6+ adsorbed by α-MnO2–NH2–RGO was an endothermic process. The positive cause was that the metal ions are well hydrated and will need breaking of the hydration bond to facilitate adsorption, which consequently requires higher energy. Thus, higher temperatures accelerate the dehydration process. The positive standard change (ΔS°) suggested an increased disorder at the solid–solution interface.62
| T (K) | ln![[thin space (1/6-em)]](https://www.rsc.org/images/entities/char_2009.gif) K0 K0 |
ΔG° (kJ mol−1) | R2 | ΔH° (kJ mol−1) | ΔS° (J mol−1 K−1) | R2 |
|---|---|---|---|---|---|---|
| 275 | 9.525 | 21.78 | 0.969 | 6.73 | 103.7 | 0.996 |
| 298 | 9.746 | 24.15 | 0.991 | |||
| 328 | 10.01 | 27.29 | 0.992 |
3.7 Regeneration of α-MnO2–NH2–RGO
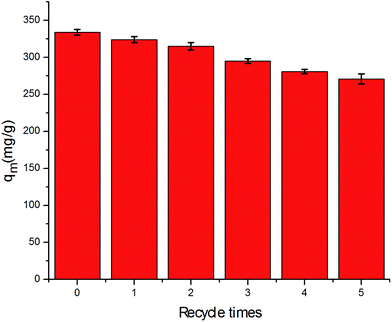
From a practical/industrial point view, the recycling and the reuse of the adsorbent is an economic necessity. Considering that the nanocomposites showed poor adsorption ability at high pH, alkaline condition treatment is likely to be a suitable method for the regeneration of α-MnO2–NH2–RGO. Thus, a 0.1 M NaOH solution was used, and the adsorption–desorption cycles were replicated five times using the same batch of α-MnO2–NH2–RGO (Fig. 10). The as-prepared composite still exhibited more than 81% adsorption capacity after five cycles of reuse, indicating that α-MnO2–NH2–RGO possess good regeneration and reusability for Cr6+ adsorption. This was consistent with the abovementioned result that higher pH depressed the adsorption of Cr6+, but was beneficial for its recovery.3.8 Adsorption mechanism
The Cr6+ sorption of the α-MnO2–NH2–RGO might primarily occur via the electrostatic attraction route in the early stage, whereas it became chemical adsorption via the covalent bonding route in the late stage.26 In an aqueous solution, Cr6+ ions exist in the forms of Cr2O72− and HCrO4−, and the amine groups on the sorbent were protonated in order to form surface complexes with the chromium species via electrostatic attraction, which explains the pH effect on the adsorption (Fig. 6). Moreover, the foremost sorption group was MnO2, because the sorption amount of α-MnO2–NH2–RGO was better than that of NH2–RGO (Fig. 5). The MnO2 was amphoteric and can feature with weak acidic or weak basal characteristics. The protonation and deprotonation of the oxide surface was controlled by the pH of the Cr6+ solution. Therefore, when the pH was low, the MnO2 could be efficiently protonated from![[double bond, length as m-dash]](https://www.rsc.org/images/entities/char_e001.gif) MnOH with a positive charge,63 and an anion HCrO4− could thus be bound through electrostatic attraction. In addition, the redox reactions may proceed either sequentially and/or in parallel, particularly under acidic conditions. Furthermore, an ion exchange would occur among Cr2O72−, HCrO4−, and OH− on the α-MnO2–NH2–RGO generating the ion exchange, thereby constituting the adsorption mechanism.64
MnOH with a positive charge,63 and an anion HCrO4− could thus be bound through electrostatic attraction. In addition, the redox reactions may proceed either sequentially and/or in parallel, particularly under acidic conditions. Furthermore, an ion exchange would occur among Cr2O72−, HCrO4−, and OH− on the α-MnO2–NH2–RGO generating the ion exchange, thereby constituting the adsorption mechanism.64
3.9 Comparison of adsorbent performance with literature data
To evaluate the effectiveness of α-MnO2–NH2–RGO as a potential adsorption for Cr(VI), the maximum adsorption capacity qm was compared with those of other adsorbents reported previously. From Table 5, the maximum adsorption amount of α-MnO2–NH2–RGO was higher than the values of graphene/MgAl, monodisperse Fe3O4, iron nanoparticle-decorated graphene, Fe3O4–graphene, and several surface-modified MnO2 nanoparticles such as MnO2, manganese oxide nanofibers, MnO2-modified expanded graphite, MnO2 nanowires-diatomite, and MnO2/Fe3O4/o-MuCNTs, but lower than polyethyleneimine–graphene oxide (GO) and UV-active functionalized graphene oxide. Compared with the MnO2, manganese oxide nanofibers, MnO2-modified expanded graphite and MnO2/Fe3O4/o-MWCNTs, the α-MnO2–NH2–RGO displayed a higher surface area, which could provide more active adsorption sites. Moreover, the crystallization of MnO2 thin films on the surface of RGO also generated more active oxygen, and the resultant interface contributed to the excellent adsorption. Moreover, the introduction of functional groups, particularly metal oxide and amino groups, can enhance the adsorption capacity and dispersion of graphene. It is noteworthy that α-MnO2–NH2–RGO is very stable under acidic conditions. For the aforementioned reasons, α-MnO2–NH2–RGO can be considered a promising absorbent for the effective removal of Cr(VI).| Adsorbates | Adsorbents | qmax (mg g−1) | Ref. |
|---|---|---|---|
| Cr6+ | Calcined graphene/MgAl-layered double hydroxides | 177.6 | 65 |
| Amine-grafted alumino–siloxane hybrid | 48.96 | 66 | |
| 40% aliquat 336/60% PVC PIM | 50.85 | 67 | |
| MnO2 | 51.996 | 68 | |
| Manganese oxide nanofibers | 11.8 | 69 | |
| High saturation magnetization monodisperse Fe3O4 hollow microsphere | 180 | 70 | |
| MnO2-modified expanded graphite | 0.3011 | 71 | |
| Iron nanoparticle-decorated graphene | 162 | 72 | |
| MnO2 nanowires in situ grown on diatomite | 197.6 | 30 | |
| MnO2/Fe3O4/o-MWCNTs | 186.9 | 73 | |
| Graphene oxide | 65.2 | 10 | |
| Iron nanoparticle decorated graphene | 162 | 74 | |
| Polyethyleneimine–graphene oxide (GO) | 539.5 | 75 | |
| UV-active functionalized-graphene oxide | 393.8 | 76 | |
| α-MnO2–NH2–RGO | 371 | Present work |
4. Conclusion
In summary, we have fabricated for the first time a novel, high-performance adsorbent by chemically integrating α-MnO2 nanosheets on NH2 graphene due to strong electrostatic interaction. The results exhibited that the adsorption capacity was strongly dependent on the pH and initial Cr6+ concentrations, the adsorption data were found to fit well with the Freundlich isotherm model. The adsorption equilibrium was achieved within 100 min, and the maximum adsorption capacity was 371 mg g−1. The adsorption kinetics was found to follow the pseudo-second-order equation. By calculating the thermodynamic parameters, it indicated that the adsorption process was spontaneous and exothermic. The D–R model showed that sorption had a physical–chemical nature. The adsorption capacity of α-MnO2–NH2–RGO can remain as high as 81% after five cycles of usage. The results obtained in this study illustrated that the α-MnO2–NH2–RGO is expected to be an effective and economical adsorbent for Cr(VI) removal from an aqueous system.Acknowledgements
We thank classmates for giving many suggestions on this work.References
- J. Johnson, L. C. Wel and A. E. Graedel, Environ. Sci. Technol., 2006, 40, 7060–7069 CrossRef CAS.
- Y. P. Huang, H. Ma, S. G. Wang, M. W. Shen, R. Guo, X. Y. Cao, M. F. Zhu and X. Y. Shi, ACS Appl. Mater. Interfaces, 2012, 4, 3054–3061 CAS.
- W. J. Jiang, M. Pelaez, D. D. Dionysiou, M. H. Entezari, D. Tsoutsou and K. O'Shea, Chem. Eng. J., 2013, 222, 527–533 CrossRef CAS PubMed.
- K. G. Bhattacharyya and S. S. Gupta, Ind. Eng. Chem. Res., 2006, 45, 7232–7240 CrossRef CAS.
- D. H. Thomas, J. S. Rohrer, P. E. Jackson, T. Pak and J. N. Scott, J. Chromatogr. A, 2002, 956, 255–259 CrossRef CAS.
- S. Rengaraj, C. K. Joo, Y. H. Kim and J. Yi, J. Hazard. Mater., 2003, 102, 257–275 CrossRef CAS.
- N. M. Lee, H. Carlsson, H. Aspegren, T. Welander and B. Andersson, Water Sci. Technol., 1996, 34, 101–109 CrossRef CAS.
- A. Hafez and S. El-Manharawy, Desalination, 2004, 165, 141–151 CrossRef CAS PubMed.
- D. Zhang, S. Y. Wei, C. D. Kaila, X. Su, J. Wu, A. B. Karki, D. P. Young and Z. H. Guo, Nanoscale, 2010, 2, 917–919 RSC.
- L. Fan, C. N. Luo, M. Sun and H. M. Qiu, J. Mater. Chem., 2010, 22, 24577–24583 RSC.
- L. L. Fan, C. N. Luo, M. Sun and H. M. Qiu, J. Mater. Chem., 2012, 22, 24577–24583 RSC.
- P. Y. Dong, Y. H. Wang, L. N. Guo, B. Liu, S. Y. Xin, J. Zhang, Y. R. Shi, W. Zeng and S. Yin, Nanoscale, 2012, 4, 4641–4649 RSC.
- K. P. Loh, Q. L. Bao, P. K. Ang and J. X. Yang, J. Mater. Chem., 2010, 20, 2277–2289 RSC.
- J. W. Qin, M. H. Cao, N. Li and C. W. Hu, J. Mater. Chem., 2011, 21, 17167–17174 RSC.
- X. Y. Yan, X. L. Tong, Y. F. Zhang, X. D. Han, Y. Y. Wang, G. Q. Jin, Y. Qin and X. Y. Guo, Chem. Commun., 2012, 48, 1892–1894 RSC.
- B. J. Li, H. Q. Cao and G. Yin, J. Mater. Chem., 2011, 21, 13765–13768 RSC.
- M. Willander, K. U. Hasan, O. Nur, A. Zainelabdin, S. Zaman and G. Amin, J. Mater. Chem., 2012, 22, 2337–2350 RSC.
- B. J. Li, H. Q. Cao, G. Yin, Y. X. Lu and J. F. Yin, J. Mater. Chem., 2011, 21, 10645–10648 RSC.
- Y. H. Xue, H. Chen, D. S. Yu, S. Y. Wang, M. Yardeni, Q. B. Dai, M. M. Guo, Y. Liu, F. Lu, J. Qu and L. M. Dai, Chem. Commun., 2011, 47, 11689–11691 RSC.
- E. J. Kim, C. S. Lee, Y. Y. Chang and Y. S. Chang, ACS Appl. Mater. Interfaces, 2013, 5, 9628–9634 CAS.
- R. P. Han, W. H. Zou, H. K. Li, Y. H. Li and J. Shi, J. Hazard. Mater., 2006, 102, 934–942 CrossRef PubMed.
- R. P. Han, W. H. Zou, Z. P. Zhang, J. Shi and J. J. Yang, J. Hazard. Mater., 2006, 137, 384–395 CrossRef CAS PubMed.
- Z. W. Zhao, J. Liu, F. Y. Cui, H. Feng and L. L. Zhang, J. Mater. Chem., 2012, 22, 9052–9057 RSC.
- D. C. Marcano, D. V. Kosynkin, J. M. Berlin, A. Sinitskii, Z. Z. Sun, A. Slesarev, L. B. Alemany, W. Lu and J. M. Tour, ACS Nano, 2010, 4, 4806–4814 CrossRef CAS PubMed.
- L. Zhang, H. Z. Li, Y. Liu, Z. Tian, B. Yang, Z. B. Sun and S. Q. Yan, RSC Adv., 2014, 4, 48703–48711 RSC.
- L. L. Peng, X. Peng, B. R. Liu, C. Z. Wu, Y. Xie and G. H. Yu, Nano Lett., 2013, 13, 2151–2157 CrossRef CAS PubMed.
- S. Chen, J. W. Zhu, X. D. Wu, Q. F. Han and X. Wang, ACS Nano, 2010, 4, 2822–2830 CrossRef CAS PubMed.
- C. Xu, X. D. Wu, J. W. Zhu and X. Wang, Carbon, 2007, 46, 386–389 CrossRef PubMed.
- JCPDS 00-044-0141.
- Y. C. Du, G. W. Zheng, J. S. Wang, L. P. Wang, J. S. Wu and H. X. Dai, Microporous Mesoporous Mater., 2014, 200, 27–34 CrossRef CAS PubMed.
- X. L. Huang, N. T. Hu, R. G. Gao, Y. Yu, Y. Y. Wang, Z. Yang, E. Siu, W. Kong, H. Wei and Y. F. Zhang, J. Mater. Chem., 2012, 22, 22488–22495 RSC.
- Y. Liu, R. J. Deng, Z. Wang and H. T. Liu, J. Mater. Chem., 2012, 22, 13619–13624 RSC.
- A. B. Yuan and Q. L. Zhang, Electrochem. Commun., 2006, 8, 1173–1178 CrossRef CAS PubMed.
- M. C. Hu, K. S. Hui and K. N. Hui, Chem. Eng. J., 2014, 254, 237–244 CrossRef CAS PubMed.
- G. D. Jiang, Z. F. Lin, C. Chen, L. H. Zhu, Q. Chang, N. Wang, W. Wei and H. Q. Tang, Carbon, 2011, 49, 2693–2701 CrossRef CAS PubMed.
- M. S. Hosseini, A. H. Bandegharaei, H. Raissi and F. Belador, J. Hazard. Mater., 2009, 169, 52–57 CrossRef CAS PubMed.
- L. Tang, Y. Fang, Y. Pang, G. M. Zeng, J. J. Wang, Y. Y. Zhou, Y. Y. Deng, G. D. Yang, Y. Cai and J. Chen, Chem. Eng. J., 2014, 254, 302–312 CrossRef CAS PubMed.
- Y. Pang, G. M. Zeng, L. Tang, Y. Zhang, Y. Y. Liu, X. X. Lei, Z. Li, J. C. Zhang, Z. F. Liu and Y. Q. Xiong, Chem. Eng. J., 2011, 175, 222–227 CrossRef CAS PubMed.
- A. M. Yusof and N. A. N. N. Malek, J. Hazard. Mater., 2009, 162, 1019–1024 CrossRef CAS PubMed.
- Q. Q. Zhong, Q. Y. Yue, B. Y. Gao, Q. Li and X. Xu, Chem. Eng. J., 2013, 229, 90–98 CrossRef CAS PubMed.
- J. Hu, C. L. Chen, X. X. Zhu and X. K. Wang, J. Hazard. Mater., 2009, 162, 1542–1550 CrossRef CAS PubMed.
- G. R. Xu, J. N. Wang and C. J. Li, Chem. Eng. J., 2012, 198–199, 310–317 CrossRef CAS PubMed.
- J. Anandkumar and B. Mandal, J. Hazard. Mater., 2009, 168, 633–640 CrossRef CAS PubMed.
- A. Kurniawan, H. Sutiono, N. Indraswati and S. Ismadji, Chem. Eng. J., 2012, 189–190, 264–274 CrossRef CAS PubMed.
- M. Brdar, M. Šćiban, A. Takači and T. Došenović, Chem. Eng. J., 2012, 183, 108–111 CrossRef CAS PubMed.
- N. D. Hutso and R. T. Yang, Adsorption, 1997, 3, 189–195 CrossRef.
- N. Ünlü and M. Ersoz, J. Hazard. Mater., 2006, 136, 272–280 CrossRef PubMed.
- S. Haider and S. Y. Park, J. Membr. Sci., 2009, 328, 90–96 CrossRef CAS PubMed.
- M. Atienza-Martínez, I. Fonts, J. Ábrego, J. Ceamanos and G. Gea, Chem. Eng. J., 2013, 222, 534–545 CrossRef PubMed.
- I. Kiran, T. Akar, A. S. Ozcan, A. Ozcan and S. Tunali, Biochem. Eng. J., 2006, 31, 197–203 CrossRef CAS PubMed.
- M. S. Onyango, Y. Kojima, O. Aoyi, E. C. Bernardo and H. Matsuda, J. Colloid Interface Sci., 2004, 279, 341–350 CrossRef CAS PubMed.
- F. Raji and M. Pakizeh, Appl. Surf. Sci., 2013, 282, 415 CrossRef CAS PubMed.
- M. Chairat, S. W. Rattanaphani, J. B. Bremnerc and V. Rattanaphani, Dyes Pigm., 2008, 76, 435–439 CrossRef CAS PubMed.
- Y. S. Ho and G. McKay, Process Biochem., 1999, 34, 451–465 CrossRef CAS.
- E. Demirbas, N. Dizge, M. T. Sulak and M. Kobya, Chem. Eng. J., 2009, 148, 480–487 CrossRef CAS PubMed.
- N. Li, Z. Mei and X. Wei, Chem. Eng. J., 2012, 192, 138–145 CrossRef CAS PubMed.
- R. Sitko, E. Turek, B. Zawisza, E. Malicka, E. Talik, J. Heimann, A. Gagor, B. Feist and R. Wrzalik, Dalton Trans., 2013, 5682–5689 RSC.
- Q. Q. Zhong, Q. Q. Yue, Q. Li, B. Y. Gao and X. Xu, Carbohydr. Polym., 2014, 111, 788–796 CrossRef CAS PubMed.
- R. Niwas, U. Gupta, A. A. Khan and K. G. Varshney, Colloids Surf., A, 2000, 164, 115–119 CrossRef CAS.
- L. Ai, C. Y. Zhang and Z. L. Chen, J. Hazard. Mater., 2011, 192, 1515–1524 CrossRef CAS PubMed.
- R. P. Han, Z. Lu, W. H. Zou, D. T. Wang, J. Shi and J. J. Yang, J. Hazard. Mater., 2006, 137, 480–488 CrossRef CAS PubMed.
- M. Bhaumik, A. Maity, V. V. Srinivasu and M. S. Onyango, J. Hazard. Mater., 2011, 190, 381–390 CrossRef CAS PubMed.
- R. P. Han, W. H. Zou, Z. P. Zhang, J. Shi and J. J. Yang, J. Hazard. Mater., 2006, 137, 384–395 CrossRef CAS PubMed.
- X. F. Sun, Y. Ma, X. W. Liu, S. G. Wang, B. Y. Gao and X. M. Li, Water Res., 2010, 44, 2517–2524 CrossRef CAS PubMed.
- X. Y. Yuan, Y. F. Wang, J. Wang, C. Zhou, Q. Tang and X. B. Rao, Chem. Eng. J., 2013, 221, 204–213 CrossRef CAS PubMed.
- V. Linsha, P. S. Suchithra, A. P. Mohamed and S. Ananthakumar, Chem. Eng. J., 2013, 220, 244–253 CrossRef CAS PubMed.
- C. V. Gherasim and G. Bourceanu, Chem. Eng. J., 2013, 220, 24–34 CrossRef CAS PubMed.
- C. Noubactep, K. B. D. Btatkeu and J. B. Tchatchueng, Chem. Eng. J., 2011, 178, 78–84 CrossRef CAS PubMed.
- A. H. Qusti, J. Ind. Eng. Chem., 2014, 20, 3394–3399 CrossRef CAS PubMed.
- Y. B. Liu, Y. Q. Wang, S. M. Zhou, S. Y. Lou, L. Yuan, T. Gao, X. P. Wu, X. J. Shi and K. Wang, ACS Appl. Mater. Interfaces, 2012, 4, 4913–4920 CAS.
- H. Y. Jin, J. Yuan, H. Y. Hao, Z. J. Ji, M. Liu and S. Hou, Mater. Lett., 2013, 110, 69–72 CrossRef CAS PubMed.
- H. Jabeen, V. Chandra, S. Jung, J. W. Lee, K. S. Kim and S. B. Kim, Nanoscale, 2011, 3, 3583–3585 RSC.
- C. Luo, Z. Tian, B. Yang, L. Zhang and S. Q. Yan, Chem. Eng. J., 2013, 224, 256–265 CrossRef PubMed.
- H. Jabeen, V. Chandra, S. Jung, J. W. Lee, K. S. Kim and S. B. Kim, Nanoscale, 2011, 3, 3583–3585 RSC.
- J. H. Chen, H. T. Xing, H. X. Guo, W. Weng, S. R. Hu, S. X. Li, Y. H. Huang, X. Sun and Z. B. Su, J. Mater. Chem. A, 2014, 2, 12561–12570 CAS.
- D. Dinda, A. Gupta and S. K. Saha, J. Mater. Chem. A, 2013, 1, 11221–11228 CAS.
Footnote |
| † Electronic supplementary information (ESI) available. See DOI: 10.1039/c5ra04545b |
| This journal is © The Royal Society of Chemistry 2015 |


