Impact of particle surface chemistry on the structure and rheological properties of graphene-based particle/polydimethylsiloxane composites

Ran Niuab, Jiang Gongab, Donghua Xu*a, Tao Tanga and Zhao-Yan Sun*a
aState Key Laboratory of Polymer Physics and Chemistry, Changchun Institute of Applied Chemistry, Chinese Academy of Sciences, Changchun 130022, P. R. China. E-mail: dhxu@ciac.ac.cn; zysun@ciac.ac.cn; Fax: +86 043185262969; Tel: +86 043185262896
bUniversity of Chinese Academy of Sciences, Beijing 100039, P. R. China

Received 12th March 2015 , Accepted 8th April 2015

First published on 9th April 2015


Abstract

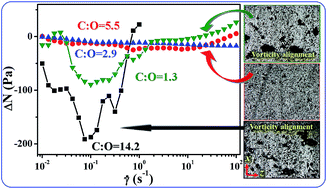
The structure and rheological properties of graphene-based particle (GP-x)/polydimethylsiloxane (PDMS) composites are investigated as the surface oxygen content of graphene-based particle is varied, i.e., from 6.6% (GP-1) to 15.3% (GP-2), 25.5% (GP-3) and 43.1% (GP-4). Interestingly, the dispersion state of graphene-based particles in PDMS does not change monotonically with increasing surface oxygen content. The size of layered stacks and aggregates first decreases from GP-1 to GP-3 and then increases from GP-3 to GP-4 with increasing surface oxygen content. The larger size of layered stacks and aggregates in GP-1 and GP-4 suspensions results from strong inter-particle π–π and hydrogen bonding interactions. Under weak shear, GP-1 and GP-4 form larger aggregates in PDMS, which align along the vorticity direction, inducing negative normal stress differences (ΔN) in the composites. However, GP-2 and GP-3 do not further aggregate under weak shear and the ΔN is almost zero. It is further inferred that the strong inter-particle attractive interaction leads to the vorticity alignment of aggregates under weak shear.

1 Introduction

Polymer nanocomposites based on organic fillers, such as carbon black and carbon nanotubes, have been used to improve the mechanical, electrical, thermal, and gas barrier properties of polymers.1,2 Recently, graphene-based particle/polymer composites have received significant attention due to the dramatic multifunctional property enhancements observed in these systems.3,4

In recent investigations, the most commonly used graphene-based particle is graphene oxide (GO), which is derived from the oxidation of graphite.5 GO has many surface oxygen-containing functional groups (e.g. carboxyl groups, hydroxyl groups), which facilitate the dispersion of GO in polar polymers.6–8 GO can be reduced by chemical reductants, thermal shocking or microwave irradiation to recover the high conductivity and mechanical strength of graphite.9–11 Due to the lack of surface functional groups and strong inter-particle π–π attractive interaction, reduced graphene oxide or graphene generally disperses badly in polymers.12,13 To avoid aggregation of reduced graphene oxide platelets, GO was often dispersed in polymers and in situ reduced by thermal treatment or reductants.8,14,15 By controlling the reduction condition or time, reduced graphene oxide with different contents of surface oxygen-containing groups can be obtained. To the best of our knowledge, the influence of surface chemistry of graphene-based particles on the aggregation structure of graphene-based particle/polymer composites has not been well explored.

Understanding the rheological properties of nanoparticle/polymer composites is of vital importance in optimizing the processing method and broadening their applications. One of the surprising rheological phenomena observed in soft condensed matter is the negative normal stress differences (ΔN).7,16–20 This nonlinear transport property was reported to be accompanied with die-shrinkage rather than die-swell during extrusion processing of multiwall nanotube (MWNT) composites.17 Recently, negative ΔN was reported in partially reduced graphene oxide/polycarbonate composites.21 In our previous work, negative ΔN was observed in GO/low molecular weight polydimethylsiloxane (PDMS) (below the critical entanglement molecular weight Mc) composites.7 However, the rheological properties of highly reduced graphene oxide are still lacking. More importantly, few studies have addressed the influence of surface chemistry of graphene-based particle on the rheological properties, especially ΔN, of polymer composites.8

In this work, graphene-based particles with different surface chemistries were synthesized and then mixed with low molecular weight (Mw) PDMS (below Mc) by solvent mixing. The influence of surface chemistry of graphene-based particles on the dispersion state, linear viscoelasticity and nonlinear rheological properties of graphene-based particle/PDMS composites is systematically investigated. As a comparison, the influence of molecular weight of PDMS (Mw > Mc) on the structure and rheological properties of graphene-based particle composites is also explored and the results are provided in the ESI.

2 Experimental part

2.1 Materials and preparation of samples

Graphene oxide was synthesized from natural graphite (Sinopharm Chemical Reagent Co., Ltd) by the modified Hummer's method22 including two steps of oxidation, with 45 mL concentrated sulfuric acid per 20 g graphite and 12 h oxidation time at 98 °C in the pre-oxidation step. The synthesized graphene oxide suspension was diluted, centrifuged, washed with distilled water and then dried, denominated as GP-4. GP-3 was prepared by the classical modified Hummer's method22 with oxidation time at 98 °C of 6 h and purified using the same procedure with GP-4. GP-2 was prepared by dispersing GP-3 in distilled water by sonication and chemically reducing GP-3 with hydrazine hydrate.23 After purification and drying, GP-2 was thermally reduced in CVD oven by H2 (30 mL min−1) under the protection of Ar (30 mL min−1) at 1050 °C for 15 min, and the obtained product was termed as GP-1.

Trimethyl-terminated polydimethylsiloxane (PDMS) with molecular weight (Mw) of 28[thin space (1/6-em)]000 and 117[thin space (1/6-em)]000 g mol−1 were supplied from Alfa Aesar, termed as P28 and P117, respectively. The critical entanglement molecular weight (Mc) of PDMS was reported to be ∼31[thin space (1/6-em)]000 g mol−1.24 The results of graphene-based particle/P117 are shown in the ESI for comparison.

Samples were prepared by following method. Graphene-based particles were dispersed in tetrahydrofuran (THF, 0.5 wt%) by stirring for 2 h followed by sonication for 12 h. PDMS dispersed in the same solvent was mixed with different volume of graphene-based particle suspension to get desired concentration of graphene-based particle in PDMS. Then the mixtures were stirred for 30 min, dried in the atmosphere for 6 h and further dried in a vacuum oven at 40 °C for 20 h to remove residual solvent.

2.2 Characterization

The morphology of original graphene-based particles was observed by transmission electron microscope (TEM, JEM-1011) at an accelerating voltage of 100 kV. The morphology of graphene-based particle suspensions was also observed by TEM.

The surface element composition of obtained graphene-based particles was characterized by X-ray photoelectron spectroscopy (XPS) carried out on a VG ESCALAB MK II spectrometer using an Al Kα exciting radiation from an X-ray source operated at 10.0 kV and 10 mA.

Thermal gravimetric analysis (TGA) was performed using TA Instruments SDT Q600 at a heating rate of 10 °C min−1 under air atmosphere.

Wide-angle X-ray diffraction (WAXD) experiments of samples were carried out with a Rigaku model D max 2500 with a Cu Kα radiation.

Small-angle X-ray scattering (SAXS) experiments were carried out with the aid of a semiconductor detector (Pilatus 100K, DECTRIS, Swiss) attached to a conventional Ni-filtered Cu Kα X-ray source (GeniX3D Cu ULD, Xencos SA, France). The wavelength of the X-ray radiation is 0.154 nm. The sample-to-detector distance is 6000 mm, where the effective range of the scattering vector q (q = 4π/λ[thin space (1/6-em)]sin[thin space (1/6-em)]θ, where 2θ is the scattering angle and λ is the wavelength) is 0.02–0.2 Å−1. Each SAXS pattern obtained in the center of the sample was collected within 60 min; background was corrected and normalized using the standard procedure.

The microscopic dispersion state of graphene-based particles in PDMS was observed by an Olympus BX-51 optical microscope. Optical observation under shear was carried out using optical microscope equipped with a Linkam CSS-450 shearing cell. Optical micrographs were taken in the xz plane with flow along the x axis, a constant velocity gradient along the y axis, and vorticity along the z axis. Samples were confined between two parallel quartz plates separated by a fixed gap (150 μm). The lower plate rotates at an angular speed that sets the shear rate, [small gamma, Greek, dot above] = ∂vx/∂y, and a fixed point is used for observation. The samples were sheared at constant shear rates for 2 min to explore the structural change during shear. All the optical observations were carried out at 25 °C.

Rheological measurements were performed on ARES G2 (TA instruments, strain controlled rheometer) with 25 mm parallel-plate and cone-plate geometries. Most of the experiments were carried out with 25 mm parallel-plate geometry. Oscillatory strain sweep experiments were conducted to determine the linear viscoelastic region. Linear oscillatory frequency sweeps (0.05 to 100 rad s−1) were performed at appropriate strain in the linear region. Steady shear experiments were carried out in the shear rate range of 0.01–100 s−1. The normal stress measured by parallel-plate geometry is a difference of the normal stress differences, ΔN = N1N2 (N1 and N2 are the first and second normal stress differences). To confirm the sign of N1, a typical sample is measured by cone-plate geometry. The normal stresses measured by parallel-plate geometry (ΔN) and cone-plate geometry (N1) are very close (Fig. S1 in the ESI), indicating that the value of N2 is small and can be neglected in this work. The condition for steady shear experiments was that the maximum equilibration time for each data point was set to be 120 s, with a sampling time of 10 s and a torque tolerance of 5%. Actually, the steady state of torque value was reached within 80 s for all the samples.16 All the experiments were conducted at 25 °C.

3 Results

3.1 Morphology and characterization of graphene-based particles

The morphology of graphene-based particles was observed by TEM. As shown in Fig. 1, graphene-based particles are thin and crumpled platelets where many corrugations are discernable, implying that the reduction process does not affect the crumpled morphology of graphene-based particles.23,25
image file: c5ra04364f-f1.tif
Fig. 1 TEM images of GP-1 (a), GP-2 (b), GP-3 (c) and GP-4 (d).

To quantitatively elucidate the contents of oxygen atom on the surface of graphene-based particles, the XPS spectra of samples are analyzed as shown in Fig. 2a. The spectra show that the ratio of C to O atoms is 14.2, 5.5, 2.9 and 1.3 for GP-1, GP-2, GP-3 and GP-4, respectively, which means that the surface oxygen content of samples increases from GP-1 to GP-4. The higher oxygen content is expected to be accompanied with more sp3 carbon26 and more hydrophilic functional groups.7


image file: c5ra04364f-f2.tif
Fig. 2 XPS spectra (a), TGA curves (b) and WAXD patterns (c) of graphene-based particles.

The difference in surface chemistry of graphene-based particles is also reflected in the thermal behaviors. In the TGA curves (Fig. 2b), GP-1 starts to lose weight at about 490 °C, which is mainly attributed to the carbon oxidation.27,28 Comparatively, there are two major loss of mass for GP-2, GP-3 and GP-4 particles. The weight loss at low temperature (<200 °C) results from the removal of oxygen containing groups, while the weight loss at high temperature comes from the carbon oxidation.3,27,28 As the carbon oxidation temperature decreases from GP-1 to GP-4, it is apparent that the thermal stability decreases with the increase of oxygen content of graphene-based particles. Furthermore, the residue of all the graphene-based particles is almost zero, suggesting the high purity.

WAXD allows us to detect the interlayer distance between graphene-based particles. In WAXD patterns (Fig. 2c), original GP-4 shows a diffraction peak at ∼10.7° originating from the interlayer (002) spacing (d ≅ 0.82 nm) of graphene oxide sheets.7 GP-3 and GP-2 show two broad diffraction peaks at ∼12.7° and ∼25.5°, indicating some regularity of graphene oxide sheets with less oxygen containing groups and graphite sheets, respectively.5,29 With further decrease of the surface oxygen content, a sharp diffraction peak at ∼27.1° appears for GP-1, corresponding to the interlayer (002) spacing of graphite (d ≅ 0.33 nm).

3.2 Structure of graphene-based particle/PDMS composites under static condition

WAXD was further used to probe the dispersion state of graphene-based particles in PDMS. WAXD plots for original graphene-based particle powders, graphene-based particle/P28 composites and neat P28 are shown in Fig. 3. For GP-1/P28 sample, the diffraction peak (∼27.1°) of original GP-1 becomes very weak and does not exhibit obvious sharpening with increasing particle concentration, indicating the partial exfoliation or intercalation of GP-1 particles.30 For GP-2/P28 and GP-3/P28 composites, the broad diffraction peak of graphite at ∼25.5° disappears, also indicating the partial exfoliation or intercalation. However, as the broad diffraction peak of graphene oxide at ∼12.7° is close to the amorphous diffraction peak of P28 at ∼12.5°,31 it is hard to fully estimate the dispersion of GP-2 and GP-3 by WAXD. Similarly, the broad diffraction peak of GP-4 seems to disappear when dispersed in P28, however, the broad diffraction peak of P28 may hide the existence of weak diffraction peak of GP-4. Thus, it is also hard to estimate the degree of exfoliation or intercalation of GP-4 only by WAXD. High-resolution TEM images of graphene-based particle/P28 composites are shown in Fig. S2, which further suggest the partial exfoliation of graphene-based particles.
image file: c5ra04364f-f3.tif
Fig. 3 WAXD patterns of GP-1/P28, GP-2/P28, GP-3/P28 and GP-4/P28 composites with 9.1 wt% and 7.4 wt% graphene-based particles, graphene-based particles and neat P28. The curves are vertically shifted for clarity.

We also did WAXD experiments for GP/P117 composites and we found the similar results (shown in Fig. S3), indicating that the exfoliation or intercalation of graphene-based particles may be independent on the molecular weight of PDMS.

The structure of graphene-based particle/PDMS composites was further explored by SAXS measurements. The scattering curves are analyzed using the Beaucage's Unified Model7,32 to extract relevant length scales and exponents. In systems without distinct surfaces, the scattering intensity (I) often obeys a power law in the magnitude of the scattering vector (q) by I(q) ∼ qD. For mass fractal objects, D is the fractal dimension of the scatter (1 < D < 3). When D lies in the range of 4 > D > 3, the data can be interpreted as scattering from surfaces. In this case, D = 6 − Ds, where Ds is the surface fractal dimension. In Fig. 4, the scattering curves of graphene-based particle/P28 exhibit knee-like scattering feature with a crossover at a q* that separates two power-law regions (IqD) associated with two different fractal-like morphologies, i.e., Dlow and Dhigh for q < q* and q > q*, respectively. The crossover features are reasonably associated with the size of layered stacks (d = 2π/q*).33,34 Accordingly, the size of layered stacks with a few platelets is 11.4, 7.0, 5.2 and 9.7 nm for GP-1, GP-2, GP-3 and GP-4 composites, respectively, which non-monotonically changes with the surface oxygen content of graphene-based particles. The size of layered stacks is also found to be independent on the molecular weight of PDMS (Fig. S4), which is similar with the results of WAXD.


image file: c5ra04364f-f4.tif
Fig. 4 SAXS profiles of 7.4 wt% graphene-based particle/P28 composites.

Dlow (d > 11.4 nm) is 2.99 for GP-1/P28 composites, indicating the presence of spherical-like layered stacks of GP-1 platelets (3 for perfect spherical structure).35 But Dhigh (d < 11.4 nm) of 3.46 suggests the surface fractal of GP-1 layered stacks with fractal dimension (Ds) of 2.54 (Ds = 6 − Dhigh).32 For GP-2, GP-3 and GP-4 composites, the values of Dlow are 3.66, 3.48 and 3.49, respectively, suggesting the surface fractal of samples with fractal dimensions of 2.34, 2.52 and 2.51.32 But the Dhigh of 2.99, 2.34 and 2.90 indicates the mass fractal of GP-2, GP-3 and GP-4 layered stacks.32 It should be noted that for polydisperse system, the scattering related to big layered stacks may hide the presence of thin graphene-based particles.36

The microscopic dispersion of graphene-based particles in PDMS is observed by optical microscope on the length scale of several to a few hundred of micrometers. Aggregates of graphene-based particles are observed in all the composites, as shown in Fig. 5. High-resolution micrographs taken under high magnification times are shown in Fig. S5. It is observed that the size of aggregates decreases from GP-1 to GP-3, and then increases from GP-3 to GP-4, which is consistent with the size change of layered stacks determined by SAXS (Fig. 6). Similar phenomenon is also observed in graphene-based particle/P117 composites (Fig. S6). Moreover, the size of aggregates of P28 composites is slightly larger than that of P117 composites with the same particle, which may result from the faster diffusion of particles in lower viscosity matrix.7


image file: c5ra04364f-f5.tif
Fig. 5 Optical micrographs of 1.0 wt% graphene-based particle/P28 composites. The scale bars are 150 μm.

image file: c5ra04364f-f6.tif
Fig. 6 Storage modulus (G′) and loss modulus (G′′) versus frequency (ω) for GP-2/P28 composites.

3.3 Linear rheological properties of graphene-based particle/PDMS composites

Linear rheological results of polymer composites are used here to study the dispersion and aggregation behaviors of particles under static. Typical linear frequency sweep results of GP-2/P28 composites are shown in Fig. 6 as an example. The storage moduli (G′) of 3.8 wt% GP-2/P28 composites is lower than the loss moduli (G′′) and both moduli are frequency dependent in the experimental frequency range, indicating the liquid-like behavior.37,38 When the concentration of GP-2 is increased to 5.7 wt%, a plateau region of G′ higher than G′′ at low frequency is observed, suggesting the formation of weak network structure.37,38 Thus the critical concentration for the formation of network (Ccr) of GP-2/P28 should be in the range of 3.8–5.7 wt%. As the concentration of GP-2 is further increased, both G′ and G′′ increase and the frequency dependence of moduli decreases, indicating the formation of enhanced network structure. The Ccr of other graphene-based particle/P28 composites is determined by similar method (Fig. S7), and the results are summarized in Table 1.
Table 1 Critical concentration (Ccr) for the formation of network structure in graphene-based particle/PDMS composites
Samples Ccra (wt%) mcb (wt%) Rc
a Estimated from G′ and G′′ curves.b Obtained from linear fitting of log[thin space (1/6-em)]G0 versus log(mmc).c The correlation coefficient of the linear fitting of log[thin space (1/6-em)]G0 versus log(mmc).
GP-1/P28 3.8–5.7 4.4 0.996
GP-2/P28 3.8–5.7 5.0 0.985
GP-3/P28 9.1–10.7 10.0 0.993
GP-4/P28 2.0–3.8 2.2 0.994


To quantitatively determine the critical concentration for the formation of network structure (mc), the plateau modulus is fitted to equation: G0 ∝ (mmc)α, where G0 is obtained at low frequency (∼0.12 rad s−1), m is the mass fraction of particles and α is the percolation exponent.38,39 The details of fitting are shown in Fig. S8, and the fitted results are shown in Table 1. The fitted mc is consistent with Ccr estimated from G′ and G′′ curves for graphene-based particle/P28 composites. It is observed that mc first increases from GP-1 to GP-3 and then decreases for GP-4. Correlated with the dispersion state of graphene-based particle suspensions, it is found that the larger sized aggregates lead to the lower mc, and the smaller sized aggregates induce the higher mc.7,39 Accordingly, it is inferred that the networks of graphene-based particle/PDMS composites are formed by the aggregates of graphene-based particles.7,8,40

Fig. 7 shows the effect of surface chemistry of graphene-based particles on the linear viscoelasticity of samples for the concentration of graphene-based particles higher than mc. The storage moduli of 10.7 wt% graphene-based particle/P28 composites decrease from GP-1 to GP-3, and increase again for GP-4, which has the highest surface oxygen content. This is also consistent with the size change of aggregates for different graphene-based particles (Fig. 5). Similar trend is also found in 9.1 wt% graphene-based particle/P28 composites (Fig. S9). It is commonly accepted that the dispersion state of particle has obvious influence on the linear viscoelastic properties of composites.7,40,41 For the graphene-based particle/P28 composites studied in this work, the larger sized aggregates induce the higher elasticity of the network.


image file: c5ra04364f-f7.tif
Fig. 7 Storage modulus (G′) and loss modulus (G′′) versus frequency (ω) for 10.7 wt% graphene-based particle/P28 composites.

3.4 Structure of graphene-based particle/PDMS composites under shear

The structure of graphene-based particle/PDMS composites under shear is observed by optical microscope equipped with shearing cell. Imaging the structure of samples with high concentration of particles is quite difficult due to the strong adsorption of graphene-based particles. Thus micrographs are taken for samples with low concentration of particles. The structure of 2.0 wt% GP-1/P28 composites under different shear rates is displayed in Fig. 8. The aggregates of GP-1 interconnect to form larger ones and exhibit some extent of vorticity alignment in GP-1/P28 composites at low shear rates ([small gamma, Greek, dot above] = 0.01 and 0.05 s−1). An internal hoop stress in the xy plane leads to the elongation of aggregates in the z axis and the contraction in the xy plane.17,18 However, at higher shear rates ([small gamma, Greek, dot above] = 0.5 and 1 s−1), the aggregates are partially broken and align along the shear direction, which is consistent with theoretical prediction that beyond a critical shear rate additional contraction of the aggregates is impossible.42
image file: c5ra04364f-f8.tif
Fig. 8 Structures of 2.0 wt% GP-1/P28 composites under different shear rates. The scale bars are 150 μm and the gap is 150 μm. Photos are taken after shearing for about 40 s.

The influence of surface chemistry of graphene-based particles on the structure of graphene-based particle/P28 composites under weak shear ([small gamma, Greek, dot above] = 0.05 s−1) is shown in Fig. 9. GP-1 and GP-4 form larger aggregates and have some degree of vorticity alignment under weak shear in the composites. The detailed micrographs of vorticity aligned structure are shown in Fig. S10. However, GP-2 and GP-3 only form small aggregates and do not exhibit obvious vorticity alignment behavior under weak shear, which is supposed to result from the weak steric hindrance and weak attractive interaction between small aggregates.43,44 Pasquino et al. also reported the switch from flow alignment to vorticity alignment when attractive interaction became more important for spherical particle suspensions,45 which is to some extent consistent with graphene-based particle suspensions investigated in this work.


image file: c5ra04364f-f9.tif
Fig. 9 Structures of 2.0 wt% graphene-based particle/P28 composites at a shear rate of 0.05 s−1. The gap is 150 μm and the scale bars are 150 μm. Photos are taken after shearing for about 40 s.

At high shear rates, the aggregates of graphene-based particles are partially broken and align along the shear direction (Fig. S11). For high molecular weight P117 (Mw > Mc) composites, no obvious structural change is observed in all the graphene-based particle composites under weak shear (Fig. S12), which is also consistent with our previous work7 for higher oxygen content GO/P117 composites (oxygen content is 33.6%).

3.5 Rheological properties of graphene-based particle suspensions under shear

The structural change under shear strongly affects the rheological properties of graphene-based particle suspensions. Fig. 10 shows the shear thinning of samples, which is inferred to be caused by the alignment and disaggregation behaviors of graphene-based particle aggregates under shear.7,8,46,47 It is interesting that the low-shear-rate viscosity of 10.7 wt% graphene-based particle/P28 composites first decreases from GP-1 to GP-3 samples and then increases again for GP-4/P28 sample, which is also consistent with the change of size of aggregates. It is well known that the reinforcement effect is strong for large aggregates,48 thus for the composites with larger aggregates (GP-1 and GP-4), the viscosity values increase more obviously. Similar phenomenon is also observed in 9.1 wt% graphene-based particle/P28 composites (Fig. S13). At higher shear rates, the surface fracture of some graphene-based particle/PDMS composites is observed, thus those data are not shown.
image file: c5ra04364f-f10.tif
Fig. 10 Viscosity (η) versus shear rate ([small gamma, Greek, dot above]) for 10.7 wt% graphene-based particle/P28 composites.

More interestingly, the sign of normal stress differences (ΔN) changes with increasing the surface oxygen content of graphene-based particle for low molecular weight PDMS (Mw < Mc) composites. As shown in Fig. 11, the sign of ΔN is negative for composites with the lowest (GP-1) and highest (GP-4) surface oxygen content, resulting from the vorticity alignment of larger aggregates (Fig. 9).7,8,13 However, the ΔN is almost zero for the graphene-based particles with intermediate surface oxygen content (GP-2 and GP-3) and no obvious vorticity alignment behavior is observed (Fig. 9). Similar phenomenon is also observed in graphene-based particle/P28 composites with 9.1 wt% graphene-based particles (Fig. S14). For GP-1 and GP-4 composites with much lower concentration of particles (but above mc), slightly negative ΔN (∼15 Pa) can still be found (Fig. S15). For graphene-based particle/P117 composites, only positive ΔN is observed (Fig. S16). Our previous work also observed positive ΔN in GO (oxygen content of 33.6%)/P117 composites,7 which is consistent with the present work.


image file: c5ra04364f-f11.tif
Fig. 11 Normal stress differences (ΔN) versus shear rate ([small gamma, Greek, dot above]) for 10.7 wt% graphene-based particle/P28 composites.

4 Discussion

4.1 Inter-particle interaction and polymer–particle interaction

Among these graphene-based particles, GP-1 has more sp2 electron contributing to the strongest inter-particle π–π attractive interaction;10 comparatively, GP-4 has the strongest inter-particle hydrogen-bonding interaction as a result of high content of oxygen containing groups.7,10 The π–π attractive interaction between particles weakens with increasing surface oxygen content.35 For the interaction between graphene and PDMS, many experimental results have confirmed the existence of CH–π interaction.35,49 However, the inter-particle hydrogen-bonding interaction and π–π interaction (2–4 kcal mol−1)50 is proved to be much stronger than the polymer–particle CH–π interaction (1.0 kcal mol−1).35,49

4.2 Structure and rheological properties of composites under static

In this work, the structure of graphene-based particle in PDMS is strongly affected by surface chemistry of graphene-based particles, as directly determined by TEM, WAXD, SAXS, optical microscope and rheometer. Due to the conjugated sp2 carbon, the CH–π interaction between GP-1 particle and PDMS should be strong. However, the aggregation of layered stacks confirms that the CH–π interaction between GP-1 and PDMS is much weaker than the π–π attractive interaction between GP-1.35,49 With increasing oxygen content on the surface of particles, the π–π attractive interaction between particles is weakened due to the decrease of conjugated sp2 carbon. Therefore, the dispersion is better for GP-2 and GP-3 particles since the particle–polymer attractive interaction dominates. Further increasing surface oxygen content leads to much stronger hydrogen-bonding interaction between particles (GP-4), thus large aggregates are observed in GP-4/P28 composites.

4.3 Structure and rheological properties of composites under shear

It is proposed that there are two stages in the aggregation process of particles: collision between particles or between particles and aggregates, and aggregates growth.42 At the first stage of aggregation, weak shear accelerates the collision and surface overlap of compressible aggregates. Potanin's theoretical work proposed that the capture efficiency decreases with increasing aggregate size for the collision of two equal-sized aggregates of spherical particles.42 However, in this work, the larger sized aggregates (diameter of 48.1 and 56.9 μm for GP-1 and GP-4) are prone to have higher capture efficiency phenomenally, while small sized aggregates (diameter of 19.7 and 13.9 μm for GP-2 and GP-3) has much lower capture efficiency (the diameter distribution of aggregates is shown in Fig. S17). This contradiction indicates that the inter-particle attractive interaction may dominate the capture efficiency in this work.

At the second stage of aggregation, the aggregate grows and the upper limit of aggregate growth under weak shear is as a function of inter-particle bond energy U: R/a ∼ (φ[small gamma, Greek, dot above])1/(2f−3)exp[thin space (1/6-em)]U/(2f − 3)kT, where R is the radius of aggregates, a is the radius of sphere, φ is the volume fraction of particle, [small gamma, Greek, dot above] is the shear rate, f is the fractal dimension of aggregate (1.9–2.0 for three dimensional space), U is the inter-particle bond energy, and kT is the Boltzmann factor.42 For the graphene-based particles used in this work, the effective attraction interaction between GP-1 particles and between GP-4 particles is much larger than that between GP-2 particles and between GP-3 particles due to the hydrogen-bonding interaction in GP-4 and π–π interaction in GP-1. Therefore, the relative value of U is inferred to be UGP-1, UGP-4 > UGP-2, UGP-3, thus the relative value of R/a for GP-1 and GP-4 should be larger than that for GP-2 and GP-3, which may further result in the strong vorticity alignment for GP-1 and GP-4 aggregates and the negative ΔN.

At higher shear rates, for compressible aggregates, theoretical work predicted a critical fractal dimension corresponding to a critical shear rate, above which any contraction of aggregates is impossible.42 In this work, high shear rate leads to the breakup of aggregates of graphene-based particles,7,8 resulting in the almost zero ΔN.

5 Conclusions

The impact of surface chemistry of graphene-based particles on the structure and rheological properties of graphene-based particle/PDMS composites is investigated. Under static, graphene-based particles with different surface oxygen contents are partially exfoliated in PDMS, forming some layered stacks (evidenced by WAXD and SAXS measurements). Moreover, aggregates are observed in graphene-based particle suspensions. The size of both stacks and aggregates first decreases (from GP-1 to GP-3) and then increases (from GP-3 to GP-4) with increasing surface oxygen content, owing to the strong π–π attractive interaction between GP-1 particles and strong hydrogen-bonding attractive interaction between GP-4 particles. More interestingly, the surface chemistry of graphene-based particles strongly affects the structural change of suspensions under shear and then affects the rheological properties. For particles with strong inter-attractive interactions (GP-1 and GP-4), large aggregates form and then the low-shear-rate viscosities of composites are higher than those for particles with weak inter-attractive interactions (GP-2 and GP-3). Subsequently, vorticity banding is found for GP-1 and GP-4 samples, as a result of the elongation of aggregates in z axis and the contraction in xy plane under shear, which leads to the negative ΔN under shear. However, for particles with weak inter-attractive interactions (GP-2 and GP-3), no apparent aggregation, vorticity banding or negative ΔN is observed. This is because the weaker inter-particle energy induces lower capture efficiency when two aggregates contact. We hope this work will be helpful for manipulating the structure and rheological properties of graphene-based composites for desirable usage, which may also provide some useful experimental data for the improvement of theoretical work.

Acknowledgements

This work is supported by the National Natural Science Foundation of China (21474111, 21222407 and 21274152) program and subsidized by the National Basic Research Program of China (973 Program, 2012CB821500).

Notes and references

  1. R. H. Baughman, A. A. Zakhidov and W. A. de Heer, Science, 2002, 297, 787–792 CrossRef CAS PubMed.
  2. C. K. Leong and D. D. L. Chung, Carbon, 2003, 41, 2459–2469 CrossRef CAS.
  3. S. Stankovich, D. A. Dikin, G. H. B. Dommett, K. M. Kohlhaas, E. J. Zimney, E. A. Stach, R. D. Piner, S. T. Nguyen and R. S. Ruoff, Nature, 2006, 442, 282–286 CrossRef CAS PubMed.
  4. H. Kim, A. A. Abdala and C. W. Macosko, Macromolecules, 2010, 43, 6515–6530 CrossRef CAS.
  5. D. R. Dreyer, S. Park, C. W. Bielawski and R. S. Ruoff, Chem. Soc. Rev., 2010, 39, 228–240 RSC.
  6. D. Li, M. B. Muller, S. Gilje, R. B. Kaner and G. G. Wallace, Nat. Nanotechnol., 2008, 3, 101–105 CrossRef CAS PubMed.
  7. R. Niu, J. Gong, D. H. Xu, T. Tang and Z. Y. Sun, Polymer, 2014, 55, 5445–5453 CrossRef CAS PubMed.
  8. Y. Q. Tan, Y. H. Song and Q. Zheng, Nanoscale, 2012, 4, 6997–7005 RSC.
  9. H. L. Ma, Y. W. Zhang, Q. H. Hu, S. L. He, X. F. Li, M. L. Zhai and Z. Z. Yu, Mater. Lett., 2013, 102, 15–18 CrossRef PubMed.
  10. H. C. Schniepp, J. L. Li, M. J. McAllister, H. Sai, M. Herrera-Alonso, D. H. Adamson, R. K. Prud'homme, R. Car, D. A. Saville and I. A. Aksay, J. Phys. Chem. B, 2006, 110, 8535–8539 CrossRef CAS PubMed.
  11. J. R. Potts, S. Murali, Y. W. Zhu, X. Zhao and R. S. Ruoff, Macromolecules, 2011, 44, 6488–6495 CrossRef CAS.
  12. T. T. Ma, P. R. Chang, P. W. Zheng and X. F. Ma, Carbohydr. Polym., 2013, 94, 63–70 CrossRef CAS PubMed.
  13. H. Kim, S. Kobayashi, M. A. AbdurRahim, M. J. Zhang, A. Khusainova, M. A. Hillmyer, A. A. Abdala and C. W. Macosko, Polymer, 2011, 52, 1837–1846 CrossRef CAS PubMed.
  14. J. R. Potts, S. H. Lee, T. M. Alam, J. H. An, M. D. Stoller, R. D. Piner and R. S. Ruoff, Carbon, 2011, 49, 2615–2623 CrossRef CAS PubMed.
  15. H. T. Hua, X. B. Wang, J. C. Wang, L. Wan, F. M. Liu, H. Zheng, R. Chen and C. H. Xu, Chem. Phys. Lett., 2010, 484, 247–253 CrossRef PubMed.
  16. R. Niu, J. Gong, D. H. Xu, T. Tang and Z. Y. Sun, RSC Adv., 2014, 4, 62759–62768 RSC.
  17. S. B. Kharchenko, J. F. Douglas, J. Obrzut, E. A. Grulke and K. B. Migler, Nat. Mater., 2004, 3, 564–568 CrossRef CAS PubMed.
  18. V. A. Davis, L. M. Ericson, A. N. G. Parra-Vasquez, H. Fan, Y. H. Wang, V. Prieto, J. A. Longoria, S. Ramesh, R. K. Saini, C. Kittrell, W. E. Billups, W. W. Adams, R. H. Hauge, R. E. Smalley and M. Pasquali, Macromolecules, 2004, 37, 154–160 CrossRef CAS.
  19. E. K. Hobbie and D. J. Fry, Phys. Rev. Lett., 2006, 97, 036101 CrossRef CAS.
  20. S. Lin-Gibson, J. A. Pathak, E. A. Grulke, H. Wang and E. K. Hobbie, Phys. Rev. Lett., 2004, 92, 048302 CrossRef CAS.
  21. S. I. Jun and H. S. Lee, Appl. Phys. Lett., 2012, 100, 164108 CrossRef PubMed.
  22. N. I. Kovtyukhova, P. J. Ollivier, B. R. Martin, T. E. Mallouk, S. A. Chizhik, E. V. Buzaneva and A. D. Gorchinskiy, Chem. Mater., 1999, 11, 771–778 CrossRef CAS.
  23. V. C. Tung, M. J. Allen, Y. Yang and R. B. Kaner, Nat. Nanotechnol., 2009, 4, 25–29 CrossRef CAS PubMed.
  24. J. A. Ressia, M. A. Villar and E. M. Valleś, Polymer, 2000, 41, 6885–6894 CrossRef CAS.
  25. H. K. He and C. Gao, Chem. Mater., 2010, 22, 5054–5064 CrossRef CAS.
  26. H. Kim and C. W. Macosko, Macromolecules, 2008, 41, 3317–3327 CrossRef CAS.
  27. G. X. Wang, J. Yang, J. Park, X. L. Gou, B. Wang, H. Liu and J. Yao, J. Phys. Chem. C, 2008, 112, 8192–8195 CAS.
  28. P. G. Song, Z. H. Cao, Y. Z. Cai, L. P. Zhao, Z. P. Fang and S. Y. Fu, Polymer, 2011, 52, 4001–4010 CrossRef CAS PubMed.
  29. T. Szabó, O. Berkesi, P. Forgó, K. Josepovits, Y. Sanakis, D. Petridis and I. Dékány, Chem. Mater., 2006, 18, 2740–2749 CrossRef.
  30. S. G. Prolongo, R. Moriche, M. Sánchez and A. Ureña, Compos. Sci. Technol., 2013, 85, 136–141 CrossRef CAS PubMed.
  31. R. Hernandez, J. Weksler, A. Padsalgikar and J. Runt, Macromolecules, 2007, 40, 5441–5449 CrossRef CAS.
  32. K. D. Keefer and D. W. Schaefer, Phys. Rev. Lett., 1986, 56, 2376–2379 CrossRef CAS.
  33. G. Faiella, F. Piscitelli, M. Lavorgna, V. Antonucci and M. Giordano, Appl. Phys. Lett., 2009, 95, 153106 CrossRef PubMed.
  34. I. M. K. Ismail and P. Pfeifer, Langmuir, 1994, 10, 1532–1538 CrossRef CAS.
  35. A. Beigbeder, M. Linares, M. Devalckenaere, P. Degée, M. Claes, D. Beljonne, R. Lazzaroni and P. Dubois, Adv. Mater., 2008, 20, 1003–1007 CrossRef CAS PubMed.
  36. H. Kim, Y. Miura and C. W. Macosko, Chem. Mater., 2010, 22, 3441–3450 CrossRef CAS.
  37. K. Nishinari, Prog. Colloid Polym. Sci., 2009, 136, 87–94 CAS.
  38. M. J. Kayatin and V. A. Davis, Macromolecules, 2009, 42, 6624–6632 CrossRef CAS.
  39. M. Sahimi and S. Arbabi, Phys. Rev. B: Condens. Matter Mater. Phys., 1993, 47, 703–712 CrossRef.
  40. Y. Zhang, D. I. Gittins, D. Skuse, T. Cosgrove and J. S. van Duijneveldt, Langmuir, 2008, 24, 12032–12039 CrossRef CAS PubMed.
  41. L. Moreira, R. Fulchiron, G. Seytre, P. Dubois and P. Cassagnau, Macromolecules, 2010, 43, 1467–1472 CrossRef CAS.
  42. A. A. Potanin, J. Colloid Interface Sci., 1991, 145, 140–157 CrossRef CAS.
  43. F. Pignon, A. Magnin and J. M. Piau, Phys. Rev. Lett., 1997, 79, 4689–4692 CrossRef CAS.
  44. J. V. Jr DeGroot, C. W. Macosko, T. Kume and T. Hashimoto, J. Colloid Interface Sci., 1994, 166, 404–413 CrossRef.
  45. R. Pasquino, F. Snijkers, N. Grizzuti and J. Vermant, Rheol. Acta, 2010, 49, 993–1001 CrossRef CAS.
  46. M. P. Godfrin, F. Guo, I. Chakraborty, N. Heeder, A. Shukla, A. Bose, R. H. Hurt and A. Tripathi, Langmuir, 2013, 29, 13162–13167 CrossRef CAS PubMed.
  47. X. M. Yang, C. X. Guo, L. L. Ji, Y. W. Li and Y. F. Tu, Langmuir, 2013, 29, 8103–8107 CrossRef CAS PubMed.
  48. A. W. K. Ma, F. Chinesta and M. R. Mackley, J. Rheol., 2009, 53, 547–573 CrossRef CAS.
  49. H. Suezawa, T. Yoshida, S. Ishihara, Y. Umezawa and M. Nishio, CrystEngComm, 2003, 5, 514–518 RSC.
  50. A. S. Reddy, D. Vijay, G. M. Sastry and G. N. Sastry, J. Phys. Chem. B, 2006, 110, 2479–2481 CrossRef CAS PubMed.

Footnote

Electronic supplementary information (ESI) available: Viscosity and normal stress of 9.1 wt% GP-4/P28 measured by cone-plate geometry; WAXD, SAXS and POM images of graphene-based particle/P117 composites; frequency sweep and linear fitting of plateau modulus versus reduced mass fraction of graphene-based particle/P28 composites; moduli, viscosity and normal stress differences of 9.1 wt% graphene-based particle/P28; structures of graphene-based particle/P117 under shear; structures of graphene-based particle/P28 under high shear rates; normal stress differences of graphene-based particle/P117 composites; aggregate size distribution and Gaussian fitting of aggregate size histogram of graphene-based particle/P28 composites. See DOI: 10.1039/c5ra04364f

This journal is © The Royal Society of Chemistry 2015
Click here to see how this site uses Cookies. View our privacy policy here.