Fabrication of intelligent poly(N-isopropylacrylamide)/silver nanoparticle composite films with dynamic surface-enhanced Raman scattering effect

Lin Wanga, Xiaomei Zhaoa, Yan Zhanga, Wenqi Zhanga, Tianrui Rena, Zhihong Chenb, Feng Wang*a and Haifeng Yang*a
aThe Education Ministry Key Lab of Resource Chemistry, Shanghai Key Laboratory of Rare Earth Functional Materials, Shanghai Municipal Education Committee Key Laboratory of Molecular Imaging Probes and Sensors, Department of Chemistry, Shanghai Normal University, Shanghai, 200234, P. R. China. E-mail: wangfeng@shnu.edu.cn; hfyang@shnu.edu.cn
bCollege of Information, Mechanical and Electrical engineering, Shanghai Normal University, Shanghai, 200234, P. R. China

Received 12th March 2015 , Accepted 28th April 2015

First published on 28th April 2015


Abstract

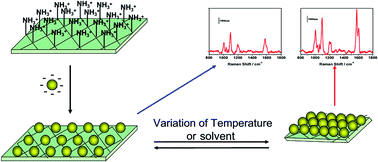
An intelligent PNIPAAm/AgNP composite film was fabricated by the simple assembly of silver nanoparticles on the surface of photo-polymerized PNIPAAm film via electrostatic interaction. Surface enhanced Raman scattering study and finite-difference time-domain simulation demonstrated that the local electric field intensity and the SERS intensity of this resultant composite film can be easily tuned by changing the interparticle distance triggered by temperature or solvent variations. The composite film showed a high stability in a polar organic solvent and concentrated saline solution. The smart composite film might find applications as a SERS sensor for temperature/solvent variation detection as well as a versatile SERS substrate for the detection of analyte in sea water and organic solvent.

1 Introduction

In comparison with other metal nanoparticles, silver nanoparticles (AgNPs) have attracted considerable attention because of their dominant plasmonic optical properties and have been applied in many fields such as sensing, photocatalysis, biomedical imaging, etc.1–5 One of the most intriguing optical properties of AgNPs is localized surface plasmon resonance (LSPR), which is the collective oscillation of the conduction-band electrons induced by the interacting electromagnetic field.6 The enhanced electromagnetic field at the surface of AgNPs can significantly amplify the Raman signal of the surrounding analyte, which is the basis of their application as surface enhanced Raman scattering (SERS) substrate.7 Further studies showed that nanostructures and gaps less than 10 nm (also termed “hot-spots”) can exponentially enhance the SERS signal, which has been applied as a sensitive and powerful analytical technique for the ultrasensitive detection of molecules.8–10 Various methods have been developed to introduce hot-spots on SERS substrates via either top-down11,12 or bottom-up13–15 approach. However, in most cases, once the SERS substrates are formed, the spatial distribution of AgNPs is fixed.14,16 Therefore, the number of hot-spots and the enhancement factor of the substrate are also fixed and cannot respond to environmental stimuli. On the contrary, the dynamic SERS substrates with variable interparticle distances can not only enhance SERS signals by external stimuli but also monitor environmental variations such as temperature, pH, and solvent etc., making them suitable for environmental changes detection. For example, temperature tunable SERS nanosensers could act as temperature probes of biological systems in vivo.17

Intelligent polymers (also called smart polymer) that can reversibly change their properties in response to environmental stimuli, have drawn numerous research interests in the preparation of dynamic SERS substrates.18–22 Among them, poly(N-isopropylacrylamide) (PNIPAAm) has been studied in detail with regard to its well-known phase behavior in aqueous solutions, which undergoes a reversible phase transition at its lower critical solution temperature (LCST, ∼32 °C in water). The conformation of PNIPAAm chain changes from a swollen state (below LCST) to a shrunken state (above LCST) upon temperature increments due to the weakened amide–water interaction and the enhanced hydrophobic interaction between isopropyl groups.23,24 The conformational changes together with the significant dimensional variations make PNIPAAm a good candidate for the preparation of dynamic SERS substrates.25–29 However, many of the reported dynamic SERS substrates are prepared tortuously or are time consuming. In addition, AgNPs fabricated by in situ silver ion reduction in some dynamic SERS substrates are hard to control in terms of size and particle number. What's more, the conformational changes of PNIPAAm can also be triggered by solvent changes or salt ion, yet up to now few reports can be found about the responses of dynamic SERS substrate to such stimuli.

We report in this work a facile approach to fabricate PNIPAAm/AgNPs composite films, in which uniform silver nanoparticles were densely loaded on photo-polymerized PNIPAAm film via electrostatic interaction. The temperature-dependent optical properties of the composite film were confirmed by UV-reflectance spectroscopy and Finite-Difference Time-Domain (FDTD) simulation. When the PNIPAAm/AgNPs composite film was used as dynamic SERS substrates for detecting 4-mercaptopyridine in an aqueous solution, the SERS signals could be modulated by temperature and solvent changes and are relatively stable even at high salt concentrations. Therefore, the composite film holds promise as a SERS sensor for temperature detection, and can also act as a versatile SERS substrate for analyte detection in sea water and many organic solvents.

2 Experimental section

2.1 Materials

N-Isopropylacrylamide (NIPAAm, 98%, Aladdin), N,N′-methylene bisacrylamide (MBA, 97%, Aladdin), 2-[4-(2-hydroxy-2-methyl-1-oxopropyl)phenoxy]ethyl ester (I2959, TCI), 4-mercaptopyridine (4-Mpy, TCI), 2-aminoethyl methacrylate hydrochloride (AEMH, 98%, HWRK Chem), anthracene (HWRK Chem), methanol (AR, Sinopharm Chemistry Reagent Co), ethanol (AR, Sinopharm Chemistry Reagent Co), silver nitrate (AgNO3, AR, Sinopharm Chemistry Reagent Co), crystal violet (AR, Sinopharm Chemistry Reagent Co), tri-sodium citrate (AR, Sinopharm Chemistry Reagent Co) and sodium chloride (NaCl, AR, Sinopharm Chemistry Reagent Co) were used as received. All deionized water used in the synthesis and characterization was acquired by UPH series of tap water ultrapure water machine.

2.2 Synthesis of PNIPAAm film

PNIPAAm films were synthesized by photopolymerization.30 In a typical procedure, 0.90 g NIPAAm, 0.01 g MBA (crosslinking agent), 0.05 g I2959 (photoinitiator) and 0.09 g 2-aminoethyl methacrylate hydrochloride (functional monomer) were dissolved in 1 mL methanol. Then one drop (about 80 μL) of such solution was spread on a polytetrafluoroethylene (PTEF) Petri dish and left untouched for 10 min under ambient conditions to allow the solution to reach saturation after solvent evaporation. The solution droplet was then covered with a cover glass and exposed to UV radiation (365 nm or 264 nm) for 15 min. The cover glass was removed and the crosslinked film was peeled off from the PTFE dish and washed in cold water for 3 times to get the PNIPAAm film.

2.3 Synthesis of AgNPs suspension

AgNPs were synthesized according to the method reported by Lee and Meisel.31 0.001 M silver nitrate was dissolved in 150 mL deionized water. After the solution was heated to boiling, 3 mL of 1% tri-sodium citrate solution was added slowly under vigorous stirring. The reaction was kept for 6 h under boiling temperature to obtain the product Ag colloid with desired sizes. A due amount of Milli-Q water was added to obtain 125 mL of Ag colloid (the final concentration of Ag was 1.2 mM).

2.4 Preparation of PNIPAAm/AgNPs composite film

PNIPAAm film was immersed in 3 mL AgNPs suspension for 1 h. After that, the film was taken out and washed in deionized water for three times to get the clean PNIPAAm/AgNPs composite film.

2.5 Finite-difference time-domain simulation

The FDTD method was employed to simulate the electric field intensities and distributions at the surface of the SERS substrate by FDTD Solution software. The incident light is defined as a plane wave with an injection direction that is parallel to Z axis. For room temperature simulation, the calculation region was 100 × 60 × 60 nm3, for high temperature simulation the region was set at 78 × 60 × 60 nm3. In both cases the boundary conditions were set to periodic for X and Y and perfecting matched layer (PML) for Z. A mesh override region was set to 0.25 nm around the nanoparticles. The overall simulation time was set to 1000 fs. A 2D Z-normal frequency domain profile monitor with Z = 0 was applied to measure the electric field profile of the SERS substrate at the wavelength of 633 nm.

2.6 Characterization and measurement

UV-vis spectrum of Ag colloid was collected using a Model 760-CRT double-beam spectrophotometer (Shanghai Precision and Scientific Instrument Co., Ltd.). UV-reflectance spectra of AgNPs/PNIPAAm at 25 °C and 40 °C were collected using a UH4150 UV/visible/near infrared spectrophotometer (Hitachi Co., Ltd). TEM images of AgNPs were acquired on a Model JEM-2100 EXII transmission electron microscope (JEOL Co., Ltd.), operating at 200 kV. Fourier transform infrared spectra (FT-IR) were collected using a Nicolet infrared spectrometer (AVATAR-370-FTIR). The zeta potential was measured using a Malvern Zetasizer Nano ZS model ZEN3600 (Worcestershire, U.K.) equipped with a standard 633 nm laser. SERS spectra were recorded using a Jobin Yvon confocal laser Raman system (SuperLabRam II), which was equipped with a He–Ne laser at 632.8 nm with a power of ca. 5 mW. Each spectrum was obtained by three accumulations and the acquisition time was set at10 s.

3 Result and discussion

A three-step approach was employed for the fabrication of PNIPAAm/AgNPs composite film, as shown in Scheme 1. The detail fabrication is presented in the experimental section. In the first step, PNIPAAm film with amine groups was synthesized by photopolymerization.30 Raman spectra of NIPAAm before and after UV radiation are shown in Fig. 1A. Three peaks related to C[double bond, length as m-dash]C double bond at 1247, 1405 and 1620 cm−1 could be clearly seen in Fig. 1A(a). After UV irradiation for 15 min these three peaks dramatically decreased (Fig. 1A(b)), which confirmed the transition of monomer into polymers.32 FTIR was also utilized to monitor the photopolymerization (Fig. 1B). The peaks at 1414 and 1624 cm−1 respectively due to C[double bond, length as m-dash]C and –C[double bond, length as m-dash]C stretching vibrations in NIPAAm monomer disappeared after UV irradiation, which is consistent with the results of Raman study. What's more, after thoroughly rinsing with cold water to remove unreacted monomers, the absorption peak at 3450 cm−1 in FTIR spectrum of PNIPAAm (N–H vibration in AEMH segment) can be clearly seen,33 confirming the incorporation of amine group in the PNIPAAm chain.
image file: c5ra04361a-s1.tif
Scheme 1 Schematic illustration of the fabrication of PNIPAAm/AgNPs composite film.

image file: c5ra04361a-f1.tif
Fig. 1 (A) Raman spectra of NIPAAm (a) and PNIPAAm (b); (B) FTIR spectra of NIPAAm (a) and PNIPAAm (b).

In the second step, positively charged AgNPs were prepared according to Lee and Meisel's protocol. Uniform AgNPs with an average diameter of 35 ± 4 nm were obtained (Fig. 2A). This kind of AgNPs suspension showed an absorption peak at 407 nm in UV-vis spectrum (Fig. 2B), which agrees with the previous report.34,35 This citrate protected AgNPs showed a negative charge (−34.7 ± 2 mV) by zeta-potential measurement, which will facilitate the further assembly of AgNPs on amine-group bearing PNIPAAm film.


image file: c5ra04361a-f2.tif
Fig. 2 (A) TEM image and (B) UV-vis spectrum of AgNPs.

In the third step, PNIPAAm/AgNPs composite film was fabricated by electrostatic assembly of AgNPs on amine-group bearing PNIPAAm film. The color of the translucent PNIPAAm film gradually became dark brown (Fig. S1a and b) after immersing the film in AgNPs suspension for 1 h (Fig. S2). After rinsing the film with water and drying it in the air, a greyish-green luster was observed (Fig. S1c). SEM image (Fig. 3A) also showed a closely stacked AgNPs layer, indicating the successful assembly of AgNPs on PNIPAAm film.


image file: c5ra04361a-f3.tif
Fig. 3 (A) SEM image of PNIPAAm/AgNPs composite film in dry state; (B) UV-reflectance spectra of PNIPAAm/AgNPs composite film at 25 °C (a) and 40 °C (b).

As PNIPAAm/AgNPs composite film is opaque, UV-reflectance spectroscopy was performed to study the thermo-sensitivity of the film at 25 °C and 40 °C. Fig. 3B showed that the reflectivity of the composite film at 40 °C was larger than that at 25 °C over a wide wavelength ranges (300–700 nm). This could be explained by the closeness of the AgNPs induced by the shrinking of PNIPAAm chain network upon heating.36–38 With closeness of the AgNPs and the increase of the particle density, the extinction/anti-reflection feature of the AgNPs weakened, the composite film then becomes similar to the reflective bulk silver film at higher temperatures.

The calculation of interparticle distances between the adsorbed AgNPs at low and high temperatures was performed in order to better understand the dynamic changes of the PNIPAAm/AgNPs composite film. Based on the assumption that all AgNPs were distributed evenly on the PNIPAAm film with a pattern schemed in Fig. S3, we can calculate the average interparticle distance between the AgNPs at 25 °C and 40 °C. Specifically, the density of AgNPs in dry state was obtained from SEM image (Fig. 3A), and dimensional variations of the PNIPAAm/AgNPs composite film can be evaluated from digital camera image (DCI) (Fig. S1) at 25 °C, 40 °C and dry state. According to calculation results, the interparticle distance decreased from 15 nm at 25 °C to 4 nm at 40 °C, indicating the shrinking of PNIPAAm chain at higher temperatures and the increased particle density of the composite film. The observation further corroborates the UV-reflectance result. As a consequence, the PNIPAAm/AgNPs composite film can be expected to serve as a dynamic SERS substrate.

To further understand the mechanism of the SERS effect tuned by temperature, the near-field electric distribution of the PNIPAAm/AgNPs composite film was calculated based on FDTD solution software. A thin layer of water (Z = 0–30 nm) and PNIPAAm (Z = −30–0 nm) was added to mimic the real condition. The refractive index of PNIPAAm was set to be 1.35 at 25 °C and 1.65 at 40 °C.39 As shown in Fig. 4, the simulated electric field profiles at different temperatures showed a significant field enhancement at 40 °C than at 25 °C. The thermo-induced local electric field enhancement depicted that the PNIPAAm/AgNPs composite film with high sensitivity could be employed as the dynamic SERS substrates for molecular sensing.


image file: c5ra04361a-f4.tif
Fig. 4 (A) Simulated electric-field profile of PNIPAAm/AgNPs composite film at 25 °C and (B) 40 °C.

Using 4-mercaptopyridine (4-Mpy) as a probe molecule due to its distinctive Raman spectral feature and strong binding with AgNPs via S–Ag bond,40–42 the SERS activities of PNIPAAm/AgNPs composite film with increasing temperature were investigated. The recorded SERS spectra are presented in Fig. 5A. The bands at 1006 and 1097 cm−1 can be assigned to the ring breathing and C–C–C/C–S stretching, respectively. A peak at 1216 cm−1 is assigned to the β(CH)/β(NH) stretching. The peaks at 1577 and 1609 cm−1 are from the ring stretch modes of the 4-Mpy molecules with deprotonate and protonated nitrogen atoms. The occurrence of Raman band at 1097 cm−1 corresponding to the ring breathing/C–S stretching mode indicates that 4-Mpy was bound to the AgNPs surface through the sulfur atom.35,42,43 Fig. 5B shows the temperature-dependent SERS intensity at 1097 cm−1, which increased sharply at ∼35 °C and then leveled off with temperature increasing. It's not surprising to find that phase transition of PNIPAAm (LCST ∼32 °C) just happened in the temperature region (30–35 °C) where the SERS signal showed a significant improvement of at least 3 fold. Moreover, upon cooling from 40 °C to 25 °C, the intensity could go back to the original intensity at 25 °C. As seen in Fig. 6, showing the reversible thermo-induced change can be repeated for at least three-times. Therefore, the thermo-induced SERS signal changes on the PNIPAAm/AgNPs composite film is quite reversible. Similar results were obtained while detecting CV (10−9 M) and anthracene (10−4 M) on the composite film (Fig. S3 and S4). A clear increase in SERS intensity can be observed with temperature increases. These results indicate that the PNIPAAm/AgNPs composite film hold potential as a SERS sensor for temperature variation detection.


image file: c5ra04361a-f5.tif
Fig. 5 (A) SERS spectra of 1 × 10⁻⁴ M 4-Mpy using PNIPAAm/AgNPs composite film as SERS substrate with increasing temperatures and (B) the corresponding temperature-dependent SERS intensity at 1097 cm−1.

image file: c5ra04361a-f6.tif
Fig. 6 SERS intensity of 4-Mpy at 1097 cm−1 during repeated heating (40 °C)/cooling (25 °C) cycles.

In addition, the reproducibility of the PNIPAAm/AgNPs composite film was investigated by comparing SERS signals from 20 different spots on the same composite film (Fig. 7A) and different composite films (Fig. 7C). The peak at 1097 cm−1 was chosen to evaluate the reproducibility of composite film (Fig. 7B and D). The relative standard deviations are 17.5% (Fig. 7B) for spot-to-spot and 18.6% (Fig. 7D) for batch-to-batch respectively, which prove that the SERS substrate exhibits a good reproducibility.


image file: c5ra04361a-f7.tif
Fig. 7 (A) SERS spectra of 4-Mpy (1 × 10⁻⁴ M) using PNIPAAm/AgNPs composite film as SERS substrate from 20 randomly selected spots. (B) The intensities of peak (1097 cm−1) at 20 spots on the same substrate. (C) SERS spectra of 4-Mpy (1 × 10⁻⁴ M) using different PNIPAAm/AgNPs composite film as SERS substrates. (D) The intensities of peak (1097 cm−1) at different substrate.

PNIPAAm/AgNPs composite film was immersed in basic, acid or salt solution to study the durability of the film. The SERS intensity is relatively stable within pH range of 5–9, but significantly decreases at lower pH value (≤4) or higher pH value (≥10) (Fig. S6). As above mentioned, the main driving force of the formation of PNIPAAm/AgNPs composite film is electrostatic interaction, harsh pH conditions might destabilize the electrostatic interaction between PNIPAAm chain and AgNPs, leading to the detachment of AgNPs from the film and the decreased SERS signal. Interestingly, the SERS signal is reasonably stable even at high salt concentration equal to 15 wt% (Fig. S7). This might be attributed to the “salting out” effect of PNIPAAm chains: the chains dehydrate and collapse at lower temperature with the presence of salt ions,44 protecting the AgNPs against detachment from the film.

As PNIPAAm chain can also respond to other stimuli such as solvent polarity change, SERS intensities of 4-Mpy in H2O, EtOH and H2O/EtOH mixture were studied. Fig. 8c shows a significant SERS signal increase in H2O/EtOH mixture with a volume ratio of 1[thin space (1/6-em)]:[thin space (1/6-em)]1 compared to that in pure H2O and pure EtOH (Fig. 8a and b). Though the introduction of organic solvent can alter the LSPR of AgNPs,45 the SERS signal normally becomes weaker in organic solvent (herein, EtOH) than in water (Fig. 8b).46 Generally the SERS enhancement factor in nonaqueous media is only 1/10 to 1/100 of that in aqueous media.47 So the highest SERS signal of PNIPAAm/AgNPs composite film in H2O/EtOH mixture in this study could only be attributed to the greatest enhancement of LSPR induced by the closeness of AgNPs in solvent mixture such as 1[thin space (1/6-em)]:[thin space (1/6-em)]1 v/v H2O/EtOH. As well known, the competition of ethanol with water will cause the dehydration and the collapse of PNIPAAm chain, leading to the shrinking of PNIPAAm film and the decreased interparticle distances.48,49 This finally caused the formation of more SERS hot-spots in 1[thin space (1/6-em)]:[thin space (1/6-em)]1 v/v H2O/EtOH mixture. In Fig. 8c, it's worth mentioning that SERS signals related to ring-breathing mode at 1006 cm−1, β(CH)/β(NH) stretching mode at 1216 cm−1 and the ν(C–C) with protonated nitrogen mode at 1609 cm−1 become much stronger compared to that of the ν(C–C) with deprotonated nitrogen mode at 1577 cm−1, also hinting the improved charge transfer process and the formation of hydrogen bond between the N atom of 4-Mpy and the hydroxyl group of ethanol.


image file: c5ra04361a-f8.tif
Fig. 8 The SERS spectra of 1 × 10⁻⁴ M 4-Mpy using PNIPAAm/AgNPs composite film as SERS substrate in H2O (a), EtOH (b) and EtOH/H2O mixture (volume ratio = 5[thin space (1/6-em)]:[thin space (1/6-em)]5) (c).

To evaluate the long-term stability of the PNIPAAm/AgNPs composite film as SERS substrate, the composite film was simply stored in water for 4 months. The composite film was then taken out and the SERS intensity of the analyte was measured. Fig. S8 showed that the SERS signal of 4-Mpy only decreased 12.0% compared to that of the original value, illustrating the good stability of the PNIPAAm/AgNPs composite film.

4 Conclusion

In summary, a smart PNIPAAm/AgNPs composite film was designed and fabricated by the simple assembly of negatively charged silver nanoparticles on photo-polymerized, amine group-bearing PNIPAAm film via electrostatic interaction. Interparticle distance changes among adjacent AgNPs on the composite film triggered by temperature or solvent variations can drastically alter the optical properties of the composite film. Eventually, SERS signals of the composite film could be modulated by temperature and solvent changes. The proposed dynamic SERS substrate even exhibited high durability under high salt condition. Therefore, this kind of composite film can be expected to be utilized as a SERS sensor for temperature/solvent variation detection and for detecting analyte in sea water or in organic solvent.

Acknowledgements

The authors are grateful for the financial support provided by Shanghai Municipal Education Commission (Grant no. 13ZZ101 and Grant no. 14YZ072), Science and Technology Commission of Shanghai Municipality (Grant no. 14ZR1430200).

References

  1. X. Fan, W. Zheng and D. J. Singh, Light: Sci. Appl., 2014, 3, e179 CrossRef CAS.
  2. F. Lorestani, Z. Shahnavaz, P. Mn, Y. Alias and N. S. A. Manan, Sens. Actuators, B, 2015, 208, 389–398 CrossRef CAS PubMed.
  3. J. Wackerlig and P. A. Lieberzeit, Sens. Actuators, B, 2015, 207, 144–157 CrossRef CAS PubMed.
  4. M. Meena Kumari, J. Jacob and D. Philip, Spectrochim. Acta, Part A, 2015, 137, 185–192 CrossRef CAS PubMed.
  5. H. Wang, X. Jiang, X. Wang, X. Wei, Y. Zhu, B. Sun, Y. Su, S. He and Y. He, Anal. Chem., 2014, 86, 7368–7376 CrossRef CAS PubMed.
  6. G. Marcelo and M. Fernández-García, RSC Adv., 2014, 4, 11740 RSC.
  7. J. N. Anker, W. P. Hall, O. Lyandres, N. C. Shah, J. Zhao and R. P. Van Duyne, Nat. Mater., 2008, 7, 442–453 CrossRef CAS PubMed.
  8. A. Lee, G. F. S. Andrade, A. Ahmed, M. L. Souza, N. Coombs, E. Tumarkin, K. Liu, R. Gordon, A. G. Brolo and E. Kumacheva, J. Am. Chem. Soc., 2011, 133, 7563–7570 CrossRef CAS PubMed.
  9. D. Lim, K. Jeon, H. M. Kim, J. Nam and Y. D. Suh, Nat. Mater., 2009, 9, 60–67 CrossRef PubMed.
  10. M. Moskovits, Nature, 2010, 464, 357 CrossRef CAS PubMed.
  11. D. He, B. Hu, Q. Yao, K. Wang and S. Yu, ACS Nano, 2009, 3, 3993–4002 CrossRef CAS PubMed.
  12. C. Leiterer, D. Zopf, B. Seise, F. Jahn, K. Weber, J. Popp, D. Cialla-May and W. Fritzsche, J. Nanopart. Res., 2014, 16, 2467 CrossRef.
  13. B. Yan, A. Thubagere, W. R. Premasiri, L. D. Ziegler, L. Dal Negro and B. M. Reinhard, ACS Nano, 2009, 3, 1190–1202 CrossRef CAS PubMed.
  14. A. Li, Z. Baird, S. Bag, D. Sarkar, A. Prabhath, T. Pradeep and R. G. Cooks, Angew. Chem., Int. Ed., 2014, 53, 12528–12531 CAS.
  15. Z. Zuo, K. Zhu, L. Ning, G. Cui, J. Qu, Y. Cheng, J. Wang, Y. Shi, D. Xu and Y. Xin, Appl. Surf. Sci., 2015, 325, 45–51 CrossRef CAS PubMed.
  16. M. V. Cañamares, J. V. Garcia-Ramos, J. D. Gómez-Varga, C. Domingo and S. Sanchez-Cortes, Langmuir, 2005, 21, 8546–8553 CrossRef PubMed.
  17. J. Kneipp, H. Kneipp, B. Wittig and K. Kneipp, Nano Lett., 2007, 7, 2819–2823 CrossRef CAS PubMed.
  18. R. A. Álvarez-Puebla, R. Contreras-Cáceres, I. Pastoriza-Santos, J. Pérez-Juste and L. M. Liz-Marzán, Angew. Chem., Int. Ed., 2009, 48, 138–143 CrossRef PubMed.
  19. D. Wu, Y. Sun, X. Xu, S. Cheng, X. Zhang and R. Zhuo, Biomacromolecules, 2008, 9, 1155–1162 CrossRef CAS PubMed.
  20. T. Wu, Q. Zhang, J. Hu, G. Zhang and S. Liu, J. Mater. Chem., 2012, 22, 5155 RSC.
  21. P. Yin, Y. Chen, L. Jiang, T. You, X. Lu, L. Guo and S. Yang, Macromol. Rapid Commun., 2011, 32, 1000–1006 CrossRef CAS PubMed.
  22. A. C. Manikas, G. Romeo, A. Papa and P. A. Netti, Langmuir, 2014, 30, 3869–3875 CrossRef CAS PubMed.
  23. J. Kim and T. R. Lee, Langmuir, 2007, 23, 6504–6509 CrossRef CAS PubMed.
  24. G. Bokias, D. Hourdet, I. Iliopoulos, G. Staikos and R. Audebert, Macromolecules, 1997, 30, 8293–8297 CrossRef CAS.
  25. Y. Wu, F. Zhou, L. Yang and J. Liu, Chem. Commun., 2013, 49, 5025 RSC.
  26. H. Gehan, L. Fillaud, M. M. Chehimi, J. Aubard, A. Hohenau, N. Felidj and C. Mangeney, ACS Nano, 2010, 4, 6491–6500 CrossRef CAS PubMed.
  27. M. Mueller, M. Tebbe, D. V. Andreeva, M. Karg, R. A. Alvarez Puebla, N. Pazos Perez and A. Fery, Langmuir, 2012, 28, 9168–9173 CrossRef CAS PubMed.
  28. X. Liu, C. Zhang, J. Yang, D. Lin, L. Zhang, X. Chen and L. Zha, RSC Adv., 2013, 3, 3384 RSC.
  29. S. Ganta, H. Devalapally, A. Shahiwala and M. Amiji, J. Controlled Release, 2008, 126, 187–204 CrossRef CAS PubMed.
  30. F. Wang, H. He, X. Wang, Z. Li, D. Gallego-Perez, J. Guan and L. J. Lee, Anal. Chem., 2012, 84, 9439–9445 CAS.
  31. P. C. Lee and D. Meisel, J. Phys. Chem., 1982, 86, 3391–3395 CrossRef CAS.
  32. D. N. Rockwood, D. B. Chase, R. E. Akins and J. F. Rabolt, Polymer, 2008, 49, 4025–4032 CrossRef CAS PubMed.
  33. X. Wang, Y. Chen, W. Zhou, Z. Huang, Z. Guo and Y. Hu, J. Mater. Sci., 2009, 44, 4710–4714 CrossRef CAS.
  34. B. Fei, Z. Xin-Zheng, W. Zhen-Hua, W. Qiang, H. Hao and X. Jing-Jun, Chin. Phys. Lett., 2008, 25, 4463–4465 CrossRef.
  35. A. G. M. Da Silva, M. L. de Souza, T. S. Rodrigues, R. S. Alves, M. L. A. Temperini and P. H. C. Camargo, Chem.–Eur. J., 2014, 20, 15040–15046 CrossRef CAS PubMed.
  36. C. Zhang, K. Lv, H. Huang, H. Cong and S. Yu, Nanoscale, 2012, 4, 5348–5355 RSC.
  37. D. R. Willett and G. Chumanov, Plasmonics, 2014, 9, 1391–1396 CrossRef CAS.
  38. X. M. Han, J. Q. Wang, S. Zhang, F. Y. Meng and T. Han, Acta Phys. Sin., 2011, 60, 027303 Search PubMed.
  39. M. Toma, U. Jonas, A. Mateescu, W. Knoll and J. Dostalek, J. Phys. Chem. C, 2013, 117, 11705–11712 CAS.
  40. L. Zhang, Y. Bai, Z. Shang, Y. Zhang and Y. Mo, J. Raman Spectrosc., 2007, 38, 1106–1111 CrossRef CAS PubMed.
  41. H. Guo, L. Ding and Y. Mo, J. Mol. Struct., 2011, 991, 103–107 CrossRef CAS PubMed.
  42. Y. Wang, Z. Yu, W. Ji, Y. Tanaka, H. Sui, B. Zhao and Y. Ozaki, Angew. Chem., Int. Ed., 2014, 53, 13866–13870 CrossRef CAS PubMed.
  43. Y. Wang, Z. Sun, H. Hu, S. Jing, B. Zhao, W. Xu, C. Zhao and J. R. Lombardi, J. Raman Spectrosc., 2007, 38, 34–38 CrossRef CAS PubMed.
  44. Y. Zhang, S. Furyk, D. E. Bergbreiter and P. S. Cremer, J. Am. Chem. Soc., 2005, 127, 14505–14510 CrossRef CAS PubMed.
  45. S. Nath, S. Jana, M. Pradhan and T. Pal, J. Colloid Interface Sci., 2010, 341, 333–352 CrossRef CAS PubMed.
  46. C. Pérez León, L. Kador, B. Peng and M. Thelakkat, J. Phys. Chem. B, 2005, 109, 5783–5789 CrossRef PubMed.
  47. R. Gu, P. Cao and J. Yao, Spectrosc. Spectral Anal., 1999, 19, 531–534 CAS.
  48. M. C. Arndt and G. Sadowski, Macromolecules, 2012, 45, 6686–6696 CrossRef CAS.
  49. I. Anac, A. Aulasevich, M. J. N. Junk, P. Jakubowicz, R. F. Roskamp, B. Menges, U. Jonas and W. Knoll, Macromol. Chem. Phys., 2010, 211, 1018–1025 CrossRef CAS PubMed.

Footnote

Electronic supplementary information (ESI) available. See DOI: 10.1039/c5ra04361a

This journal is © The Royal Society of Chemistry 2015