High oxygen storage capacity and enhanced catalytic performance of NiO/NixCe1−xO2−δ nanorods: synergy between Ni-doping and 1D morphology

Araceli Romero-Núñez and Gabriela Díaz *
Instituto de Física, Universidad Nacional Autónoma de México, Circuito de la Investigación Científica s/n, Cd. Universitaria, México, D.F. 04510, Mexico. E-mail: diaz@fisica.unam.mx; Fax: +52 (55) 56225008; Tel: +52 (55) 56225097

Received 10th March 2015 , Accepted 11th June 2015

First published on 12th June 2015


Abstract

A series of Ni-doped ceria nanorods with low Ni content was synthesized via a hydrothermal approach and characterized by DRX, SEM, HRTEM, Raman and TPR techniques. Simultaneous tuning of morphology and composition, i.e. exposure of reactive (100) and (110) facets together with Ni substitution, provide great improvements in their physical chemical properties. Segregated NiO as a secondary phase was observed as Ni content increases affecting the growth of the nanorods. The system is described as NiO dispersed on NixCe1−xO2−δ nanorods. The materials showed a remarkably high OSC at 400 °C and good activity for CO oxidation. Results corroborate the synergic effects between Ni-doping and one-dimensional morphology on ceria structure.

1. Introduction

Ceria (CeO2) is widely used in heterogeneous catalysis because of its unique redox properties. Through a reversible redox cycle between Ce4+ and Ce3+ ions the material can intrinsically generate oxygen vacancies and form a non-stoichiometric CeO2−δ.1 The reversible redox reaction allows ceria to either release or take oxygen depending on the surface demand; this property is called oxygen storage capacity (OSC).2,3 DFT studies have already shown that the stability of the three low-index lattice planes of ceria surface follows the sequence: (111) > (110) > (100); while the activity follows the opposite order.4 Accordingly, vacancy formation is energetically favored at the most reactive ceria surfaces {110} and {100} and as a consequence, the preferential exposure of these facets is desirable for catalytic reactions, mainly oxidations.5 Morphology of a material controls the crystallographic orientation and exposes crystal surfaces that strongly influence the surface atom densities, electronic structure, and chemical reactivity.6 Ceria 1D morphologies such as nanorods, nanotubes and nanowires are structures with high aspect ratio which can expose defined facets. When anisotropic growth of cubic fluorite-like structured ceria is driven at the [011] and [211] directions, 1D structures with preferentially exposed {110} and {100} reactive facets are developed.7–9 An enhanced redox-behavior and improvements in catalytic performance of 1D ceria materials have been proved several times.7,10–16 Diverse routes of synthesis to obtain anisotropic growth and the consequent 1D structure have been well documented; hydrothermal synthesis using high concentrations of NaOH is one of the most efficient procedures to obtain these morphologies.15

On the other hand, not only morphology, but also composition can improve the catalytic performance of materials.17 Incorporation of an additional component, for example a metal, either by impregnation or doping allows the materials to enhance their catalytic properties. Ceria host structure has been doped with a wide variety of cations from which divalent transition metals are specially interesting.18–20 Through the formation of a substitutional solid solution, MxCe(1−x)O2−δ, with the divalent cation, an extrinsic oxygen vacancy is created in order to fulfill charge neutrality.1,17

Recently, the Ni–O–Ce system has attracted great interest due to their high activity and stability and low cost for catalytic applications; also, it has been described as an alternative for noble metal catalysts for CO oxidation.18,21,22

An oxygen-deficient Ni-doped ceria solid solution, NixCe1−xO2−δ, is formed when Ni2+ substitutes a Ce4+ ion into the ceria host structure. Once a limit of solubility is reached, the excess of Ni is segregated and NiO is formed; this second phase could be highly dispersed at the surface of the principal phase or forming larger particles. Even though some studies have reported the limit of solubility for the Ni–O–Ce system; complementary studies show that it depends on the preparation method and post-treatments.23 The distribution of Ni species is the most critical factor for catalytic properties, thus, the system has been described as a hetero-structure NiO/NixCe1−xO2−δ where Ni species have different interactions with the CeO2 host structure.24–26 The strongest interaction is that of the Ni2+ which is incorporated inside the ceria structure forming a solid solution. According to the dispersion degree and particle size of the outside NiO, this phase and the solid solution could have interactions which vary from strong to weak. Structural characterization of the Ni–O–Ce system and other doped hetero-structures requires the use of several techniques. In general, identification of this and other solid solutions is achieved by a combination of XRD with another M–O bond sensitive technique as Raman, XPS or H2-TPR.17,27

Although 1D morphology and metal-doping have been widely separately studied, only a small number of materials that combine both modifications have been synthesized.28–32 Theoretical studies of (111) and (110) Ni-doped ceria surfaces have been done by Nolan.33 Ni is predicted to adopt a four-coordinated square planar environment near the surface; in order to maintain this configuration, active oxygen vacancies will be easily created by removing oxygen coordinated with two Ce ions. These active vacancies are especially active in oxidation reactions. In the basis of this evidence, the results found by Nolan could be seen as a prediction of the utility of 1D Ni-doped ceria materials for catalysis, in particular for oxidation reactions.

As control over morphology and composition are the main approach to promote the catalytic performance of ceria based nanomaterials,34 this work concerns the synthesis and characterization of a series of 1D ceria nanorods doped with low Ni content.

At present time, no 1D Ni-doped ceria materials have been reported. Synthesis involves a controlled precipitation step followed by a hydrothermal treatment and a final calcination. The synergic effects of simultaneously Ni-doping and 1D morphology of ceria were confirmed using OSC and CO oxidation probes.

2. Experimental

2.1. Synthesis of materials

Synthesis of 1D undoped-ceria and novel 1D Ni–Ce–O system was achieved by hydrothermal approach. The method proposed by Mai et al.35 for 1D-CeO2 synthesis was modified in order to get simultaneously Ni into the ceria host structure and anisotropic morphology. In particular, precipitation and hydrothermal temperatures as well as type of precursors were modified. Appropriated amounts of NiCl2 (Aldrich, 98%) and CeCl3 (Aldrich, 99.99%) were mixed in 50 mL of deionized water for 10 min; total cation concentration was maintained at 0.15 M. The resulting solution was added drop wise to a 9 M NaOH solution previously heated at 70 °C and aged for 1 h under vigorous stirring. Subsequently, the formed slurry was transferred into a 150 mL Teflon line stainless steel reactor for hydrothermal treatment at 140 °C for 24 h under autogenous pressure. Afterwards, the reactor was quenched with cold water; the obtained products were centrifuged and washed with deionized water several times until neutral pH was reached. Finally, samples were dried at 70 °C for 12 h and calcined at 400 °C under air flow (30 mL min−1) for 3 h. NixCe1−xO2−δ samples with Ni-doping atomic percentages of 0, 3, 7, 9 were prepared and identified as 1D-CeO2, 1D-CeNi3, 1D-CeNi7 and 1D-CeNi9. The Ni-doping atomic percentage was calculated as:
image file: c5ra04259c-t1.tif

In addition, a 1D Ni-doped sample with high Ni loading (25 at.% Ni) was prepared (1D-CeNi25) and thermally treated at 400 °C as the other 1D samples. The corresponding weight percentages of Ni and Ni/Ce atomic ratio in each sample are shown in Table 1.

Table 1 Ni content of the 1D Ni–O–Ce system
Sample Nominal Ni-doping EDS Ni (wt%)
Ni (at.%) x in NixCe1−xO2−δ Ni/Ce at. ratio Ni (wt%)
1D-CeO2 0 0
1D-CeNi3 3 0.03 0.031 1.04 1.0 (3)
1D-CeNi7 7 0.07 0.075 2.48 2.4 (1)
1D-CeNi9 9 0.09 0.099 3.23 3.0 (3)
1D-CeNi25 25 0.25 0.333 9.93 9.8 (4)


Reference NiO supported on 1D-CeO2 sample was synthesized by incipient wetness impregnation (IWI)36 using Ni(NO2)3·6H2O (Aldrich, 99.99%) as Ni precursor. The sample was calcined at 400 °C for 3 h and identified as X-IWI-NiO/CeO21D, where X = 1 corresponds to the Ni loading (1 wt% Ni). Bulk NiO reference sample was prepared following the hydrothermal procedure used for the 1D Ni–Ce–O system. This material was calcined also at 400 °C.

2.2. Structure characterization

Structural characterization of the materials was achieved by electron microscopy techniques in a JEM 2010 FasTem analytical microscope equipped with a Z-contrast annular detector (HAADF). The samples were ultrasonically dispersed in ethanol for 20 s and a single drop of the dispersion was deposited on commercial lacey-carbon coated Cu grids (300 mesh) for observation. SEM analysis was performed in a JEOL 7800 Scanning Electron Microscopy equipped with field emission gun and X-Max® SDD X-ray Detector. X-ray diffraction (XRD) analysis was carried out in a Bruker D8 Advance diffractometer with Cu Kα (λ = 0.154 nm) radiation equipped with a Lynx Eye detector. Rietveld refinement of XRD data using the whole diffraction pattern37 was performed with the Bruker TOPAS 3 code. The nature of M–O bond was analyzed with Raman spectroscopy using a Thermo Scientific DRX Raman Microscope with an excitation wavelength of 532 nm and a resolution of 2 cm−1. Two spectra were obtained for each sample. All Raman spectra were recorded at ambient conditions. BET specific surface areas were obtained from analysis in a Quantachrome Autosorb MP-1 using N2 as adsorbate.

2.3. Physical chemical properties and CO oxidation

Reduction properties of the 1D samples and bulk NiO were studied by hydrogen temperature programmed reduction (H2-TPR) in a RIG multitask unit equipped with a thermal conductivity detector (TCD). Reduction profiles were recorded using 0.050 g of each sample under a 5 vol.% H2/N2 flow of 30 mL min−1 and a heating rate of 5 °C min−1 from room temperature to 650 °C. The H2O produced by the reduction process was trapped before the TCD.

Oxygen storage capacity (OSC) was determined at 400 °C following the procedure described by Mai et al.35 using pulses of CO under oxygen free atmosphere to achieve reaction (1)

 
xCO + CeO2 → CeO2−x + xCO2(1)

A fixed bed flow reactor in line with a HIDEN mass spectrometer was used for this purpose. Firstly, 0.020 g of catalyst was pretreated in situ at 300 °C for 30 min under 20 vol.% O2/He flow; then the system was purged with argon for 10 min at the same temperature. Afterwards, pulses of 1 mL of 5 vol.% CO/Ar were injected and the CO and CO2 concentrations were followed by MS. A 5 min lapse between pulses was established. OSC values were determined by the amount of CO2 produced after 20 pulses as no modification in the emerging CO pulses was observed. Each experiment was carried out by duplicate and the results averaged to obtain the final OSC value.

Activity tests for CO oxidation were carried out in a fixed bed flow reactor charged with 0.050 g of catalyst. The feed gas composition was 1 vol.% CO, 1 vol.% O2 and He balance with a total flow of 60 mL min−1. Reaction was followed from 50 °C to 400 °C and the products were analyzed by gas chromatography using a Carboxen 1000 Supelco column and a TCD.

3. Results and discussion

3.1. Electron microscopy and elemental analyses

Synthetized undoped ceria and Ni-doped ceria materials show a one-dimensional (1D) rod-like morphology as can be seen in typical SEM images presented in Fig. 1(a) and (b). The length value of the 1D structures is wide ranging from 100–1000 nm with diameters around 20 nm for low nickel doping (≤9 at.% substitution), Fig. 1(a), but these parameters changed significantly when the Ni doping was higher (25 at.% substitution), Fig. 1(b); 1D structures became clearly wider (30–150 nm) and shorter (60–500 nm). Lattice fringe spacing determined by HRTEM in 1D Ni-doped samples is consistent with those of the ceria structure, Fig. 1(c) and (d). Two direction growths were identified: the classical [110] and also the [211]. The [110] growth direction, which was found in all samples, exhibits the (111), (200) and (220) planes with interplanar spacing of 0.31 nm, 0.27 nm and 0.19 nm respectively, Fig. 1(c). This growth direction is the most commonly reported by other works on ceria nanorods. On its side, the [211] growth direction exhibits {220} facets, with interplanar spacing of 0.27 nm, Fig. 1(d). This configuration suggests an oriented-attached growth mechanism as previous works describe.38–40 By combining [110] and [211] growth directions, is expected a preferential exposure of {110} and {110} reactive surfaces in combination with a low proportion of {111} less reactive surfaces.
image file: c5ra04259c-f1.tif
Fig. 1 Typical electron microscopy images of the 1D ceria-based structures (a) SEM image of 1D-CeNi7 sample, (b) SEM image of 1D-CeNi25 sample, (c) and (d) HRTEM images of 1D-CeNi3 sample showing [110] and [211] growth directions.

The Ni content as determined by SEM–EDS analysis was in good agreement with the nominal one, Table 1. In order to examine the Ni distribution at the large scale in 1D Ni-doped samples, SEM–EDS mapping of cerium and nickel was recorded, Fig. 2(a). Results reveal that both nickel and cerium are uniformly distributed. Complementarily, analysis of few nanorods was also performed through HAADF–EDS elemental analysis, Fig. 2(b). As observed, also at this scale, both Ni and Ce are also well distributed.


image file: c5ra04259c-f2.tif
Fig. 2 Elemental mapping (Ce, Ni) by EDS in 1D-CeNi3 sample (a) SEM and (b) HAADF images.

On the other hand, few nanoparticle-like structures attached to the nanorods of both undoped and Ni-doped samples were observed by TEM. In order to establish the nature of these particle-like structures, EDS analysis was performed. Fig. 3(a) shows a typical image of 1D-CeNi3 sample along with the EDS spectrum of the region enclosed in a square. As the analysis showed, no conclusive evidence of Ni was obtained with predominance of Ce in the EDS spectrum; however at higher Ni loadings the evident Ni peak confirms that some of these structures are segregated NiO, Fig. 3(b) and (c). Some other structures showed only Ce atoms. The presence of CeO2 structures attached to the nanorods may be explained by the growth mechanism which consists of self-assembling of adjacent nanoparticles sharing common crystallographic orientation developing by this an anisotropic structure. The CeO2 structures may come from a second growth process via Ostwald ripening.39 On the other hand, as the preparation method of these 1D systems is focused not only on the assembling of the 1D morphology but also on the formation of the solid solution, further research on the synthesis parameters and growth mechanism in these 1D Ni-doped ceria nanostructures to control segregation of NiO needs to be further investigated.


image file: c5ra04259c-f3.tif
Fig. 3 EDS elemental analysis performed on particle-like structures at the surface of synthetized 1D Ni-doped samples. Spectra correspond to the enclosed area in the TEM image of (a) 1D-CeNi3, (b) 1D-CeNi9 and (c) 1D-CeNi25 samples.

3.2. X-ray diffraction

Once the 1D morphology was confirmed, the next step is to corroborate the formation of a Ni–ceria solid solution. XRD, Fig. 4(a), revealed a fluorite-like ceria structure (JCPDS-34-0394) for all samples together with signals corresponding to NiO cubic phase (JCPDS-89-7130). The ratio between the two phases is dependent on the Ni content. In the case of 1D-CeNi3 sample, a signal whose intensity is in the signal/noise limit gives some indication of NiO at 2-theta value around 43°. For higher Ni doping diffraction peaks corresponding to NiO phase are recognizable as small peaks. XRD pattern of sample 1D-CeNi25 showed in addition, an effect of Ni loading on the crystal growth of ceria as evidenced by the lower intensity of the diffraction peaks of ceria, Fig. 4(c). As the SEM analysis showed the 1D structures in this sample were shorter and wider, Fig. 1(b). Regarding the ceria phase, a shift to higher 2-theta values is observed for Ni-doped samples, Fig. 4(b).
image file: c5ra04259c-f4.tif
Fig. 4 (a) XRD patterns of (a) 1D-CeO2, (b) 1D-CeNi3, (c) 1D-CeNi7, (d) 1D-CeNi9, (e) 1D-CeNi25 samples after calcination at 400 °C. (b) Shift to higher 2-theta values of (111) reflection of ceria as a function of Ni loading. (c) Region where the most intense NiO diffraction peaks appear.

Rietveld structure refinement taking the entire diffraction pattern was done in order to analyze these features, Table 2. The quantitative phase analysis evidence that only a fraction of the total loaded Ni in the samples is forming the NiO phase; suggesting that Ni can be incorporated in the ceria host structure. In addition, Rietveld analysis of the ceria-like phase revealed a contraction of the lattice of 1D Ni-doped samples when compared with the undoped 1D-CeO2. A clear trend in this feature is observed as Ni loading increases. This behavior is related to the formation of a substitutional solid solution in agreement with previous reports.17,41–43 Since Ni2+ (69 Å) has a much smaller ionic size compared to Ce4+ (97 Å), Ni ion can replace a Ce ion in the fluorite lattice producing shrinkage of the lattice. Although the dopant could also occupy an interstitial site, solid solutions involving substitutional Ni ions are predicted to become thermodynamically more stable than those containing interstitial defects.44 The formation of the substitutional solid solution, in which a Ni2+ replace a Ce4+, produces an oxygen vacancy in order to maintain charge neutrality.17,41 The contraction originated by the introduction of the smaller size dopant is compensated by the expansion caused by the formation of the oxygen vacancy, and therefore the lattice parameter of the solid solution results to be very close to that of the undoped ceria.23,45 This effect is observed in the present study as listed in Table 2. Then, according to the Rietveld analysis two Ni species can be identified in these samples: Ni incorporated in the ceria structure leading to a solid solution and dispersed NiO phase. In the particular case of 1D-CeNi3, either all Ni is incorporated in the ceria structure or some amount of Ni coexists as well dispersed or amorphous NiO with the former.18,46–49 As Ni loading increases, contribution of NiO becomes important and the trend in the lattice parameter of ceria suggests that the amount of Ni in the ceria framework is also increasing, Table 2. According with empirical parameters of the formation of solid solutions, only low Ni loadings are expected to be incorporated in the ceria structure due to differences in electronegativity, valence and crystal structure between NiO and CeO2. Further discussion on the solid solution formation will be provided by the Raman analysis.

Table 2 Rietveld analysis of 1D samples after calcination at 400 °C
Sample Nominal Ni (wt%) Ni (wt%) as NiOa Cell parameter (Å) Mean crystal size (Å) Rwp
a Calculated based on the total NiO wt% obtained by Rietveld refinement. b Not available due to very weak NiO signals in XRD pattern.
1D-CeO2 5.4145 (3) 135 (2) 9.29
1D-CeNi3 1.04 n.d.b 5.4130 (2) 193 (1) 9.99
1D-CeNi7 2.48 1.10 5.4123 (2) 197 (2) 8.96
1D-CeNi9 3.23 1.17 5.4117 (2) 186 (3) 8.61
1D-CeNi25 9.93 7.81 5.4109 (3) 160 (1) 8.46


Finally, average crystallite size for 1D-Ni doped samples is around 20 nm for low Ni content while it is lower for 1D-CeO2 and 1D-CeNi25.

3.3. Raman spectroscopy

Raman spectra of 1D-CeO2 and 1D Ni-doped sample are shown in Fig. 5. Raman spectrum of 1D-CeO2 shows the typical Raman active modes of fluorite crystal structure. The F2g signal, which is ascribed to the symmetrical stretching mode of the [Ce–O8] vibrational unit, appears at 466 cm−1. Also, bands can be seen at 610 cm−1 and 260 cm−1, which are assigned to the so-called Frenkel defect-induced mode (D mode) and to the transverse second-order acoustic vibrational mode (2TA), respectively.50,51 Spectra of doped samples resemble the one of the 1D-CeO2, but a slight shift to lower frequency is observed for the F2g and 2TA signals. Also, the intensity of 2TA and D peaks increased with Ni-doping concentration. The down shift in F2g signal is commonly interpreted as lattice distortions due to formation of the solid solution.18,47 This assumption is further confirmed by the increase of the 260 cm−1 and 610 cm−1 signals which are related to the formation of lattice defects, mostly oxygen vacancies.18,24,52 In Fig. 6 the 2TA/F2g intensity ratios of Ni-doped samples suggest that the content of oxygen vacancies increased with Ni-doping. According to this trend, the oxygen vacancy content follows the order 1D-CeO2 ≪ 1D-CeNi3 < 1D-CeNi7 < 1D-CeNi9 < 1D-CeNi25. Only for 1D-CeNi25 signals of NiO phase seem to be observed at the reported frequency for such material (lit.,41 524 cm−1). In the other Ni-doped samples the apparent absence of NiO signals could be a sign of their very low concentration when compared with the principal phase. This is in line with the NiO concentration obtained from Rietveld quantitative phase analysis.
image file: c5ra04259c-f5.tif
Fig. 5 Raman spectra of (a) 1D-CeO2, (b) 1D-CeNi3, (c) 1D-CeNi7, (d) 1D-CeNi9 and (e) 1D-CeNi25 doped materials.

image file: c5ra04259c-f6.tif
Fig. 6 2TA/F2g intensity ratio of 1D-CeO2, 1D-CeNi3, 1D-CeNi7, 1D-CeNi9 and 1D-CeNi25 samples.

3.4. Thermo-programmed reduction (H2-TPR)

In order to evaluate the reducibility of 1D-NiCe materials and the strength of the interaction between the NiO secondary phase and the solid solution, H2-TPR characterization was performed in the temperature range 100–650 °C, Fig. 7. Profiles with hydrogen consumptions in this range are well documented to provide information of the surface reduction of metal-CeO2 systems. As reduction of bulk CeO2 takes place at higher temperatures (∼700–800 °C),1 this feature is not studied in the present work. For 1D-CeO2 sample, a wide signal centered at 500 °C appears which is ascribed to surface oxygen reduction of the material; the shape of the signal also resembles the already reported for ceria nanorods.2 In the case of 1D Ni-doped system a well-defined hydrogen consumption peak which changed as a function of the material composition characterizes the TPR profiles. Three main hydrogen uptake zones can be identified: below 305 °C (A); below 380 °C (B) and below 460 °C (C).
image file: c5ra04259c-f7.tif
Fig. 7 H2-TPR profiles of (a) 1D-CeO2, (b) 1D-CeNi3, (c) 1D-CeNi7, (d) 1D-CeNi9, (e) 1D-CeNi25 and (f) NiO samples.

1D-CeNi3 sample shows a single peak which dominates the C zone and low hydrogen uptake at lower temperature (A zone). By increasing Ni concentration, peaks at B zone develop along with increased uptakes at the A zone. On the ceria side, the reduction peak around 500 °C is no longer observed.

Hydrogen uptakes at low temperature have been attributed to the reduction of reactive oxygen species like peroxides adsorbed at surface oxygen vacancies of Ni-ceria solid solution.18,22,24,26,47,53 Reduction temperatures of the Ni–CeO2 system will depend on the interaction between the Ni and the ceria host structure; thus, stronger interactions are characterized by the higher reduction temperatures.23,46,48,54

On the other hand, reduction temperatures of bulk-like or free NiO phase reported in the literature are quite diverse depending on the particle size.23,25,53,55 The reduction peaks at higher temperatures are ascribed to reduction of larger NiO particles and these temperatures are further modified if interaction with the support takes place.

According to this and results in Fig. 7 various Ni species are being reduced in these 1D-Ni-doped samples. The peak in the 1D-CeNi3 sample is attributed to the reduction of a dispersed NiO phase interacting strongly with the 1D-NixCe1−xO2−δ solid solution. As Ni content increases, larger NiO particles are formed whose reduction temperature in the range 380–306 °C suggests bulk-like behavior with lower interaction with the support. The reduction at 355 °C of bulk NiO powder taken as reference, Fig. 7(f), corroborates this. It is worth to notice that B reduction zone is dominated by the reduction of NiO species in low interaction with the 1D-NixCe1−xO2−δ solid solution, while C reduction zone includes the reduction of both NiO in weak and strong interaction with the solid solution support.

The quantitative analysis of the hydrogen consumption in the range 150–500 °C is presented in Table 3. As observed, the experimental value is higher than the required for the reduction of all the Ni detected by EDS assuming the reaction: NiO + H2 → NiO + H2O. This confirms that the surface reduction of ceria support is taking place at the same time as that of nickel oxide explaining the absence of the reduction peak at 500 °C. The reducibility of ceria improves in the presence of metals due to spillover effects.56 Decomposition of the reduction peaks allowed to identity the hydrogen uptake associated to each reduction zone. The uptake in A zone increases as oxygen vacancies increases following the results of Raman characterization. The hydrogen uptake of B zone follows the increase of Ni concentration, which is in line with XRD quantitative phase analysis. The trend observed in the hydrogen uptake indicates that the reduction of larger NiO particles identified by TEM in samples with a Ni loading >3 at.% dominates the process. The contribution of ceria surface reduction assumed to take place at the same time that the one of NiO is difficult to establish only with the current technique.

Table 3 Quantitative analysis of H2 uptake of Ni-doped ceria nanorods
Sample Experimental H2 uptake (mmol) Theoretical H2 uptakea (mmol) H2 uptake (mmol)
A B C
a Calculated by assuming total reduction of Ni detected by EDS.
1D-CeNi3 0.0447 0.0089 0.0091 0.0063 0.0293
1D-CeNi7 0.0589 0.0211 0.0102 0.0344 0.0142
1D-CeNi9 0.0669 0.0275 0.0105 0.0370 0.0194
1D-CeNi25 0.1212 0.0827 0.0119 0.0892 0.0201


In summary, the present characterization results (TEM, XRD, TPR and Raman results), as other reports in the literature about the Ni–CeO2 system, identify three Ni species; Ni2+ present into the fluorite lattice forming the 1D-NixCe1−xO2−δ solid solution, and NiO in low and high interaction with the surface of the former allowing to describe the materials as NiO dispersed on NixCe1−xO2−δ nanorods were Ni content determines the interaction degree of NiO second phase.

3.5. Oxygen storage capacity (OSC)

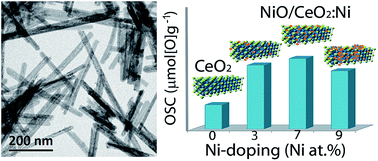
Fig. 8 displays the OSC of the 1D nanostructures (1D-CeO2 and 1D-CeNi samples with Ni doping ≤9 at.%) and the 1-IWI-NiO/CeO21D reference sample. The 1D-CeO2 shows an OSC value of 625 μmol [O] g−1; other reports for ceria nanorods show a lower value (lit.,35 554 μmol [O] g−1). A great improvement in the OSC of ceria nanorods is achieved with Ni-doping. The OSC of all 1D doped samples exceed by more than twice the value of 1D-CeO2 sample; OSC values of 1615, 1785 and 1472 μmol [O] g−1 were obtained for 1D-CeNi3, 1D-CeNi7 and 1D-CeNi9, respectively. A reference 1-IWI-NiO/CeO21D sample shows an OSC of 548 μmol [O] g−1, which is lower than the OSC of the 1D-CeO2 support. The origin of the enhancement of the OSC for 1D Ni-doped samples is supposed to be related to their unique structure and morphology. In addition to the oxygen vacancy stabilization previously mentioned, the incorporation of Ni into the ceria host structure leads to a lower formation energy, ΔEv, required to make an oxygen vacancy near the location of the dopant.17 Indeed, ΔEv is lower for the (110) surface than for the (111) surface for Ni-doped ceria solid solutions.33
image file: c5ra04259c-f8.tif
Fig. 8 OSC values of 1D-CeO2, 1D-CeNi3, 1D-CeNi7, 1D-CeNi9 and 1-IWI-NiO/CeO21D reference sample.

On the other hand, the volcano behavior of the OSC observed with Ni-doping is believed to be related to the contribution of NiO second phase. At first, the well-dispersed NiO provides additional active sites for the catalytic reaction, as seen for 1D-CeNi3 and 1D-CeNi7 samples. Shortly after, an excess of NiO could cause the formation of larger aggregates with lower dispersion and lower oxygen mobility, as 1D-CeNi9 sample seems to indicate. Also, the poor OSC value of the 1-IWI-NiO/CeO21D sample corroborates the premise that lower Ni substitution, if any in this sample, provides less OSC. Additionally, as-prepared 1D Ni-doped materials exhibit exceptionally high OSC values when compared with some previously reported Ni-ceria solid solutions (lit.,41 500 μmol [O] g−1). The mutual promotion effect of 1D morphology as well as Ni-doping is believed to synergistically contribute for the higher OSC of the prepared samples corroborating the theoretical prediction.33

3.6. Catalytic properties for CO oxidation

CO is not only an important probe molecule for catalytic activity of heterogeneous catalysts, but also its oxidation has clear significance in real application on environmental issues.57 The catalytic performance for CO oxidation displayed by 1D-CeO2 and 1D Ni-doped material with Ni doping ≤9 at.%, is shown in Fig. 9. As expected, the CO oxidation activity follows the OSC trend shown in Fig. 8. The improvement in the activity is related to the high number of oxygen vacancies which can be achieved in the 1D Ni-doped structure and to the NiO dispersed over its surface which acts as a second active phase. However, a balance between these two features is needed as the 1D-CeNi9 sample seems to indicate; despite the high number of defects in this sample as shown by Raman spectroscopy, Fig. 6, activity is not enhanced in comparison to 1D-CeNi7 sample.
image file: c5ra04259c-f9.tif
Fig. 9 Catalytic performance for CO oxidation of 1D-CeO2, 1D-CeNi3, 1D-CeNi7 and 1D-CeNi9 materials. Feed: 1% CO, 1% O2 and He balance, of 0.050 g of catalyst.

In order to compare the catalytic activity showed by different reported Ni-doped ceria systems and our 1D Ni-doped samples, Table 4 tabulates their respective half-conversion temperature, T50, which is the temperature at which the 50% of CO conversion is achieved. It must be noticed that the oxygen concentration in some reported studies exceeds significantly the one used in this paper along with larger SBET areas and Ni loading. Despite this, the as-prepared 1D catalysts with less Ni content show lower T50 for CO oxidation compared to samples with no-anisotropic morphologies. These results indicate that the use of 1D-morphology can lead to smaller metal loadings with preservation of positive effects in catalytic properties of ceria.

Table 4 Catalytic performance for CO oxidation of Ni–O–Ce systems
Catalyst Ni wt% S BET (m2 g−1) T 50 (°C) Conditions CO[thin space (1/6-em)]:[thin space (1/6-em)]O2 Ref.
Ni5–CeO2 2.12 58 ∼410 1% CO, 1% O2/He 1[thin space (1/6-em)]:[thin space (1/6-em)]1 Y. Park46
5NiO/CeO2 2.12 220 290 4% CO, 2.05% O2/He 2[thin space (1/6-em)]:[thin space (1/6-em)]1 Yakimova58
Ni–CeO2 3.8% 3.8 122 175 1% CO, 16% O2/He 1[thin space (1/6-em)]:[thin space (1/6-em)]16 T. Li34
meso-Ni0.05Ce 1.75 111 175 1.6% CO, 20.8% O2/N2 1[thin space (1/6-em)]:[thin space (1/6-em)]13 C. Tang22
1D-CeO2 0 50 351 1% CO, 1% O2/He 1[thin space (1/6-em)]:[thin space (1/6-em)]1 This work
1D-CeNi3 1.04 51 229 1% CO, 1% O2/He 1[thin space (1/6-em)]:[thin space (1/6-em)]1 This work
1D-CeNi7 2.48 54 176 1% CO, 1% O2/He 1[thin space (1/6-em)]:[thin space (1/6-em)]1 This work
1D-CeNi9 3.23 55 216 1% CO, 1% O2/He 1[thin space (1/6-em)]:[thin space (1/6-em)]1 This work


4. Conclusions

A series of Ni-doped ceria nanorods with low Ni contents (3, 7 and 9 at.%) were synthesized using a hydrothermal approach. Anisotropic growth in [110] and [211] directions was identified providing preferential exposure of (110) and (100) reactive surfaces in combination with the less reactive (111) one. Different Ni species interacting with ceria were identified; Ni incorporated into ceria lattice forming the NixCe1−xO2−δ solid solution and dispersed NiO interacting with the surface of the former with different strength. The Ni-content was found to affect physical and chemical properties of the material. The investigated 1D Ni-doped ceria catalysts displayed excellent OSC and CO conversions compared to 1D-CeO2 and other Ni-doped ceria systems. The highest OSC and CO conversion was observed for 7 at.% doped sample which can be described as well dispersed NiO on NixCe1−xO2−δ nanorods. The properties of the materials are ascribed to the strong synergic effect between 1D morphology and Ni-doping. On the other hand, as the preparation method of these 1D systems is focused not only on the formation of the solid solution but also on the assembling of the 1D morphology, further research on the synthesis parameters and growth mechanism to control segregation of NiO is needed.

Acknowledgements

Authors want to thank CONACyT-176509 and PAPIIT-IN107512 for funding. Antonio Gómez-Cortés for technical support, LCM-IF (Roberto Hernández, Orlando Hernández, Mario Monroy and Carlos Magaña) for TEM and SEM images; Cristina Zorrilla for Raman spectra and LAREC-IF (Manuel Aguilar and Antonio Morales) for XRD assistance. ARN also thanks CONACyT Becas Nacionales for the 332648 scholarship.

References

  1. Catalysis by Ceria and Related Materials, ed. A. Trovarelli, Imperial College Press, London, 2002 Search PubMed.
  2. T. Taylor, Catal. Rev.: Sci. Eng., 1996, 38, 439–520 Search PubMed.
  3. T. A. Na, L. I. U. Jimmy and S. Wenjie, Chin. J. Catal., 2013, 34, 838–850 CrossRef.
  4. D. Zhang, X. Du, L. Shi and R. Gao, Dalton Trans., 2012, 14455–14475 RSC.
  5. M. Nolan, S. C. Parker and G. W. Watson, Surf. Sci., 2005, 595, 223–232 CrossRef CAS.
  6. S. K. Meher and G. R. Rao, J. Colloid Interface Sci., 2012, 373, 46–56 CrossRef CAS PubMed.
  7. K. Zhou and Y. Li, Angew. Chem., Int. Ed. Engl., 2012, 51, 602–613 CrossRef CAS PubMed.
  8. K. Zhou, X. Wang, X. Sun, Q. Peng and Y. Li, J. Catal., 2005, 229, 206–212 CrossRef CAS.
  9. G. Yi, Z. Xu, G. Guo, K. Tanaka and Y. Yuan, Chem. Phys. Lett., 2009, 479, 128–132 CrossRef CAS.
  10. R. Pérez-Hernández, G. Mondragón-Galicia, A. Allende Maravilla and J. Palacios, Phys. Chem. Chem. Phys., 2013, 15, 12702–12708 RSC.
  11. T. Désaunay, G. Bonura, V. Chiodo, S. Freni, J. Couzinié, J. Bourgon, A. Ringuedé, F. Labat, C. Adamo and M. Cassir, J. Catal., 2013, 297, 193–201 CrossRef.
  12. G. Chen, C. Xu, X. Song, W. Zhao, Y. Ding and S. Sun, Inorg. Chem., 2008, 47, 723–728 CrossRef CAS PubMed.
  13. C. Pan, D. Zhang, L. Shi and J. Fang, Eur. J. Inorg. Chem., 2008, 2008, 2429–2436 CrossRef.
  14. K.-S. Lin and S. Chowdhury, Int. J. Mol. Sci., 2010, 11, 3226–3251 CrossRef CAS PubMed.
  15. S. Chowdhury and K.-S. Lin, J. Nanomater., 2011, 2011, 1–16 CrossRef.
  16. X. Du, D. Zhang, L. Shi, R. Gao and J. Zhang, J. Phys. Chem. C, 2012, 116, 10009–10016 CAS.
  17. E. W. McFarland and H. Metiu, Chem. Rev., 2013, 113, 4391–4427 CrossRef CAS PubMed.
  18. S. Mahammadunnisa, P. Manoj Kumar Reddy, N. Lingaiah and C. Subrahmanyam, Catal. Sci. Technol., 2013, 3, 730–736 CAS.
  19. A. B. Kehoe, D. O. Scanlon and G. W. Watson, Chem. Mater., 2011, 23, 4464–4468 CrossRef CAS.
  20. Y. Zuo, L. Li, X. Huang and G. Li, Catal. Sci. Technol., 2014, 4, 3368–3378 CAS.
  21. J. Zhang, J. Guo, W. Liu, S. Wang, A. Xie, X. Liu, J. Wang and Y. Yang, Eur. J. Inorg. Chem., 2015, 2015, 969–976 CrossRef CAS.
  22. C. Tang, J. Li, X. Yao, J. Sun, Y. Cao, L. Zhang, F. Gao, Y. Deng and L. Dong, Appl. Catal., A, 2015, 494, 77–86 CrossRef CAS.
  23. L. Barrio, A. Kubacka, G. Zhou, M. Estrella, A. Martínez-Arias, J. C. Hanson, M. Fernández-García and J. A. Rodriguez, J. Phys. Chem. C, 2010, 114, 12689–12697 CAS.
  24. X. Liu, Y. Zuo, L. Li, X. Huang and G. Li, RSC Adv., 2014, 4, 6397 RSC.
  25. W. Shan, M. Luo, P. Ying, W. Shen and C. Li, Appl. Catal., A, 2003, 246, 1–9 CrossRef CAS.
  26. L. Pino, A. Vita, F. Cipitì, M. Laganà and V. Recupero, Catal. Lett., 2007, 122, 121–130 CrossRef.
  27. O. H. Laguna, M. A. Centeno, M. Boutonnet and J. A. Odriozola, Appl. Catal., B, 2011, 106, 621–629 CrossRef CAS.
  28. S. Liang and G. Veser, Catal. Lett., 2012, 142, 936–945 CrossRef CAS.
  29. J. G. Sacanell, A. G. Leyva and R. T. Baker, Chem. Mater., 2008, 20, 7356–7363 CrossRef.
  30. Y. Du, S. Shi, H. He and H. Dai, Particuology, 2011, 9, 63–68 CrossRef CAS.
  31. P. Maitarad, D. Zhang, R. Gao, L. Shi, H. Li, L. Huang, T. Rungrotmongkol and J. Zhang, J. Phys. Chem. C, 2013, 117, 9999–10006 CAS.
  32. J. Ke, J. Xiao, W. Zhu, H. Liu, R. Si, Y. Zhang and C. Yan, J. Am. Chem. Soc., 2013, 135, 15191–15200 CrossRef CAS PubMed.
  33. M. Nolan, J. Mater. Chem., 2011, 21, 9160–9168 RSC.
  34. T. Li, G. Xiang, J. Zhuang and X. Wang, Chem. Commun., 2011, 47, 6060–6062 RSC.
  35. H. X. Mai, L. D. Sun, Y. W. Zhang, R. Si, W. Feng, H. P. Zhang, H. C. Liu and C. H. Yan, J. Phys. Chem. B, 2005, 109, 24380–24385 CrossRef CAS PubMed.
  36. F. Pinna, Catal. Today, 1998, 41, 129–137 CrossRef CAS.
  37. M. Leoni, R. Di Maggio, S. Polizzi and P. Scardi, J. Am. Ceram. Soc., 2004, 87, 1133–1140 CrossRef CAS.
  38. N. Du, H. Zhang, B. Chen, X. Ma and D. Yang, J. Phys. Chem. C, 2007, 111, 12677–12680 CAS.
  39. Z. Ji, X. Wang, H. Zhang, S. Lin, H. Meng, B. Sun, S. George, T. Xia, A. E. Nel and J. I. Zink, ACS Nano, 2012, 6, 5366–5380 CrossRef CAS PubMed.
  40. A. S. Karakoti, S. V. N. T. Kuchibhatla, D. R. Baer, S. Thevuthasan, D. C. Sayle and S. Seal, Small, 2008, 4, 1210–1216 CrossRef CAS PubMed.
  41. Y.-M. Liu, L.-C. Wang, M. Chen, J. Xu, Y. Cao, H.-Y. He and K.-N. Fan, Catal. Lett., 2009, 130, 350–354 CrossRef CAS.
  42. C. Lamonier, A. Ponchel, A. D'Huysser and L. Jalowiecki-Duhamel, Catal. Today, 1999, 50, 247–259 CrossRef CAS.
  43. A. Ponchel, A. D'huysser, C. Lamonier and L. Jalowiecki-duhamel, Phys. Chem. Chem. Phys., 2000, 2, 303–312 RSC.
  44. X. Wang, M. Shen, J. Wang and S. Fabris, J. Phys. Chem. C, 2010, 114, 10221–10228 CAS.
  45. S. Sun, X. Zhao, H. Lu, Z. Zhang, J. Wei and Y. Yang, CrystEngComm, 2013, 15, 1370–1376 RSC.
  46. Y. Park, S. K. Kim, D. Pradhan and Y. Sohn, Chem. Eng. J., 2014, 250, 25–34 CrossRef CAS.
  47. J. Wang, M. Shen, J. Wang, M. Yang, W. Wang, J. Ma and L. Jia, Catal. Lett., 2010, 140, 38–48 CrossRef CAS.
  48. J. Xu, B. Xue, Y.-M. Liu, Y.-X. Li, Y. Cao and K.-N. Fan, Appl. Catal., A, 2011, 405, 142–148 CrossRef CAS.
  49. C. Guoxing, L. I. Qiaoling, W. E. I. Yucai, F. Weiping and Y. Yiquan, Chin. J. Catal., 2013, 34, 322–329 CrossRef.
  50. W. Shi, Y. Li, J. Hou, H. Lv, X. Zhao, P. Fang, F. Zheng and S. Wang, J. Mater. Chem. A, 2013, 1, 728–734 CAS.
  51. R. V. Gulyaev, T. Y. Kardash, S. E. Malykhin, O. A. Stonkus, A. S. Ivanova and A. I. Boronin, Phys. Chem. Chem. Phys., 2014, 16, 13523–13539 RSC.
  52. Z. Pu, J. Lu, M. Luo and Y. Xie, J. Phys. Chem. C, 2007, 11, 18695–18702 Search PubMed.
  53. B. Solsona, P. Concepción, S. Hernández, B. Demicol and J. M. López Nieto, Catal. Today, 2012, 180, 51–58 CrossRef CAS.
  54. J. Kugai, V. Subramani, C. Song, M. H. Engelhard and Y. H. Chin, J. Catal., 2006, 238, 430–440 CrossRef CAS.
  55. J. Sá, Y. Kayser, C. J. Milne, D. L. Abreu Fernandes and J. Szlachetko, Phys. Chem. Chem. Phys., 2014, 16, 7692–7696 RSC.
  56. G. Ranga Rao, Bull. Mater. Sci., 1999, 22, 89–94 CrossRef.
  57. J. Zhang, X. Gong and G. Lu, Surf. Sci., 2015, 632, 164–173 CrossRef CAS.
  58. M. S. Yakimova, V. K. Ivanov, O. S. Polezhaeva, A. A. Trushin, A. S. Lermontov and Y. D. Tretyakov, Chemistry, 2009, 427, 186–189 CAS.

This journal is © The Royal Society of Chemistry 2015