Identification of dabigatran etexilate major degradation pathways by liquid chromatography coupled to multi stage high-resolution mass spectrometry
Fatma Amrani†
a,
Philippe-Henri Secrétan†a,
Hassane Sadou-Yayéab,
Caroline Aymes-Chodura,
Mélisande Bernardac,
Audrey Solgadid,
Najet Yagoubia and
Bernard Do*ac
aUniversité Paris-Saclay, UFR de Pharmacie, Groupe Matériaux et Santé, Institut d'Innovation Thérapeutique, 5, rue Jean Baptiste Clément, 92296 Châtenay-Malabry, France. E-mail: bernard.do@parisdescartes.fr; Fax: +33146691492; Tel: +33662306275
bAssistance Publique-Hôpitaux de Paris, Groupe Hospitalier Pitié-Salpêtrière, Service de Pharmacie, 47-83 Boulevard de l'Hôpital, 75013 Paris, France
cAssistance Publique-Hôpitaux de Paris, Agence Générale des Equipements et Produits de Santé, Département de Contrôle Qualité et Développement Analytique, 7 rue du Fer à Moulin, 75005 Paris, France
dUniversité Paris-Saclay, UFR de Pharmacie, SAMM – Service d'Analyse des Médicaments et Métabolites, Institut d'Innovation Thérapeutique, 5, rue Jean Baptiste Clément, 92296 Châtenay-Malabry, France
First published on 27th April 2015
Abstract
Dabigatran etexilate (DABET) is an oral direct thrombin inhibitor that has been approved for the prevention of blood clot formation. As the active pharmaceutical ingredient (API) may undergo degradation, leading to drug activity loss or to the occurrence of adverse effects associated with degradation products, thorough knowledge of the API's stability profile is required. Since very few studies have been reported on the drug stability profile, a study related to DABET's behaviour under stress conditions was carried out in order to identify its major degradation pathways. DABET was subjected to hydrolytic (acidic and alkaline), oxidative, photolytic and thermal stress, as per ICH-specified conditions. Up to ten degradation products along with dabigatran, the active metabolite of DABET, were formed and detected by reverse phase liquid chromatography in gradient mode (LC) coupled to UV and mass spectrometry (UV-MS). Structures were determined by elemental composition determination and study of the fragmentation patterns, using high-resolution mass spectrometry in multistage mode (HR-MSn). Under hydrolytic stress conditions, O-dealkylation may occur and formation of benzimidic acid derivatives was also observed. DABET was shown to be much less susceptible to photolysis and oxidative stress, even if N-dealkylation was highlighted. In view of the structures identified, various degradation pathways of DABET have been proposed.
Introduction
Dabigatran etexilate (DABET) (ethyl 3-{[(2-{[(4-{[(hexyloxy)carbonyl]carbamimidoyl}phenyl)amino]methyl}-1-methyl-1H-benzimidazol-5-yl)carbonyl](pyridin-2-yl)amino}propanoate) is a pro-drug, rapidly converted to dabigatran after oral administration. As a direct thrombin inhibitor, DABET is used in the prevention of thromboembolic events for patients with atrial fibrillation as well as in the prevention of venous thromboembolism.1–4 It has been developed as an alternative to warfarin, an anticoagulant with a narrow therapeutic index and hence trickier to use. As the API may experience degradation, resulting in activity loss or occurrence of adverse effects associated with the appearance of degradation products, a thorough knowledge of the API's stability profile is one of the key factors to prevent these risks during manufacture, transportation and storage.5 This is why study of the API's major degradation pathways should be carried out under stress conditions, such as those recommended by the International Conference of Harmonization guidelines.6Liquid chromatography combined with multi-stage mass spectrometry (LC-MSn) has been successfully used for the identification and characterization of degradation products generated by the API.7–12 The comprehensive fragmentation pattern of API can be compared to the fragment ions of degradation products thus enabling their characterization.
Liquid chromatography methods have been used for the determination of dabigatran in plasma and other biological matrices.13–16 Impurities formed during the synthesis of DABET17 and drug metabolites18 have also been determined by LC and reported in literature. However, no study has been published on the formation and characterization of the DABET degradation products. That's why various stress conditions have been applied in order to simulate the degradation of DABET, such as hydrolysis, thermal, photolysis and oxidative conditions. The degradation products were to be detected and characterized. In view of the structures identified, major degradation pathways of DABET were to be proposed.
Experimental
Chemicals and reagent
Dabigatran etexilate (MW: 627.7332 g mol−1) tablets (Pradaxa®) are marketed by Boehringer Ingelheim (France). Analytical grade methanol and formic acid came from Sigma-Aldrich (St Quentin-Fallavier, France). Ultrapure water was produced by the Q-Pod Milli-Q system (Millipore, Molsheim, France) and used for dissolution or as a mobile phase component. Hydrogen peroxide (H2O2) 30% was provided by Carlo Erba SDS (Val de Reuil, France).LC-UV-HR-MS conditions
LC analyses were performed using a Dionex Ultimate 3000 system (DIONEX, Ulis, France) coupled to UV and MS detections. LC is equipped with a quaternary pump, a degasser, an autosampler and a thermostated column compartment, a 50 μL injection loop and a photo-diode array (PDA) detector. Kinetex™, C18 (100 Å, 50 mm × 2.1 mm, 2.6 μm) column accounted for the stationary phase. Mobile phase was composed of 2.5 mM formic acid (A) and methanol (B). The optimized gradient chromatographic program was the following: B 5% from 0 to 5 min; B 100% from 5 to 25 min with a fixed level from 25 to 28 min; B 5% from 28 to 35 min. The flow rate was set at 0.4 mL min−1. LC-HR-MSn was performed coupling this same LC system to an electrospray (ESI)-LTQ-Orbitrap Velos Pro system, composed of a double linear trap and an orbital trap (Thermo Fisher Scientific, CA, USA). Analyses were carried out in positive ion mode with the following conditions: the source voltage was set at 3.4 kV, the source and the capillary temperatures were fixed at 500 °C and 600 °C, respectively. S-lens was set at 60%. 30–40% CEL were set for high-resolution fragmentation studies. The MS data were processed using Xcalibur® software (version 2.2 SP 1.48).Forced degradation protocol
Stock standard solutions were prepared by disintegrating 10 tablets, accounting for 1500 mg DABET, in 1500 mL of ultrapure water/methanol 50/50 (v/v). The working solutions were prepared by diluting stock solution in sort to obtain a final concentration of 0.5 mg mL−1. For each condition, samples were made up in triplicate and allocated in 15 mL hermetically sealed glass vials.Four stress conditions were tested: thermal, hydrolytic, photolytic and oxidative conditions. Thermal stress was achieved at 80 °C up to 28 days. Hydrolysis was studied at 40 °C over a period of 72 hours using HCl 0.1 mol L−1 or NaOH 0.1 mol L−1. Oxidation was tested in the presence of an equivalent of 3% (v/v) H2O2, at room temperature for 72 hours. Photo-degraded samples resulted from exposure of working solutions for 45 hours to light using a xenon test chamber Q-SUN Xe-1 (Q-Lab Westlake, California, USA) operating in window mode. Wavelengths ranged from 300 to 800 nm. The light intensity delivered was at 1.50 W m−2.
Results and discussion
Degradation of DABET along with formation of degradation products
Fig. 1 shows LC-MS extracted ion chromatograms obtained by analysis of samples submitted to various stress conditions. A total of ten degradation products, along with DABET and dabigatran were detected when taken at a degradation rate near to 20%. Even if degradation continues beyond, the study has been deliberately limited to that of the degradation products formed precociously in stress conditions, insofar as the others, sometimes secondarily formed, can be considered as less likely with respect to real-storage.19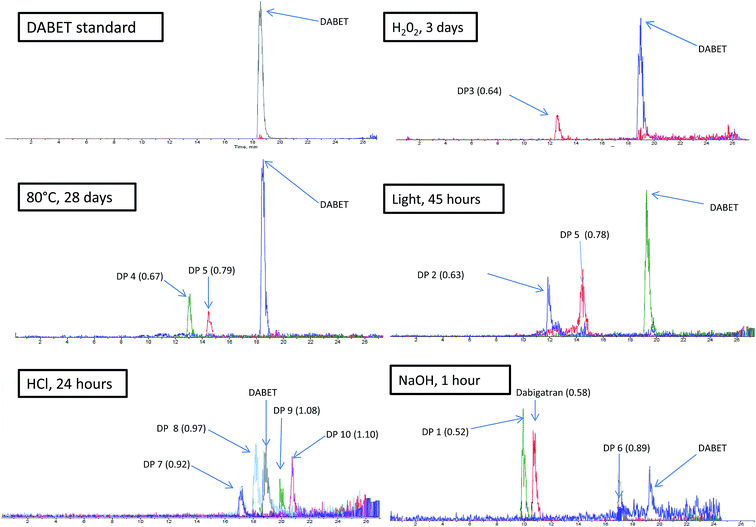 | ||
| Fig. 1 Extracted ion chromatograms of DABET and degradation products according to stress conditions. | ||
Thereafter, the degradation products are named “DP-n” and numbered according to their elution order. Their relative retention times (rrT) and the HR-MSn data (origin, exact mass, accurate mass and relative errors of degradation products and relevant product ions) are gathered in Table 1. Eight degradation products and dabigatran were eluted ahead DABET, whereas two degradation products eluted after. During the implementation stages of the separation method, it was noticed that DABET's retention time varied slightly from one day to another and showed certain sensitivity to temperature. Thermostatisation of the column at 40 °C had allowed to effectively remedy this fluctuation, but this approach was not used to minimize risk of in situ degradation during analysis. Nevertheless, to control any co-elution risk and to be sure of the method capacity to highlight the main degradation products formed with each of the stress conditions, purity of DABET's peak and mass balance were systematically monitored. A component detection algorithm (CODA) was run and outcome showed that the main peak always contains the only signals pertaining to DABET. In addition, mass balance (%assay + %total degradation products) of all the stressed samples of DABET was obtained in the range of 98.7–99.8%, suggesting that for each condition tested, most of the degradation products formed have been detected (Tables 1 and 2).
| Stress condition | Time | Average assay of API (%) | Average total impurities (%, area normalisation) | Average mass balance (assay + total impurities%) | Commentaries |
|---|---|---|---|---|---|
| Base hydrolysis (0.1 mol L−1 NaOH) | 1 hour | 76.0 | 22.7 | 98.7 | Degradation accompanied by appearance of DP-1, dabigatran and DP-6 |
| Acid hydrolysis (0.1 mol L−1 HCl) | 24 hours | 75.1 | 24.4 | 99.5 | Degradation accompanied by appearance of DP-7, DP-8, DP-9 and DP-10 |
| Oxidation (3% H2O2) | 72 hours | 78.1 | 21.2 | 99.3 | Degradation accompanied by appearance of DP-3 |
| Thermal (80 °C) | 28 days | 91.8 | 8.0 | 99.8 | Degradation accompanied by appearance of DP-4 and DP-5 |
| Photolysis (UV light) | 45 hours | 88.6 | 10.3 | 98.9 | Degradation accompanied by appearance of DP-2 and DP-5 |
| DP Name and rrT | Origin of ions | Best possible elemental formula | Theoretical mass m/z | Accurate mass m/z | Error (ppm) |
|---|---|---|---|---|---|
| DP-1 (0.5) | Precursor ion | C25H23N6Na2O4+ | 517.15707 | 517.15679 | −0.54 |
| MS1 | C25H24N6O4+ | 473.19318 | 473.19285 | −0.70 | |
| MS2 (517→) | C22H15N4Na2O2+ | 445.13594 | 445.13535 | −1.33 | |
| MS2 (517→) | C18H16N4Na2O3˙+ | 382.10123 | 382.10101 | −0.58 | |
| MS2 (517→) | C17H15N4Na2O3+ | 369.09341 | 369.09322 | −0.51 | |
| MS3 (517 → 382→) | C17H13N4Na2O3+ | 367.07776 | 367.07721 | −1.50 | |
| MS3 (517 → 445→) | C16H15N4Na2O+ | 325.10358 | 325.10331 | −0.83 | |
| MS3 (517 → 445→) | C15H12N4Na2O+ | 310.08100 | 310.07978 | −3.93 | |
| MS3 (517 → 369→) | C14H11N4Na2O+ | 297.07228 | 297.07178 | −1.68 | |
| Dabigatran (0.58) | Precursor ion | C25H26N7O3+ | 472.20916 | 472.20771 | −3.07 |
| MS2 (472→) | C22H22N7O+ | 400.18803 | 400.18768 | −0.87 | |
| C17H16N5O+ | 306.13494 | 306.13483 | −0.36 | ||
| C17H13N4O+ | 289.10839 | 289.10829 | −0.35 | ||
| DP-2 (0.61) | Precursor ion | C20H21N4O4+ | 381.15573 | 381.15568 | −0.13 |
| MS2 (381→) | C18H15N4O3+ | 335.11387 | 335.11342 | −1.34 | |
| MS2 (381→) | C15H13N4O2+ | 281.10330 | 281.10295 | −1.25 | |
| MS2 (381→) | C10H7N2O2+ | 187.05020 | 187.04989 | −1.66 | |
| DP-3 (0.65) | Precursor ion | C27H30N7O3+ | 500.24046 | 500.23944 | −2.04 |
| MS2 (500→) | C27H27N6O3+ | 483.21392 | 483.21381 | −0.23 | |
| C22H22N7O+ | 400.18803 | 400.18788 | −0.37 | ||
| C20H21N4O3+ | 365.16082 | 365.16070 | −0.33 | ||
| C17H16N5O+ | 306.13494 | 306.13488 | −0.20 | ||
| C17H13N4O+ | 289.10839 | 289.10828 | −0.38 | ||
| DP-4 (0.67) | Precursor ion | C27H29N6O4+ | 501.22448 | 501.22358 | −1.80 |
| MS2 (501→) | C27H26N5O4+ | 484.19793 | 484.19765 | −0.58 | |
| C20H21N4O3+ | 365.16082 | 365.16081 | −0.03 | ||
| C17H17N4O3+ | 325.12952 | 325.12957 | 0.15 | ||
| C17H15N4O2+ | 307.11895 | 307.11914 | 0.62 | ||
| C17H13N4O+ | 289.10839 | 289.10825 | −0.48 | ||
| DP-5 (0.78) | Precursor ion | C21H25N4O5+ | 413.18195 | 413.18088 | −2.59 |
| MS2 (413→) | C21H23N4O4+ | 395.17138 | 395.17124 | −0.35 | |
| MS2 (413→) | C20H21N4O4+ | 381.15573 | 381.15560 | −0.34 | |
| MS3 (413 → 395→) | C20H20N4O4*+ | 380.14791 | 380.14791 | 0.00 | |
| MS3 (413 → 395→) | C20H19N4O4+ | 379.14008 | 379.14010 | 0.05 | |
| MS3 (413 → 395→) | C20H23N4O3+ | 367.17647 | 367.17642 | −0.14 | |
| MS3 (413 → 395→) | C20H19N4O3+ | 363.14152 | 363.14157 | 0.15 | |
| MS3 (413 → 395→) | C19H17N4O3+ | 349.12952 | 349.12945 | −0.20 | |
| MS3 (413 → 381→) | C18H15N4O3+ | 335.11387 | 335.11342 | −1.34 | |
| MS4 (413 → 395 → 349→) | C18H13N4O3+ | 333.09822 | 333.09724 | −2.94 | |
| MS4 (413 → 395 → 349→) | C18H13N4O2+ | 317.10330 | 317.10296 | −1.07 | |
| MS3 (413 → 395→) | C16H15N4O2+ | 295.11895 | 295.11801 | −3.19 | |
| MS3 (413 → 381→) | C15H13N4O2+ | 281.10330 | 281.10295 | −1.25 | |
| MS3 (413 → 395→) | C15H11N4O2+ | 279.08765 | 279.08727 | −1.36 | |
| MS4 (413 → 395 → 295→) | C15H15N4O+ | 267.12404 | 267.12350 | −2.02 | |
| MS3 (413 → 395→) | C15H11N4O+ | 263.09274 | 263.09241 | −1.25 | |
| MS2 (413→) | C11H11N2O3+ | 219.07642 | 219.07612 | −1.37 | |
| MS3 (413 → 219→) | C11H9N2O2+ | 201.06585 | 201.06583 | −0.10 | |
| MS3 (413 → 381→) | C10H7N2O2+ | 187.05020 | 187.05021 | 0.05 | |
| MS4 (413 → 395 → 295→) | C10H9N2O+ | 173.07094 | 173.07082 | −0.69 | |
| MS3 (413 → 219→) | C9H7N2O+ | 159.05529 | 159.05511 | −1.13 | |
| DP-6 (0.89) | Precursor ion | C29H31N6O6+ | 559.22996 | 559.22840 | −2.79 |
| MS2 (559→) | C28H27N6O5+ | 527.20374 | 527.20362 | −0.23 | |
| MS3 (559 → 527→) | C27H29N5O4+ | 484.19793 | 484.19778 | −0.31 | |
| MS3 (559 → 527→) | C20H21N4O3+ | 365.16082 | 365.16059 | −0.63 | |
| MS2 (559→) | C18H13N4O3+ | 333.09822 | 333.09829 | 0.22 | |
| MS2 (559→) | C18H16N3O3+ | 322.11862 | 322.11811 | −1.58 | |
| DP-7 (0.92) | Precursor ion | C32H38N7O5+ | 600.29289 | 600.29180 | −1.82 |
| MS2 (600→) | C26H24N7O4+ | 498.18843 | 498.18830 | −0.26 | |
| C25H23N6O3+ | 455.18262 | 455.18230 | −0.70 | ||
| C25H26N7O3+ | 472.20916 | 472.20920 | 0.08 | ||
| C18H17N4O3+ | 337.12952 | 337.12898 | −1.60 | ||
| C17H13N4O+ | 289.10839 | 289.10813 | −0.90 | ||
| DP-8 (0.96) | Precursor ion | C33H40N7O5+ | 614.30854 | 614.30705 | −2.43 |
| MS2 (614→) | C27H26N7O4+ | 512.20408 | 512.20351 | −1.11 | |
| C26H25N6O3+ | 469.19827 | 469.19782 | −0.96 | ||
| C24H28N5O3+ | 434.21867 | 434.21844 | −0.53 | ||
| C23H27N4O2+ | 391.21285 | 391.2126 | −0.64 | ||
| C18H14N5O2+ | 383.16149 | 383.16132 | −0.44 | ||
| C19H19N4O3+ | 351.14152 | 351.14131 | −0.59 | ||
| C18H14N5O2+ | 332.11420 | 332.11409 | −0.33 | ||
| C16H21N2O2+ | 273.15975 | 273.15954 | −0.77 | ||
| Dabigatran etexilate | API | C34H42N7O5+ | 628.32419 | 628.32236 | −2.91 |
| DP-9 (1.08) | Precursor ion | C33H39N6O6+ | 615.29256 | 615.29137 | −1.93 |
| MS2 (615→) | C27H25N605+ | 513.18809 | 513.1873 | −1.54 | |
| C26H24N5O4+ | 470.18228 | 470.18152 | −1.62 | ||
| C24H27N4O4+ | 435.20268 | 435.20226 | −0.97 | ||
| C23H26N3O3+ | 392.19687 | 392.19673 | −0.36 | ||
| C22H18N5O2+ | 384.145501 | 384.145102 | −1.04 | ||
| C19H19N4O3+ | 351.14517 | 351.14493 | −0.68 | ||
| C18H13N4O3+ | 333.09822 | 333.09811 | −0.33 | ||
| C16H21N2O2+ | 273.15975 | 273.15945 | −1.10 | ||
| DP-10 (1.10) | Precursor ion | C34H41N6O6+ | 629.30821 | 629.30712 | −1.73 |
| MS2 (629→) | C28H27N6O5+ | 527.20374 | 527.20298 | −1.44 | |
| C27H26N5O4+ | 484.19793 | 484.19669 | −2.56 | ||
| C24H27N4O4+ | 435.20268 | 435.20175 | −2.14 | ||
| C23H26N3O3+ | 392.19687 | 392.19598 | −2.27 | ||
| C20H21N4O3+ | 365.16082 | 365.16060 | −0.60 | ||
| C18H17N4O3+ | 337.12952 | 337.12891 | −1.81 | ||
| C18H13N4O3+ | 333.09822 | 333.0981 | −0.36 | ||
| C17H14N3O3+ | 308.10297 | 308.10292 | −0.16 | ||
| C16H21N2O2+ | 273.15975 | 273.15920 | −2.01 | ||
| C15H13N4O+ | 265.10839 | 265.10825 | −0.53 |
The hydrolytic conditions showed a strong impact on DABET's stability (Tables 1 and 2). In basic condition, after 1 hour of exposition to NaOH 0.1 mol L−1, 24% degradation has occurred, resulting in the formation of DP-1 (rrT = 0.52), dabigatran (rrT = 0.58) and DP-6 (rrT = 0.89). The acidic conditions yielded DP-7 (rrT = 0.92), DP-8 (rrT = 0.97), DP-9 (rrT = 1.08) and DP-10 (rrT = 1.10) after 24 hours of exposure to HCl 0.1 mol L−1, accounting for 25% DABET loss (Table 1).
To the other degradation conditions, degradation seems to be slower. After three days of exposure to H2O2 3%, DP-3 (rrT = 0.64) was formed along with 22% DABET loss. After 45 hours of exposure inside the light chamber, DP-2 (rrT = 0.63) and DP-5 (rrT = 0.78) appeared along with 11% DABET loss. After 28 days of exposure at 80 °C, DP-4 (rrT = 0.67) and DP-5 (rrT = 0.78) were produced and only 8% of DABET loss was observed (Tables 1 and 2).
Characterization of DABET'S fragmentation pattern
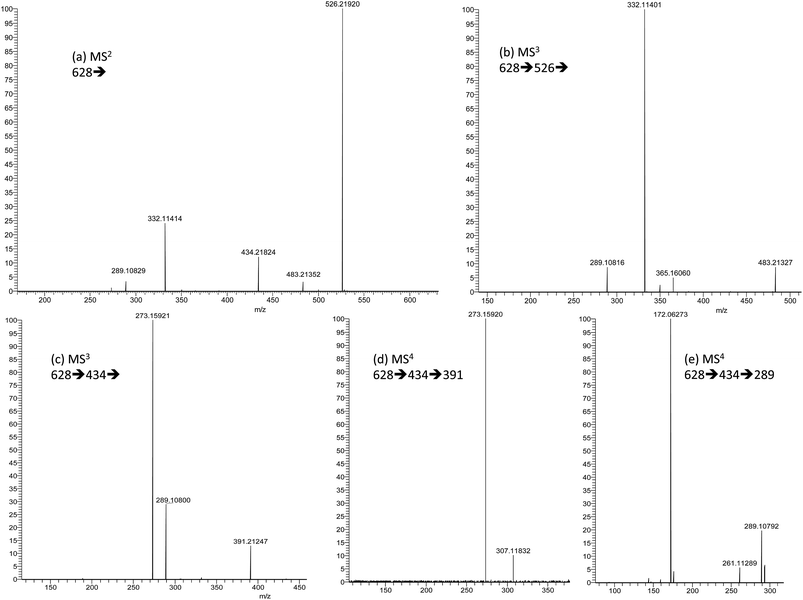
The fragmentation scheme of DABET, which has not been studied in detail so far, was determined using ESI+ high-resolution multi-stage mass spectrometry (ESI+/HR-MSn). The comprehension of various mechanisms that result, can, to a large extent, assist in the structural elucidation of the aforementioned degradation products. Hence, a study in depth of DABET's fragmentation pattern had been achieved in order to help assign, by comparison, the structures of the major product ions coming from the degradation products ions. The structures proposed for the product ions were systematically confirmed by the elemental compositions determined from accurate mass measurement and from the corresponding errors levels (systematically inferior to 4 ppm), as well as by logical or plausible losses. These data have been reported in Tables 2 and 3 and the proposed fragmentation pattern for the drug has been built based upon multi-stage HR-MS studies (Fig. 2 and 3). However, for the sake of visibility in terms of graphical representations, the mass-to-charge values linked to each of the structures presented in Fig. 3–8 have been written in the form of nominal values.| Product ions | Origin of fragments | Best possible elemental formulae | Theoretical mass m/z | Accurate mass m/z | Error (ppm) |
|---|---|---|---|---|---|
| 628 | (M + H)+ | C34H42N7O5+ | 628.32419 | 628.32236 | −2.91 |
| 526 | MS2 (628→) | C28H28N7O4+ | 526.21973 | 526.21920 | −1.01 |
| 483 | MS3 (628 → 526→) | C27H27N6O3+ | 483.21392 | 483.21327 | −1.35 |
| 434 | MS2 (628→) | C24H28N5O3+ | 434.21867 | 434.21824 | −0.99 |
| 391 | MS3 (628 → 434→) | C23H27N4O2+ | 391.21285 | 391.21247 | −0.97 |
| 365 | MS3 (628 → 526→) | C20H21N4O3+ | 365.16082 | 365.16060 | −0.60 |
| 337 | MS3 (628 → 526→) | C18H17N4O3+ | 337.12952 | 337.12891 | −1.81 |
| 332 | MS3 (628 → 526→) | C18H14N5O2+ | 332.11420 | 332.11401 | −0.57 |
| 307 | MS4 (628 → 434 → 391) | C17H15N4O2+ | 307.11895 | 307.11832 | −2.05 |
| 289 | MS2 (628→) | C17H13N4O+ | 289.10839 | 289.10829 | −0.35 |
| 273 | MS4 (628 → 434 → 391→) | C16H21N2O2+ | 273.15975 | 273.15920 | −2.01 |
| 265 | MS3 (628 → 526) | C15H13N4O+ | 265.10839 | 265.10825 | −0.53 |
| 261 | MS4 (628 → 434 → 289→) | C16H13N4+ | 261.11347 | 261.11289 | −2.22 |
| 172 | MS4 (628 → 434 → 289→) | C10H8N2O˙+ | 172.06311 | 172.06273 | −2.23 |
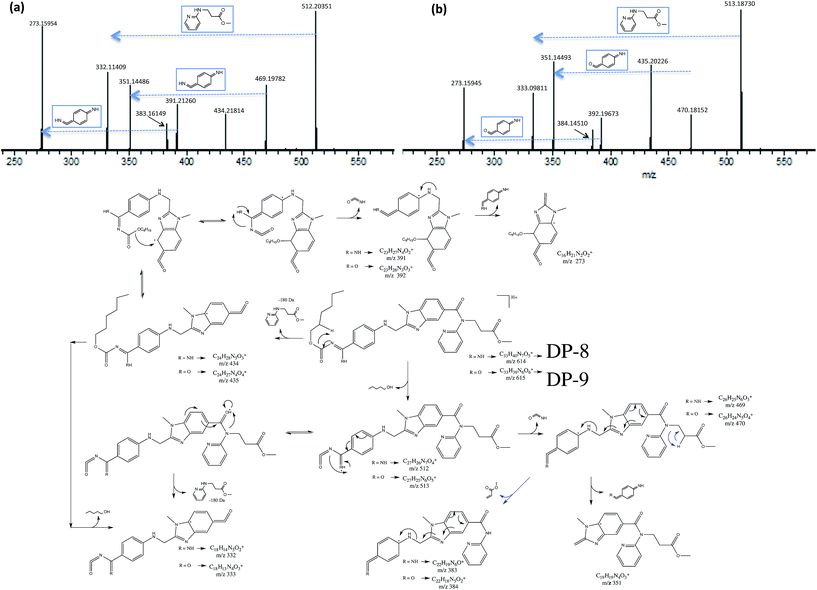
Analysed in positive ion mode, DABET was detected as protonated [M + H]+ ion (m/z 628) and sodium adduct [M + Na]+ ion (m/z 650). Its HR-MS2 spectrum yields 6 product ions with m/z of 526, 483, 434, 332, 289 and 273 (Table 3). However, as it will be demonstrated thereafter, the ions at m/z 483, 332, and 289 came from the ion at m/z 526, whereas m/z 273 ion turns out to be the fragmentation product of m/z 434 ion.
As shown in Fig. 3, the formation of m/z 526 ion (C28H28N7O4+) may be due to an elimination of hexan-1-ol from protonated DABET ion. However, considering the product ions formed from m/z 526 ion, it appears that the way that protonated DABET was fragmented would be closely dependent upon the protonation site of the molecule. Although there are several possibilities, the system formed from the protonation of the amine function would facilitate the elimination of hexan-1-ol (−102 Da) through a rearrangement process involving a six-member centre, leading to the formation of an intermediate amino-acylium ion with m/z of 526, as shown in Fig. 3. From there, an internal rearrangement involving migration of adjacent double bonds would take place so to obtain a stable carbocation. Taken in turn as precursor for HR-MS3 studies, m/z 526 ion could lose isocyanic acid to give m/z 483 (C27H27N6O3+) carbocation, whose configuration, such is proposed in Fig. 3, would allow the departure of a 118 Da moiety by heterolytic cleavage of the C–N bond along with formation of a π-bond between N and C. This neutral loss would correspond to the departure of 4-(iminomethylene) cyclohexa-2,5-dienimine or equivalent, generating m/z 365 ion (C20H21N4O3+). Thereafter, the fragmentations that would involve the ester and amide functions were highlighted by the detection of m/z 337 ion (C18H17N4O3+) and of m/z 265 ion (C15H13N4O+), formed by loss of ethylene and of ethyl acrylate, respectively. Parallel to this series of fragmentation, protonation of O-carbamimide would have facilitated the loss of ethyl 3-(pyridin-2-ylamino)propanoate (−194 Da), leading to the formation of m/z 332 ion (C18H14N5O2+). At MS4, m/z 332 ion would lose isocyanic acid to afford m/z 289 ion (C17H13N4O+). Taken in turn as precursor to go further in the fragmentation study, thereof could be transformed into m/z 261 ion (C16H13N4+) by loss of CO. The ion at m/z 289 could also give way to m/z 172 radical dystonic ion (C10H8N2O*+) by homolytic cleavage leading to the departure of radical 4-(iminomethylene)cyclohexa-2,5-dienimine (−117 Da).
Parallel to loss of hexan-1-ol, protonated DABET ion could undergo direct loss of ethyl 3-(pyridin-2-ylamino)propanoate to yield m/z 434 ion (C24H28N5O3+), according to a rearrangement process involving the proton carried by O-carbamimide (Table 3 and Fig. 3). Taken as a precursor for HR-MS3 studies, m/z 434 ion resulted in the formation of three intense product ions with m/z of 391, 289 and 273, while the hexane-1-ol loss seemed to be more difficult, given the very low intensity of the resulting ion, supposed to have a mass-to-charge of 332 (Fig. 2). However, the surprising element is tied to the direct elimination of isocyanic acid to generate m/z 391 ion (C23H27N4O2+), knowing that such a loss could logically occur only after elimination of hexan-1-ol. Therefore, the only plausible explanation has been to consider the prior migration of hexanolate towards another site of the structure, favoured by the configuration of the product ion. So the premise proposed here would be that the elimination of the 194 Da moiety would have resulted in rearrangements involving the successive migration of the adjacent double bonds, hence leading to a configuration where C9 had become electron-deficient. C9 would have then undergone nucleophile attack materialized by the transfer of hexan-1-ol to form an etheroxyde function, via a rearrangement mechanism implying a twelve-member centre, such was proposed in Fig. 3. This assumption was not meaningless insofar as the product ion at m/z 273 (C16H21N2O2+), resulting from the loss of 4-(iminomethylene)cyclohexa-2,5-dienimine group from m/z 391 ion, would still have conserved the hexan-1-ol moiety. Parallel to the path leading to m/z 273 ion, m/z 391 ion could also successively lose hex-1-ene and 4-(iminomethylene)cyclohexa-2,5-dienimine to generate m/z 307 ion (C17H15N4O2+) and m/z 189 ion (C10H9N2O2+), respectively.
Identification of the degradation products by LC-HR-MSn
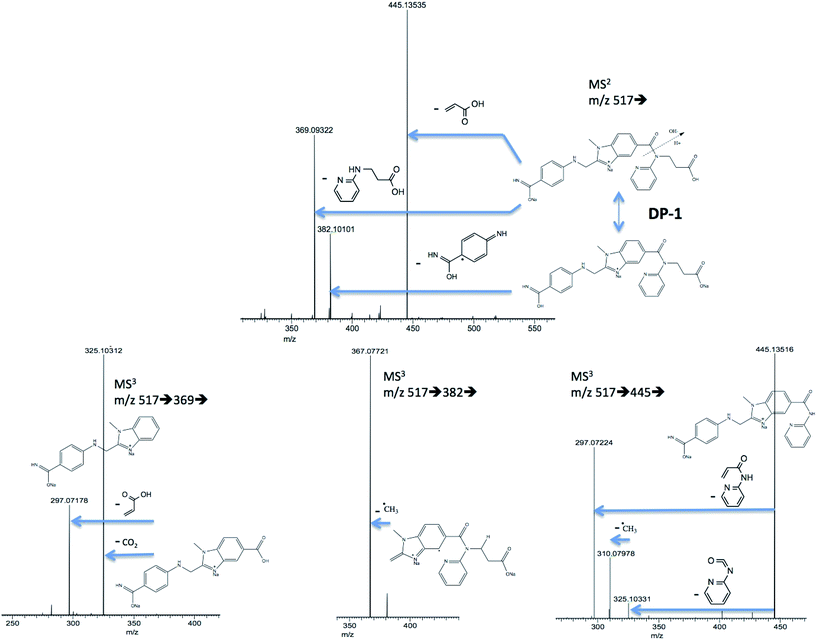
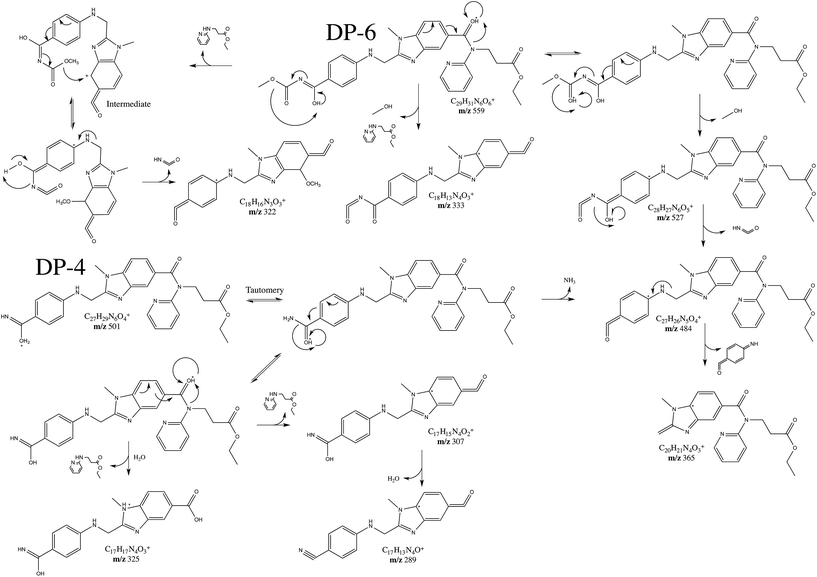
Apart from the fragmentation in m/z 445 ion, [DP1–H + 2Na]+ ion could also generated m/z 369 ion by loss 3-(pyridin-2-ylamino)propanoic acid (−166 Da). This seems to be due to hydrolysis of the amide bond, by involvement of a water molecule. Subjected to further stage of fragmentation, m/z 369 ion lost CO2 to yield m/z 325 ion and this helped confirm the previous assumption. Transition 517 → 382 means the possible loss of 4-iminocyclohexa-2,5-dienecarboxamide radical group by homolytic cleavage of the N–C bond. The next fragmentation stage leads to the formation of m/z 367 ion (C17H13N4Na2O3+), by possible loss of radical *CH3.
These data seem to be consistent with the structure of 3-(2-((4-(hydroxy(imino)methyl)phenylamino)methyl)-1-methyl-N-(pyridin-2-yl)-1H-benzo[d]imidazole-5-carboxamido)propanoic acid.
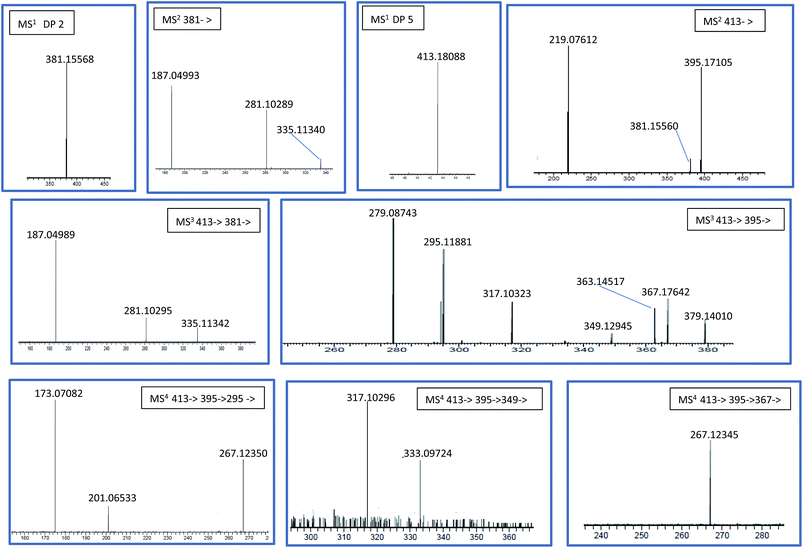
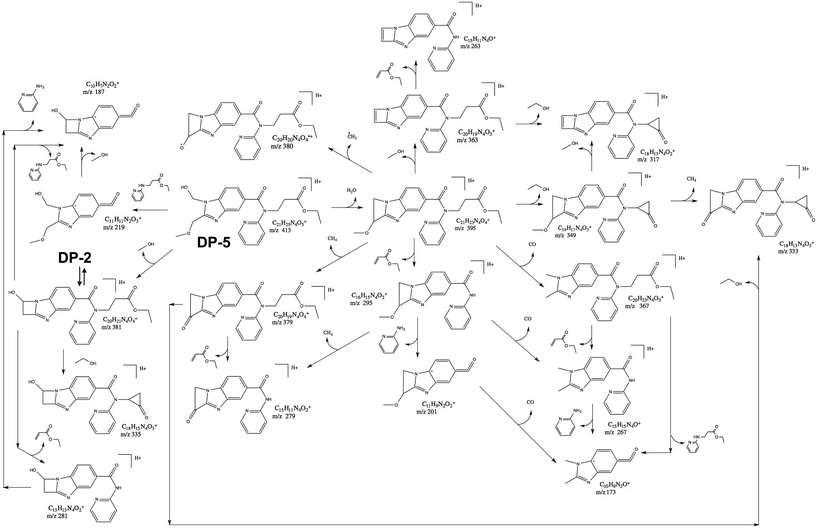
The ions that were produced either by dehydration (m/z 395) or by loss of methanol (m/z 381) have been fragmented (Table 2 and Fig. 5). But the usual losses related to the departure of isocyanic acid (−43 Da) or of 4-(iminomethylene)cyclohexa-2,5-dienimine (−118 Da) have not been detected, which informs about the nature of the changes that would have taken place in the structure. As a result, products such as ethyl 3-(1-(hydroxymethyl)-2-(methoxymethyl)-N-(pyridin-2-yl)-1H-benzo[d]imidazole-5-carboxamido)propanoate or ethyl 3-(2-(hydroxymethyl)-1-(methoxymethyl)-N-(pyridin-2-yl)-1H-benzo[d]imidazole-5-carboxamido)propanoate, seem to be able to respond to these fragmentation data. To provide more evidence for the hypothesis, we have chosen to use the first derivative as pattern, knowing that it could just as well function with the other configuration. The ion at m/z 395 could successively lose methane and ethyl acrylate, to give m/z 379 and m/z 279 ions (Table 2 and Fig. 5 and 6). It could also be directly fragmented in m/z 295 ion, by elimination of ethyl acrylate. Thence, parallel to loss of methane to yield the ion at m/z 279, departures of CO (transition 295 → 267) and of pyridin-2-amine (transition 295 → 201), were also highlighted. Then reciprocally, loss of CO coming from m/z 201 ion or of pyridin-2-amine from m/z 267 ion, would have allowed the formation of m/z 173 ion (Fig. 6). In all likelihood, when m/z 295 ion was present under another configuration dictated by the protonation site, instead of losing CO, loss of methanol may rather occur to afford m/z 263 ion (Fig. 6).
Aside from the ions at m/z 395 and 219, another MS2 product ion of protonated DP-5, with m/z of 381, was also detected. It would stem from the methanol loss. The losses resulting from MS3 seem to perfectly match with the data of the MS2 spectrum obtained after analysis of protonated DP-2 (Table 2 and Fig. 6). As a result, DP-2 may correspond to ethyl 3-(N-(pyridin-2-yl)-1,3-dihydrobenzo[d]oxazolo[3,4-a]imidazole-6-carboxamido)propanoate, an intermediate product of the degradation route having led to the formation of DP-5 such is presented in the next chapter.
Although every of the elements presented above seemed to converge to the structures' hypothesis proposed for DP-2 and DP-5, analysis by 1H-MNR and 13C-MNR should be complementarily performed for confirmation.
Taken together, these data have allowed proposing the derivative 4-((5-((3-ethoxy-3-oxopropyl)(pyridin-2-yl)carbamoyl)-1-methyl-1H-benzo[d]imidazol-2-yl)methylamino)-N-(methoxycarbonyl)benzimidic acid as may correspond to DP-6.
Proposed degradation pathways of dapixaban etexilate
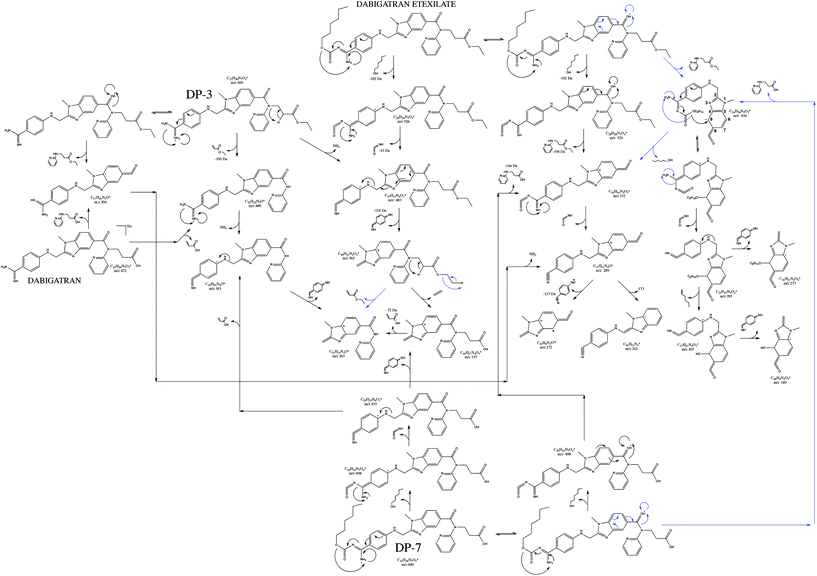
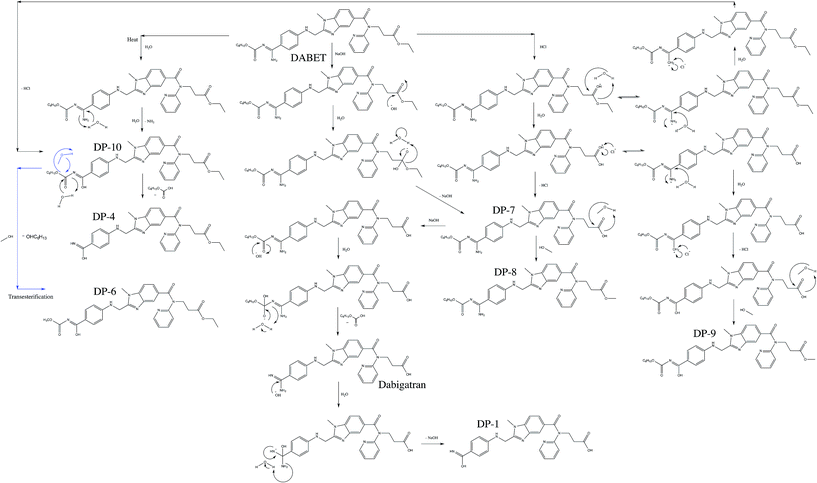
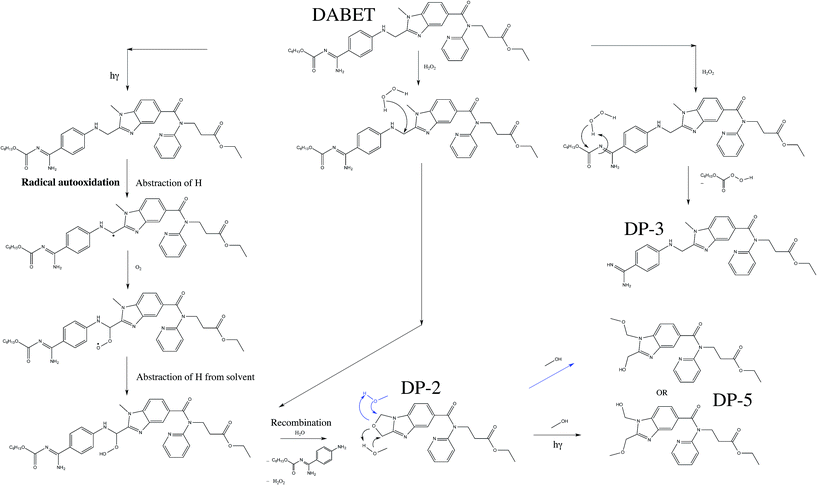
Under influence of various stress conditions, DABET was degraded as per several degradation routes producing ten major degradation products in addition to dabigatran (Tables 1 and 2). Thereof turns out to be the compound, whose DABET is the pro-drug. The ten unknowns have been successfully characterized by use of multistage high-resolution mass spectrometry. On the whole, DABET was shown susceptible to hydrolysis, involving the ester function as well as the carbamimido group. O-Dealkylation may occur and formation of benzimidic acid derivatives was also observed. The schematic representations of mechanism of formation of the degradation products under hydrolytic stress (DP-1, DP-4, DP-6, DP-7, DP-8, DP-9 and DP-10) are shown in Fig. 9.Over the other tested conditions, degradations by photo-catalysis and that in the presence of H2O2 were less significant. Nevertheless, DP-2, DP-3 and DP-5 were still produced, along the degradation pathways proposed in Fig. 10. In solution, photo-catalytic conditions may put into play a certain number of reactions that would be radical initiated. A number of reactions that followed this initiation stage may be rather of molecular nature, involving nucleophile attacks. Reaching a certain excited state, DABET could undergo auto-oxidation by radical initiation, which resulted in the abstraction of a proton from the α-carbon linked to the arylamine-nitrogen.20,21 The radical reaction was prolonged by reaction with O2 to generate peroxide radical and then peroxide, by abstraction of a proton from solvent. From there, intermediate etheroxide DP-2 would have been formed by recombination mechanisms in the presence of water, such as stipulated in Fig. 10. A photo-catalytic methanolysis reaction has been proposed to explain the formation of DP-5. DP-2 was also found in oxidative condition in the presence of hydrogen peroxide, likely due to attack on the α-carbon linked to the arylamine-nitrogen, as shown in Fig. 10.
Conclusion
The degradation behaviour of DABET under hydrolytic (acid, base), oxidative, photolytic and thermal stress conditions was studied. Its MSn fragmentation scheme was studied in depth in order to help assign, by comparison, the structures of the product ions formed from the degradation products. A total of ten degradation products were formed under stress conditions and characterized. Under hydrolytic stress conditions, O-dealkylation may occur and formation of benzimidic acid derivatives was also observed. DABET was shown much less susceptible to photolysis and oxidative stress, even if N-dealkylation was highlighted through the identification of the degradation products. Based on identification, it was possible to deduct major degradation mechanisms in the context of stress testing.References
- C. T. January, L. S. Wann, J. S. Alpert, H. Calkins, J. E. Cigarroa, J. C. Cleveland, J. B. Conti, P. T. Ellinor, M. D. Ezekowitz, M. E. Field, K. T. Murray, R. L. Sacco, W. G. Stevenson, P. J. Tchou, C. M. Tracy and C. W. Yancy, J. Am. Coll. Cardiol., 2014, 64, 2246 CrossRef PubMed.
- J. W. M. Cheng and H. Vu, Clin. Ther., 2012, 34, 766 CrossRef CAS PubMed.
- C. S. Miller, S. M. Grandi, A. Shimony, K. B. Filion and M. J. Eisenberg, Am. J. Cardiol., 2012, 110, 453 CrossRef CAS PubMed.
- M. Ganetsky, K. M. Babu, S. D. Salhanick, R. S. Brown and E. W. Boyer, J. Med. Toxicol., 2011, 7, 281 CrossRef CAS PubMed.
- S. W. Baertschi, K. M. Alsante and R. A. Reed, in Pharmaceutical stress testing: predicting drug degradation, Informa Healthcare, New York, 2nd edn, 2011, ch. 2, pp. 10–49 Search PubMed.
- ICH Q1A(R2), International Conference on Harmonization, IFPMA, Geneva, 2003 Search PubMed.
- S. Singh, T. Handa, M. Narayanam, A. Sahu, M. Junwal and R. P. Shah, J. Pharm. Biomed. Anal., 2012, 69, 148 CrossRef CAS PubMed.
- D. Jain and P. K. Basniwal, J. Pharm. Biomed. Anal., 2013, 86, 11 CrossRef CAS PubMed.
- E. Nägele and R. Moritz, J. Am. Soc. Mass Spectrom., 2005, 16, 1670 CrossRef PubMed.
- H. Sadou Yaye, P. H. Secrétan, T. Henriet, M. Bernard, F. Amrani, W. Akrout, P. Tilleul, N. Yagoubi and B. Do, J. Pharm. Biomed. Anal., 2015, 105, 74 CrossRef PubMed.
- I. Gana, A. Dugay, T. Henriet, I. B. Rietveld, M. Bernard, C. Guechot, J.-M. Teulon, F. Safta, N. Yagoubi, R. Céolin and B. Do, J. Pharm. Biomed. Anal., 2014, 96, 58 CrossRef CAS PubMed.
- R. P. Shah, V. Kumar and S. Singh, Rapid Commun. Mass Spectrom., 2008, 22, 613 CrossRef CAS PubMed.
- J. Li, J. Fang, F. Zhong, W. Li, Y. Tang, Y. Xu, S. Mao and G. Fan, J. Chromatogr. B: Anal. Technol. Biomed. Life Sci., 2014, 973, 110 CrossRef CAS PubMed.
- J. P. Antovic, M. Skeppholm, J. Eintrei, E. E. Boija, L. Söderblom, E.-M. Norberg, L. Onelöv, Y. Rönquist-Nii, A. Pohanka, O. Beck, P. Hjemdahl and R. E. Malmström, Eur. J. Clin. Pharmacol., 2013, 69, 1875 CrossRef CAS PubMed.
- M. Korostelev, K. Bihan, L. Ferreol, N. Tissot, J.-S. Hulot, C. Funck-Brentano and N. Zahr, J. Pharm. Biomed. Anal., 2014, 100, 230 CrossRef CAS PubMed.
- X. Delavenne, J. Moracchini, S. Laporte, P. Mismetti and T. Basset, J. Pharm. Biomed. Anal., 2012, 58, 152 CrossRef CAS PubMed.
- Y.-Y. Zheng, C.-W. Shen, M.-Y. Zhu, Y.-M. Zhou and J.-Q. Li, Org. Process Res. Dev., 2014, 18, 744 CrossRef CAS.
- Z.-Y. Hu, R. B. Parker, V. L. Herring and S. C. Laizure, Anal. Bioanal. Chem., 2013, 405, 1695 CrossRef CAS PubMed.
- M. Blessy, R. D. Patel, P. N. Prajapati and Y. K. Agrawal, J. Pharm. Anal., 2014, 4, 165 Search PubMed.
- G. A. Russe, J. Am. Chem. Soc., 1957, 79, 3871 CrossRef.
- F. Minisci and F. Fontana, La Chimica e l'Industria, 1998, 80, pp. 1309 Search PubMed.
Footnote |
| † The first 2 authors contributed equally to this study and are therefore considered as first authors. |
| This journal is © The Royal Society of Chemistry 2015 |

