Graphene-decorated graphite–sulfur composite as a high-tap-density electrode for Li–S batteries

Ganguli Babu and Leela Mohana Reddy Arava*
Department of Mechanical Engineering, Wayne State University, Detroit, MI 48202, USA. E-mail: leela.arava@wayne.edu; Fax: +1-313-577-8789; Tel: +1-313-577-1986

Received 7th March 2015 , Accepted 15th May 2015

First published on 15th May 2015


Abstract

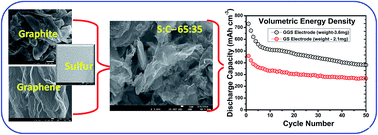
Establishing the efficient electronic conductivity of a sulfur cathode without compromising the volumetric energy density and confining dissolved polysulfides within the cathode of the cell are first-order research priorities in the area of Li–S batteries. The emerging nanotechnology-based approaches, especially the use of porous nanocarbon in the formation of the sulfur electrode, stand to negatively affect the volumetric energy due to the low tap-density of C–S cathodes. In order to address these issues, we study the effects of the porosity and density of different carbons such as graphite, graphene and graphite–graphene hybrids on the overall volumetric capacity of the electrode. Although graphene–sulfur (GS) and graphene-decorated graphite–sulfur (GGS) electrodes show similar gravimetric capacities (~1050 mA h g−1), the GGS electrode exhibits a high volumetric capacity (745 mA h cm−3) without compromising the electrochemical stability over 50 cycles. Furthermore, an excellent cycle stability of the GGS electrode over 100 cycles is achieved by coating a thin layer of poly(methyl methacrylate) (PMMA) on the GGS electrode. Maintaining a high tap-density along with porosity is key in achieving high volumetric capacity in C–S cathodes.

1. Introduction

Lithium–sulfur (Li–S) chemistries are amongst the most promising next-generation battery technologies due to the abundance, low-cost, and nontoxic nature of sulfur cathodes and their high theoretical energy density of 2500 W h kg−1. Despite their promise, Li–S batteries have complications such as low sulfur utilization, poor power density and low cycle life. This is mainly because of two key factors: (i) the low active material utilization due to the insulating nature of sulfur (the electrical conductivity of sulfur is 5 × 10⁻³⁰ Scm−1) and its discharge products; and (ii) the dissolution of intermediate lithium polysulfides (LiPS) in the electrolyte and deposition on the Li anode during the ‘polysulfide-shuttle process’. The insulating nature of sulfur and its final discharge products necessitate contact with substantial fractions of conductors to retain high power density.1,2 Although it minimizes the conductivity issue, the traditional strategy of using porous carbonaceous materials as hosts for sulfur fails to retain the overall energy density (volumetric) and control the polysulfide-shuttle process.3

The volumetric energy density of an Li–S battery depends on the amount of sulfur and the tap-density of the entire electrode.3,4 The low density of sulfur (2.07 g cm−3) compared to conventional Li-ion battery cathode materials such as transition metal oxides (∼4.5 g cm−3) and phosphates (3.6 g cm−3) results in the low volumetric energy density of Li–S batteries.3 This volumetric energy density is further lowered after adding porous carbon additives to tackle the conductivity issues of the sulfur cathode. Most recent reports on formulating C–S cathodes use 40–65% carbon,2,5–16 while traditional battery materials require additive contents of less than 20 wt%.17,18 Recent research efforts to integrate several carbon nanostructures to formulate efficient C–S cathodes have resulted in further lowering their tap-density. In this regard, developing high-tap-density electrodes without compromising the porosity of the carbon (to host more sulfur and to maintain good electrical conductivity) has gained importance.19–21

Apart from the low conductivity and tap-density concerns of C–S electrodes, another critical issue plaguing Li–S batteries is the polysulfide-shuttle process.22,23 The weak interaction between dissolved polysulfides and sulfiphobic carbon-containing cathodes fails to prevent the migration of dissolved polysulfides into the electrolyte and their subsequent deposition on the Li anode.24 Prior research attempts to confine polysulfides within the cathode of the cell include: (i) chemically attaching oxygen-containing functional groups to carbon surfaces;25–28 (ii) utilizing metal oxides such as SiO2,29,30 TiO2 30,31 and Al2O3 32 as additives to adsorb polysulfides; (iii) using metal–organic frameworks to entrap polysulfides;33,34 and (iv) preserving dissolved polysulfides at the cathode using polymer coatings.35,36 Among these approaches, we envisage coating the surface of the C–S cathode with a thin layer of polymer as an effective method due to the fact that it does not alter the underlying electrode. Herein, we demonstrate a step-by-step approach to formulate high-tap-density C–S electrodes by first developing a graphene-decorated graphite–sulfur (GGS) composite with a low fraction of graphene additive and then coating it with a polymer layer to control the polysulfide-shuttle process.

2. Experimental section

2.1 Preparation of electrode materials

The graphene–sulfur (GS) composite (30[thin space (1/6-em)]:[thin space (1/6-em)]70 wt/wt) was prepared by mixing few-layer graphene (Angstrong Materials) and sulfur (Sigma-Aldrich) in carbon disulfide (CS2, Alfa Aesar). The solvent was then evaporated slowly by stirring and heating at 50 °C. The resultant GS composite was further sintered at 155 °C for 12 h under N2 atmosphere to impregnate sulfur into the graphene layers.

The GGS composite electrode was prepared in a two-step process. The first step involved the mixing of graphite and sulfur (25[thin space (1/6-em)]:[thin space (1/6-em)]70 wt/wt) with carbon disulfide followed by sintering, similar to the method described for the preparation of GS. The resultant composite was then mixed with 5 wt% few-layer graphene and further subjected to sintering at 155 °C in N2 atmosphere.

To coat a thin layer of polymer, 2 wt% poly(methyl methacrylate) (PMMA) was dissolved in N-methyl pyrrolidone (NMP) with stirring at 50 °C, and 20 μl of the resultant solution was cast on the GGS electrode (coated in Al foil) using a spin coater.

2.2 Electrode preparation and cell fabrication

CR2032 coin cells were fabricated to evaluate the electrochemical performance of the GS, graphite–sulfur, GGS, and polymer-coated GGS composites. Electrodes were prepared using a coating slurry consisting of 85 wt% active material (GS or graphite–sulfur or GGS or PMMA/GGS), 5 wt% conductive carbon and 10 wt% poly vinylidene fluoride (PVdF) binder with N-methyl pyrrolidone (NMP) as the solvent on Al foil. The coin cell fabrication was carried out in an argon-filled glove box using the prepared composites as the cathodes, metallic lithium foil as the anode, 1 M lithium bis(trifluoromethanesulfonyl)imide (LiTFSI) in tetraethylene glycol dimethyl ether (TEGDME) as the electrolyte and Celgard as the separator.

2.3 Physical and electrochemical characterizations

The morphologies of the raw materials and composites were characterized by field-emission electron microscopy (FESEM; JEOL JSM-7500F). X-ray diffraction (XRD) patterns were recorded on a Bruker D8 Advance diffractometer at 40.0 kV with Cu-Kα radiation. Thermogravimetric analysis (TGA) was carried out on the samples using a TGA/DSC1 STARe system under N2 atmosphere. Pore structure and surface area analyses were performed on a Quantachrome Autosorb Automated Gas Sorption System. Cyclic voltammograms (CVs) were recorded in the potential range of 1.5–3.0 V at a scan rate of 0.2 mV s−1. Electrochemical impedance (EIS) tests were performed on a GAMRY electrochemical work station. Galvanostatic charge–discharge studies were carried out at different current rates (0.1, 0.2 and 0.5 C-rate) in the potential range of 1.5–3.0 V using an ARBIN battery cycler system.

3. Results and discussion

In order to understand the influence of using a low-density graphene matrix on C–S electrode tap-density, we kept the sulfur loading constant in all GS, GGS and graphite–sulfur (controlled sample) electrodes. Fig. 1 depicts a typical FESEM image and TG curve of GS composite sintered at 155 °C for 2 h under inert (Ar) atmosphere. The FESEM image (Fig. 1a) reveals the absence of bulk sulfur and the retaining of a rigid few-layer graphene framework, even after a sulfur loading of 65 wt%, as derived from the weight loss that occurs from 180–240 °C in the TG curve (Fig. 1b). The weight loss observed at around 180 °C in the TG plot is an indication of sulfur evaporation. Similarly, Fig. 2a and c are the FESEM image and elemental mapping of individual elements of the GGS electrode, respectively, clearly showing the uniform distribution of sulfur on the porous graphene–graphite surface. From the EDS analysis shown in Fig. 2b, the composition of S and C and the absence of any other impurities are confirmed. The sulfur content in the GGS composite is about 65 wt%, which is the same as that of the GS composite. The morphologies of pristine graphite and few-layer graphene (before sulfur loading) are shown in Fig. S1.
image file: c5ra04095g-f1.tif
Fig. 1 (a) FESEM image and (b) thermogravimetric analysis curve showing the morphology and the amount of sulfur in a low-tap-density graphene–sulfur composite electrode for Li–S batteries.

image file: c5ra04095g-f2.tif
Fig. 2 (a) FESEM image and (b) and (c) EDX results of the graphene-decorated graphite–sulfur composite electrode. The inset of (b) shows the thermal analysis of the GGS composite sintered at 155 °C for 2 h.

In addition to keeping the S loading constant, we kept the electrode preparation parameters such as amount of binder (10 wt%) and carbon additives (5 wt%), electrode thickness (30 μm), drying temperature (80 °C) and drying time (24 h) constant for both GGS and GS electrodes. Although the sulfur loadings on both GS and GGS active materials are the same, the electrodes fabricated on Al current collectors (fixed thickness) exhibited different active material loadings due to their difference in density. The measured tap-density values are 0.72 and 1.09 g cm−3 for the GS and GGS composites with 65% sulfur loading, respectively. For a given thickness, the GS and GGS electrodes have areal densities of 2.1 mg cm−2 and 3.6 mg cm−2 of active material, respectively. The pore structures and surface areas of the composites were studied using nitrogen sorption measurements. All isotherms exhibit type IV characteristics with hysteresis indicating the formation of mesoporous structures (Fig. S2). Bare graphene (G) exhibits a BET surface area of 643.2 m2 g−1, whereas the graphene-decorated graphite (GG) composite exhibits a reduced surface area of 300.8 m2 g−1. Upon sulfur impregnation, the surface area decreases drastically to 213.2 and 46.3 m2 g−1 for the G and GG materials, respectively. The Dubinin-Astakhov (DA) method is used to analyze the pore structure based on N2 adsorption (Fig. S3). The observed pore diameter for graphene is 12 to 30 nm with a narrow distribution compared to that of the graphene–graphite composite (12–45 nm).

The electrochemical performances of these two electrodes were studied along with that of the graphene-free graphite–sulfur composite (controlled sample) by conducting charge–discharge measurements at a constant current rate of 0.1 C in the potential range of 1.5–3.0 V. Although the graphene-free graphite–sulfur composite exhibits superior tap density (1.19 g cm−3) compared to the GS and GGS electrodes, it suffers from significant capacity fade upon charge–discharge cycling due to the polysulfide-shuttle process (Fig. S4). Hence, a small quantity of graphene (5 wt%) is expected to improve the capacity retention behavior as graphene layers can control polysulfide dissolution from the cathode matrix. Fig. 3a shows the specific discharge capacity (calculated based on electrode mass) vs., cycle number plots for both GS and GGS electrodes; as expected, both electrodes delivered almost the same capacity values (mA h g−1) at the initial and 50th cycle (1050 and 495 mA h g−1, respectively) due to constant sulfur loading (per gram of composite). Fig. 3b shows the comparative volumetric capacity (calculated based on electrode thickness and area) vs. cycle number plots of the same GS and GGS electrodes.


image file: c5ra04095g-f3.tif
Fig. 3 Comparison of electrochemical performance between the high tap-density (GGS) and low tap-density (GS) electrodes in terms of (a) gravimetric capacity (mA h g−1) vs. cycle number and (b) volumetric capacity (mA h cm−3) vs. cycle number. (c) and (d) Their respective charge–discharge profiles at a rate of 0.1 C in the potential range of 1.5–3.0 V.

Interestingly, a significant difference (almost 40%) was observed between their volumetric capacities in spite of their equal gravimetric capacities. The corresponding charge–discharge profiles are shown in Fig. 3c and d. Both composites exhibit similar charge–discharge profiles with two-voltage plateaus upon discharge: the first is at 2.42 V, and the predominant second plateau at 2.0 V corresponds to the conversion of elemental sulfur long-chain lithium polysulfides (Li2Sn, n ≥ 6) and their disproportion into short-chain lithium polysulfides (Li2Sn n ≤ 2). Thus, the use of tailored low-density/high-density carbon structures in the preparation of sulfur cathodes plays a significant role in determining the volumetric energy density of the battery.


image file: c5ra04095g-f4.tif
Fig. 4 Cyclic voltammograms of pristine and polymer-coated high-density sulfur composite electrodes in the potential window of 1.5–3.0 V at a scan rate of 0.2 mV s−1.

However, capacity fade upon cycling was observed in both GS and GGS electrode-based cells. As reported recently by L. F. Nazar et al.,24 carbon materials in general have poor adsorption towards polar polysulfides, resulting in the polysulfide-shuttle process. In turn, the polysulfide-shuttle process leads to capacity fade due to deposition of dissolved polysulfides on the Li anode. As a result, confining polysulfides within the cathode of the Li–S cell is mandatory. To address the same issue in GGS electrodes, we coated a thin layer of PMMA on the surface of the electrode to confine the dissolved polysulfide and retain the cyclic stability.37,38

In order to investigate the influence of the polymer coating on the electrochemical behavior of the prepared high-tap-density GGS composite, cells containing PMMA-coated GGS as the cathode and lithium as the anode were subjected to electrochemical studies including cyclic voltammetry, electrochemical impedance, charge–discharge cycling and rate capability. CVs were recorded at room temperature at a scan rate of 0.2 mV s−1 between a potential range of 1.5 and 3.0 V (Fig. 4). The CV patterns of the pristine and polymer-coated GGS composite cathodes show well-refined anodic peaks at 2.45 and two cathodic peaks at 2.4 and 1.9 V corresponding to the lithium polysulfide conversion reactions. Decay in peak currents for pristine cathode upon cycling attributed to capacity fade compared to that of the polymer-coated cathode. Fig. 5a displays the SEM image of the polymer-coated GGS electrode. The thin transparent layer coated on the GGS electrode is expected to confine dissolved polysulfides during the charge–discharge process. The electrochemical impedance spectra for the uncoated (Fig. S5) and polymer-coated (Fig. 5b) GGS electrodes were recorded in the frequency range of 100 kHz to 100 mHz. The typical Nyquist plots (electrochemical impedance results) constructed after the 1st, 5th and 10th cyclic voltammetry cycles include a semicircle at high frequencies attributed to the charge transfer resistance. The unfinished semicircle with a short inclined line in the low frequency region of the GGS electrode is attributed to the polymer coating and diffusion within the cathode. After 10 cycles, the electrolyte resistance slightly increases due to the gellification of the coated polymer with electrolyte,39 which results in a change in the electrolyte viscosity. On the other hand, the decrease in the charge transfer resistance in the GGS electrode after the first few cycles is attributed to improved Li-ion kinetics in the electrolyte.


image file: c5ra04095g-f5.tif
Fig. 5 (a) FESEM image of PMMA coated on a GGS electrode, (b) electrochemical impedance spectra of the polymer-coated electrode before and after CV scans in the potential range of 1.5–3.0 V at a scan rate of 0.2 mV s−1, (c) representative charge–discharge profiles and (d) cycling behavior with coulombic efficiency of the high-density GGS electrode coated with polymer at a rate of 0.1 C.

The charge–discharge voltage profiles of the polymer-coated GGS cathode upon cycling at a constant current rate of 0.1 C are shown in Fig. 5c. Similar to the CV curves, the voltage profiles show two discharge plateaus related to the formation of long-chain polysulfides (Li2Sx, 6 ≤ x ≥ 8) at 2.4 V, and the simultaneous disproportion to short-chain polysulfides at 2.0 V is observed. At the first few cycles of discharge, there is small plateau around 1.7 V that corresponds to the formation of the insoluble product Li2S, which is correlated to the significant capacity fade in the first few cycles. After several cycles, the voltage plateaus at 2.4 and 2.0 V are retained, even at the 50th and 100th cycles, which confirms the suitability of the polymer-coated electrode for long periods of cycling. Fig. 5d shows the cycling behavior of the GGS and polymer-coated GGS cathodes for 100 cycles at a rate of 0.1 C; the polymer-coated GGS electrode exhibits an excellent columbic efficiency of ∼99%. The polymer-coated GGS composite cathode shows capacity loss during the first few cycles; this behavior is not unusual as the conversion of lower polysulfides to higher polysulfides is not completely reversible. However, from cycles 30 to 100, capacity fade is almost negligible due to the polymer coating, which effectively prevents the dissolved polysulfide from reaching the Li anode side and causing parasitic reactions. At the end of the 100th cycle, the polymer-coated GGS composite electrode delivers a capacity of 416 mA h cm−3 with an improved capacity retention compared to the uncoated composite electrode (265 mA h cm−3). Thus, the polymer coating on the GGS electrode further helps to confine dissolved polysulfides within the cathode and hence improve the overall electrochemical properties of the Li–S cell.

The composites have been studied at different charge–discharge rates to understand the rate capability behavior of GGS electrodes with and without polymer coatings. Fig. 6 shows the capacity vs. cycle number plots at rates of 0.1, 0.2 and 0.5 C in the potential window of 1.5–3.0 V. At a rate of 0.5 C, the polymer-coated electrode exhibits a stable capacity of 400 mA h g−1, whereas the uncoated electrode displays a much reduced capacity of 200 mA h g−1. Similarly, the superior capacity retention of the polymer-coated electrode after high-rate charge–discharge cycles at 0.2 and 0.5 C is demonstrated by Fig. 6a and b. Thus, the comparative study of rate capability (Fig. 6c) shows that the polymer-coated electrode is efficient in controlling the polysulfide shuttle process by confining polysulfides in the cathode side of the cell.


image file: c5ra04095g-f6.tif
Fig. 6 Electrochemical behavior of (a) the bare GGS composite cathode and (b) the PMMA-coated GGS composite cathode at different current rates. (c) The cumulative comparison of those capacity values.

4. Conclusion

Carbon–sulfur composite electrodes with different porous carbons have been prepared to understand the effects of porosity and tap-density of the electrodes on the overall volumetric capacities of Li–S batteries. By keeping all electrode processing parameters constant, it is found that all the electrodes exhibit same gravimetric capacity for a given sulfur loading with these carbons. However, a significant difference has been observed in-terms of volumetric capacity due to their tap-densities. It is observed that the addition of 5% graphene to the high-tap-density graphite–sulfur electrode provides sufficient electrode conductivity without compromising the electrochemical performance. Hence, it is important to consider the tap-density of the electrodes, especially when considering the volumetric capacity of the Li–S system. As there is always a trade-off between porosity and tap-density, it is vital to design a conductive matrix that maintains high tap-density along with high porosity.

Acknowledgements

The authors acknowledge the financial support from the U.S. Army Research Laboratory (under NSF I/UCRC Centre for e-Design program) and Wayne State University.

References

  1. X. Ji, K. T. Lee and L. F. Nazar, Nat. Mater., 2009, 8, 500–506 CrossRef CAS PubMed .
  2. D. Wang, Y. Yu, W. Zhou, H. Chen, F. J. DiSalvo, D. A. Muller and H. D. Abruna, Phys. Chem. Chem. Phys., 2013, 15, 9051–9057 RSC .
  3. Y. Yang, G. Zheng and Y. Cui, Chem. Soc. Rev., 2013, 42, 3018–3032 RSC .
  4. T. Xu, J. Song, M. L. Gordin, H. Sohn, Z. Yu, S. Chen and D. Wang, ACS Appl. Mater. Interfaces, 2013, 5, 11355–11362 CAS .
  5. Z. Deng, Z. Zhang, Y. Lai, J. Liu, Y. Liu and J. Li, Solid State Ionics, 2013, 238, 44–49 CrossRef CAS PubMed .
  6. B. Zhang, X. Qin, G. R. Li and X. P. Gao, Energy Environ. Sci., 2010, 3, 1531–1537 CAS .
  7. S. Xin, Y.-X. Yin, L.-J. Wan and Y.-G. Guo, Part. Part. Syst. Charact., 2013, 30, 321–325 CrossRef CAS PubMed .
  8. B. Guo, T. Ben, Z. Bi, G. M. Veith, X. G. Sun, S. Qiu and S. Dai, Chem. Commun., 2013, 49, 4905–4907 RSC .
  9. X. Zhou, J. Xie, J. Yang, Y. Zou, J. Tang, S. Wang, L. Ma and Q. Liao, J. Power Sources, 2013, 243, 993–1000 CrossRef CAS PubMed .
  10. L. Ji, M. Rao, S. Aloni, L. Wang, E. J. Cairns and Y. Zhang, Energy Environ. Sci., 2011, 4, 5053–5059 CAS .
  11. G. Xu, B. Ding, L. Shen, P. Nie, J. Han and X. Zhang, J. Mater. Chem. A, 2013, 1, 4490–4496 CAS .
  12. G. C. Li, J. J. Hu, G. R. Li, S. H. Ye and X. P. Gao, J. Power Sources, 2013, 240, 598–605 CrossRef CAS PubMed .
  13. Y. Cao, X. Li, I. A. Aksay, J. Lemmon, Z. Nie, Z. Yang and J. Liu, Phys. Chem. Chem. Phys., 2011, 13, 7660–7665 RSC .
  14. L. Sun, M. Li, Y. Jiang, W. Kong, K. Jiang, J. Wang and S. Fan, Nano Lett., 2014, 14, 4044–4049 CrossRef CAS PubMed .
  15. Z. Li, Y. Jiang, L. Yuan, Z. Yi, C. Wu, Y. Liu, P. Strasser and Y. Huang, ACS Nano, 2014, 8, 9295–9303 CrossRef CAS PubMed .
  16. Z. Wen, D. Lu, S. Li, J. Sun and S. Ji, Int. J. Electrochem. Sci., 2014, 9, 1–14 Search PubMed .
  17. G. Babu, D. Bhuvaneswari and N. Kalaiselvi, J. Solid State Electrochem., 2013, 9–17 Search PubMed .
  18. A. Ganesan, R. Mukherjee, J. Raj and M. Shaijumon, J. Porous Mater., 2014, 21, 839–847 CrossRef CAS .
  19. J. R. Akridge, Y. V. Mikhaylik and N. White, Solid State Ionics, 2004, 175, 243–245 CrossRef CAS PubMed .
  20. S. Li, M. Xie, J. Liu, H. Wang and H. Yan, Electrochem. Solid-State Lett., 2011, 14, A105–A107 CrossRef CAS PubMed .
  21. N. Ding, Y. Lum, S. Chen, S. W. Chien, T. S. A. Hor, Z. Liu and Y. Zong, J. Mater. Chem. A, 2015, 3, 1853–1857 CAS .
  22. P. G. Bruce, S. A. Freunberger, L. J. Hardwick and J.-M. Tarascon, Nat. Mater., 2012, 11, 19–29 CrossRef CAS PubMed .
  23. G. Babu and L. M. Reddy Arava, Energy Environ. Sci., 2013, 6, 176–182 Search PubMed .
  24. Q. Pang, D. Kundu, M. Cuisinier and L. F. Nazar, Nat. Commun., 2014, 5, 4759 CrossRef CAS PubMed .
  25. G. He, S. Evers, X. Liang, M. Cuisinier, A. Garsuch and L. F. Nazar, ACS Nano, 2013, 7, 10920–10930 CrossRef CAS PubMed .
  26. L. Ji, M. Rao, H. Zheng, L. Zhang, Y. Li, W. Duan, J. Guo, E. J. Cairns and Y. Zhang, J. Am. Chem. Soc., 2011, 133, 18522–18525 CrossRef CAS PubMed .
  27. J. W. Kim, J. D. Ocon, D.-W. Park and J. Lee, ChemSusChem, 2014, 7, 1265–1273 CrossRef CAS PubMed .
  28. M.-K. Song, Y. Zhang and E. J. Cairns, Nano Lett., 2013, 13, 5891–5899 CrossRef CAS PubMed .
  29. X. Ji, S. Evers, R. Black and L. F. Nazar, Nat. Commun., 2011, 2, 325 CrossRef PubMed .
  30. S. Evers, T. Yim and L. F. Nazar, J. Phys. Chem. C, 2012, 116, 19653–19658 CAS .
  31. Z. Wei Seh, W. Li, J. J. Cha, G. Zheng, Y. Yang, M. T. McDowell, P.-C. Hsu and Y. Cui, Nat. Commun., 2013, 4, 1331 CrossRef PubMed .
  32. H. Kim, J. T. Lee, D.-C. Lee, A. Magasinski, W.-I. Cho and G. Yushin, Adv. Energy Mater., 2013, 3, 1308–1315 CAS .
  33. R. Demir-Cakan, M. Morcrette, F. Nouar, C. Davoisne, T. Devic, D. Gonbeau, R. Dominko, C. Serre, G. Férey and J.-M. Tarascon, J. Am. Chem. Soc., 2011, 133, 16154–16160 CrossRef CAS PubMed .
  34. J. Zheng, J. Tian, D. Wu, M. Gu, W. Xu, C. Wang, F. Gao, M. H. Engelhard, J.-G. Zhang, J. Liu and J. Xiao, Nano Lett., 2014, 14, 2345–2352 CrossRef CAS PubMed .
  35. S. S. Zhang and D. T. Tran, Electrochim. Acta, 2013, 114, 296–302 CrossRef CAS PubMed .
  36. Y. Yang, G. Yu, J. J. Cha, H. Wu, M. Vosgueritchian, Y. Yao, Z. Bao and Y. Cui, ACS Nano, 2011, 5, 9187–9193 CrossRef CAS PubMed .
  37. A. G. Simmonds, J. J. Griebel, J. Park, K. R. Kim, W. J. Chung, V. P. Oleshko, J. Kim, E. T. Kim, R. S. Glass, C. L. Soles, Y.-E. Sung, K. Char and J. Pyun, ACS Macro Lett., 2014, 3, 229–232 CrossRef CAS .
  38. W. Zhou, X. Xiao, M. Cai and L. Yang, Nano Lett., 2014, 14, 5250–5256 CrossRef CAS PubMed .
  39. Y. Zhao, Y. Zhang, Z. Bakenov and P. Chen, Solid State Ionics, 2013, 234, 40–45 CrossRef CAS PubMed .

Footnote

Electronic supplementary information (ESI) available. See DOI: 10.1039/c5ra04095g

This journal is © The Royal Society of Chemistry 2015
Click here to see how this site uses Cookies. View our privacy policy here.