F. Rafiaei,
R. Naderi* and
C. Dehghanian
School of Metallurgy and Materials Engineering, College of Engineering, University of Tehran, Tehran, Iran. E-mail: rezanaderi@ut.ac.ir; Fax: +98 21 88006076; Tel: +98 21 82084075
First published on 8th May 2015
In this study, the effect of curing on the structure and protective performance of an eco-friendly silane sol–gel coating on stainless steel 304L was investigated using electrochemical methods as well as surface analysis. The hybrid film consisting of tetraethoxysilane, methyltriethoxysilane and γ-glycidyloxypropyltrimethoxysilane was applied on the substrate via a sol–gel route. The electrochemical noise data indicated that the corrosion of stainless steel in a 3.5% sodium chloride solution is more effectively prevented through application of a coating cured at a higher temperature for a longer time. According to the Fourier transform infrared spectroscopy spectra, field emission scanning electron microscopy images and water contact angle analysis, the behavior was attributed to the formation of a highly crosslinked siloxane network by increasing the curing time and temperature. Consistent with the results of electrochemical noise measurements, electrochemical impedance spectroscopy data showed the significant effect of curing time and temperature on the hybrid silane film structure.
Many efforts have been made to enhance the barrier effect of the hybrid films.21–26 As one of the most efficient approaches, some studies have concentrated exclusively on the curing.9,27–31 The curing can affect the characteristics of silane films such as chemistry, structure and thickness. In general, the curing of silane coatings modifies the barrier properties through forming a reticulated network.27 During the curing process, SiOH groups of silane molecules crosslink and contribute to the formation of a Si–O–Si network. The condensation reactions between the silanol groups are accelerated by heat treatment of the silane layer.27,30 Franquet et al.27–29 investigated the effect of the curing time on the structure and the chemistry of a BTSE film on aluminum and observed that the thickness of the silane layer decreases slightly with the curing time. In addition, the curing caused changes in the optical constants of the BTSE films. They reported that the variation of these two parameters is attributed to the formation of a denser layer structure due to reticulation of the BTSE layer. To study the impact of curing time on the barrier properties of 3-aminopropyltriethoxysilane and bis-3-triethoxysilylpropylamine applied on cold rolled steel substrates, Chico and coworkers30 used the time constant at the high frequency region of the phase angle Bode plot. Accordingly, the development of a better defined curve associated to this time constant of the high frequencies was linked to the increase of cross-linking degree of the silane layer after a certain curing time. They concluded that the heat treatment of silane films can increase their barrier properties and leads to better corrosion protection of the steel substrate. In the case of a silane based organic–inorganic hybrid coating applied on mild steel, cracks were observed in the plain hybrid coatings on heat treating above 200 °C due to oxidation of the steel surface. However, crack free denser coatings with reduced porosity have been obtained at higher curing temperature, on addition of silica nanoparticles and cerium dopant to the plain hybrid matrix.31
According to the literature, no report is found studying the influence of curing time and temperature on the performance of eco-friendly silane sol–gel coatings applied on stainless steel substrates. Although stainless steels are widely used in different industrial applications because of their mechanical and corrosion inhibition properties, they are susceptible to localized corrosion in the presence of chlorides or other aggressive ions.22 Hence, this work intends to evaluate the influence of curing on the corrosion performance of a hybrid silane coating on 304L stainless steel. Since no organic solvent is present in the water-based silane solution used in this study, this technology is eco-friendly and, therefore, is believed to be an environmentally acceptable alternative to toxic surface treatments based on chromates and heavy metals compounds. The protective performance of the hybrid coatings synthesized by mixing of glycidyl-oxypropyl-trimethoxysilane (GPS), tetraethoxysilane (TEOS) and methyltriethoxysilane (MTES) was monitored using electrochemical impedance spectroscopy and electrochemical noise (EN). In order to study the morphology and structure of the hybrid films, field emission scanning electron microscopy (FE-SEM), Fourier transform infrared spectroscopy (FTIR) and contact angle measurements were employed.
Elements | Fe | C | Si | Mn | P | S | Cr | Ni | Mo | Al | Cu |
---|---|---|---|---|---|---|---|---|---|---|---|
wt% | Base | 0.0349 | 0.591 | 1.18 | 0.0211 | <0.00020 | 18.65 | 9.17 | 0.174 | 0.00052 | 0.138 |
The silanes consisting of γ-glycidoxypropiltrimethoxysilane (γGPS), methyltriethoxysilane (MTES) and tetraethoxysilane (TEOS) purchased from Aldrich, were employed without further purification. The aqueous silane solution was prepared at 10% in weight. In order to prepare the silane solution, 10% (w/w) of the silane mixture including an equal weight percentage of each one of the three components (TEOS/γGPS/MTES = 1/1/1 weight ratio) was dissolved in DI water. The value of pH was adjusted to 2.1 using HCl before adding the silane. The mixture was then magnetically stirred at ambient temperature for 24 h at a rate of 1000 rpm, which resulted in a clear and homogenous solution. The coating application process was performed through vertical dipping of the alkaline surface pretreated samples for 10 s in the prepared silane solution. After the drawing of the samples, the heat treatment was carried out at different conditions. A brief description of the different samples is presented in the Table 2.
Sample | Curing condition | |
---|---|---|
Temperature (°C) | Time (min) | |
S1 | 100 | 30 |
S2 | 150 | 30 |
S3 | 150 | 5 |
S4 | 150 | 60 |
S5 | 200 | 30 |
S6 | 200 | 5 |
S7 | 200 | 60 |
The morphology and thickness of the hybrid films were studied using a ZEISS σIGMA VP (Germany) model field emission type scanning electron microscopy (FE-SEM).
In order to determine water contact angle, the samples were horizontally placed on a sample holder. Subsequently, a drop of water was put on the sample surface, and an image was taken from the water drop at room temperature. The angle between the baseline of the drop and drop boundary was measured using image analysis software. To ensure repeatability, the surface analysis was performed on three replicates.
Sample | Rn (kΩ cm2) | |||||||
---|---|---|---|---|---|---|---|---|
S1 | S2 | S3 | S4 | S5 | S6 | S7 | ||
Immersion time (day) | 2 | 835.5 | 1569.0 | 803.7 | 1546.6 | 1708.5 | 1206.9 | 2179.7 |
7 | 781.0 | 1353.0 | 752.9 | 1449.7 | 1628.7 | 1070.1 | 1850.1 | |
14 | 729.9 | 996.2 | 391.9 | 1410.4 | 979.9 | 827.6 | 1630.0 | |
21 | 350.4 | 620.0 | 349.8 | 647.7 | 976.7 | 301.9 | 1541.0 |
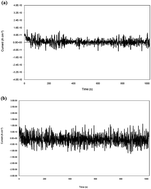
The time records of electrochemical current noise could also reveal the significant impact of curing on the hybrid film performance. Superior corrosion resistance of the stainless steel with the silane coating cured at 200 °C for 60 min is visible from Fig. 1, showing the time records of electrochemical current noise for samples S7 and S3 after 7 days of immersion in 3.5 wt% NaCl solution. In good agreement with the noise resistance data, the sample S3 generated current fluctuations characterized by higher amplitude compared to sample S7. An increase in the noise level in the case of S3 might be connected to higher electrochemical activity and progress of corrosion beneath the coating.35
![]() | ||
Fig. 1 Time records of electrochemical current noise for samples (a) S7 (b) S3 after 7 days of immersion in 3.5 wt% NaCl solution. |
The effect of heat treatment on the silane coating structure can be clearly observed from Fig. 2 illustrating the FTIR spectra of the samples cured at different times and temperatures. The broad band at 3200–3600 cm−1 and the signal at 850–950 cm−1 indicated the residual SiOH and hydrogen-bonded water in the silane film.3,22,36 Also, the peak representing Si–O–Si appeared at 1000–1200 cm−1.3,24 As the curing time and temperature increased, the intensity of silanol peak met a drop whereas the siloxane band appeared at higher intensity. During the curing process, more crosslinking forming denser siloxane network may modify the barrier properties of the silane sol–gel coating. On the other hand, a lot of uncondensed silanol groups as result of insufficient curing time and temperature can provide active sites in the hybrid film, increasing water uptake. Hence, the highest values of noise resistance taken for sample S7 can be evident from the FTIR spectra.
![]() | ||
Fig. 2 The effect of curing condition on FTIR spectra of the eco-friendly silane coatings: (a) magnified region from 850 to 1600 cm−1 and (b) magnified region from 2800 to 3800 cm−1. |
The water contact angle (WCA) measurements and FESEM surface analysis was employed to provide a better understanding of the behavior of different samples. Table 4 presents the hydrophilic nature of the samples which was evaluated by the water contact angle analysis. The experimental data highlighted more hydrophilicity of the silane coating cured at lower temperature and shorter time. Greater water contact angle can indicate less hydrophilic nature of the surface, meaning the surface is less prone to water. The denser reticulation of silane coatings cured at elevated temperature for a long time as a result of more condensation of silanol groups can decrease the surface hydrophilicity.28 According to the table, the samples S3 and S7 revealed the lowest and highest water contact angles, respectively. Fig. 3 shows the images of a water drop on the surface of the two samples.
Samples | S1 | S2 | S3 | S4 | S5 | S6 | S7 |
---|---|---|---|---|---|---|---|
WCA | 63.1 | 68 | 60 | 71.23 | 70.93 | 63.2 | 73.37 |
As observed in FTIR spectra (Fig. 2), high degree of network reticulation was achieved in the case of curring at 200 °C for 60 min. In the case of sample S7, the intensified condensation reaction rate might lead to few SiOH groups remained uncondensed. In other words, higher hydrophobicity of the sample can arise from fewer silanol groups making no contribution to crosslinking. In consistency with the time records of electrochemical current noise, the θwater data indicated superior protective performance of sample S7 presenting lower tendency to water sorption.
FESEM surface analysis indicated that the silane coating thickness is affected by the curing condition. The thickness of samples S7 and S3 were estimated 161 and 488 nm, respectively, from Fig. 4 depicting FESEM cross-sectional view of the samples. This can confirm the results of FTIR and water contact angle measurements regarding remarkable reticulation of the silane layer which was cured at 200 °C for 60 min. In other words, the result might be explained by the formation of silane film with a denser structure induced by longer time and elevated temperature of curing. As suggested by the electrochemical noise data, the enhanced barrier properties arising from high crosslink density is responsible for superior corrosion protection of sample S7.
In this sense, some publications also reported that the thickness decreases as the film is cured.27,29 For instance, through performing IR-spectroscopic ellipsometry measurements on AA1050 aluminium coated with BTSE, De Graeve et al.9 confirmed progressive layer shrinkage when curing temperature increased.
Several workers have analyzed the relationship between the Rn and the low frequency limit of electrochemical impedance.37–41 AC impedance spectra of the samples after 2 and 21 days of immersion in the electrolyte are presented in Fig. 5. Confirming the EN data, the figure showed that the curing condition of the silane coating can affect the corrosion resistance of stainless steel 304L in 3.5% NaCl solution, particularly at the end of exposure.
![]() | ||
Fig. 5 Nyquist and Bode diagrams of the samples after (a) 2 days and (b) 21 days of immersion in 3.5 wt% NaCl solutions. |
The low frequency impedance is reported to be a good indication for monitoring the protective function of coatings.42 The evolution of |Z|0.01 Hz within three weeks of exposure is depicted in Fig. 6. Various features can be inferred from the figure. According to the bar diagrams, the silanisation process could enhance the corrosion resistance of the stainless steel substrates in the sodium chloride solution. At the end of 21-d exposure, the bare metal revealed the lowest value of |Z|0.01 Hz. Among the coated specimens, sample S7 revealed the highest values of impedance modulus in the low frequency region during the whole immersion period, probably due to densification of the silane film with increasing the curing time and temperature. In the case of samples S1, S3 and S6, the variation of |Z|0.01 Hz implied that insufficient curing of the silane coatings may result in the creation of defects and conductive pathways promoting diffusion of the aggressive species to the interface. Because of permeation of the corrosive electrolyte through the coatings, the low frequency impedance for all samples followed a decreasing trend as time elapsed. Nevertheless, the silane film baked at 200 °C for 60 min could continue to hold its superiority till the end of exposure. After 21 days of immersion in 3.5% NaCl solution, the |Z|0.01 Hz of sample S7 was about 4.5 times higher than that of sample S3, probably due to higher crosslink density of silane coating cured at higher temperature for longer time. Considering Table 3 and Fig. 6, one can also observe a good trend correlation between low frequency impedance values and the noise resistance data. This is in agreement with the previous research in which the silane coating was applied on mild steel.7
To provide dipper insight into the anticorrosion performance of silane coatings, the impedance diagrams was further analyzed. During 21 days of immersion in the electrolyte, the impedance spectra all are characterized by two time constants. The high frequencies time constant is probably attributed to the sol–gel film while the second time constant in low frequencies could be the response of the interface.22 Fig. 5 indicated that the increase of curing time and temperature has a significant effect on the radius of semicircles at high frequencies. Since the coating resistance is attributed to the diameter of the first semicircles, the silane films which were cured at 200 °C for 60 min appeared to provide the most effective protection. However, negligible diameter of the loop in high frequency range indicated a poor and very defective coating in the case of samples 1 and 3 which allows easier diffusion of aggressive species to the interface.
Fig. 7a presents the electrical equivalent circuit proposed to model EIS spectra where Rs represents the solution resistance, Rct the charge transfer resistance, CPEdl the double layer constant phase element and Rf and CPEf the parameters concerning the silane sol–gel layer. A typical fitting result of the impedance spectra (solid lines) with the equivalent circuit proposed in Fig. 7a is shown in Fig. 7b. Fig. 7b depicts an excellent correlation between the simulated and measured data (separated points).
In order to assess the impact of curing condition on the silane coatings performance, the time variation of coating resistance and coating capacitance as parameters extracted from EIS diagrams was monitored. Table 5 shows the evolution of coating resistance as a function of immersion time for all samples. One glimpse of the table is enough to find that Rf values significantly increased by raising the temperature and time of the baking process. As evidenced by the surface analysis, the improvement in coating resistance might be attributed to decrease of film porosity and defects resulting from the formation of a highly cross-linked network. In this sense, several studies on different substrates have also reported that the crosslinking of the siloxane film can be accelerated by increasing the curing temperature and time.27–31 This may result in a crack free and dense coating with less porosity, which hinders the penetration of aggressive species towards the metallic substrate. In comparison with sample S7, the coating resistance of sample S1 was negligible during 21 days of immersion in the saline solution. In the case of sample S7, the efficient physical barrier can be a net result of dense, uniform and defect free film cured at elevated temperature for a long time. On the other hand, the heat treatment at 100 °C for 30 min might lead to a network with low crosslink density which offers poor resistance to the electrolyte permeation. From the table, it is also visible that the fast curing process at high temperature (sample S6) resulted in a non-protective silane coating. When the curing time and temperature increase, more condensation reactions may occur between silanol groups due to the higher amount of thermal energy which results in a higher cross-linking density. Therefore, the curing of a silane film may provide an effective corrosion protection for the metallic substrates through improving barrier properties.
Sample | Rf (Ω cm2) | |||||||
---|---|---|---|---|---|---|---|---|
S1 | S2 | S3 | S4 | S5 | S6 | S7 | ||
Immersion time (day) | 2 | 52.43 | 50![]() |
111.5 | 74![]() |
227![]() |
624.9 | 376![]() |
7 | 27.45 | 20![]() |
45.36 | 46![]() |
153![]() |
191.4 | 218![]() |
|
14 | 20.25 | 13![]() |
34.84 | 36![]() |
83![]() |
148.8 | 196![]() |
|
21 | 11.7 | 3933 | 25.11 | 21![]() |
55![]() |
82.37 | 121![]() |
It is also apparent from Table 5 that the Rf values declined steadily as time progressed, presumably due to gradual deterioration of the silane layers enabling easier access of the electrolyte to the interface. Even after 21 days of immersion, the most effective protection was detected for sample S7 showing the lowest drop in the coating resistance.
In the equivalent circuit, CPE has been introduced account for the non-ideal behavior of the system. The parameter consists of Y0 and n which are the admittance and exponent of CPE, respectively. To calculate the coating capacitance (Cf), eqn (1) was used.43
![]() | (1) |
To evaluate the protective performance of coatings, the coating capacitance is a key parameter indicating the water barrier properties of the films.44 Through measurement of Cf, it is possible to study the water uptake phenomena occurring in coatings in a wet environment. The presence of aqueous solutions in the coating films can activate the corrosion process at the interface or can cause loss of adhesion and blistering.32 In Fig. 8, the experimental capacitance values of samples S3 and S7 are plotted versus immersion time. From the corrosion protection point of view, the values of Cf could reveal the superiority of sample S7. This means that the silane coating cured at 150 °C for 5 min showed higher values of Cf during the whole immersion period. The results of FTIR and FESEM surface analysis indicated that the densification of silane films depends upon the baking condition. The network reticulation as a result of prolonged curing at elevated temperature may decrease the hybrid coating permeability. Moreover, higher θwater value of sample S7 implied that the coating is more hydrophobic. In other words, the heat treatment promoting the condensation reactions caused lower amounts of hydrophilic silanol groups throughout the film.
This journal is © The Royal Society of Chemistry 2015 |