Shenqiang Wang,
Hepeng Zhang*,
Xin Chen,
Huan Li,
Hai Wang,
Peitao Li,
Baoliang Zhang and
Qiuyu Zhang*
Key Laboratory of Applied Physics and Chemistry in Space of Ministry of Education, School of Science, Northwestern Polytechnical University, Xi'an 710129, China. E-mail: zhanghepeng@nwpu.edu.cn; qyzhang1803@gmail.com
First published on 17th March 2015
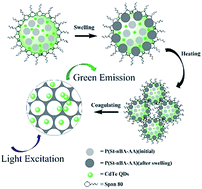
CdTe/P(St-nBA-AA) pierced fluorescent microspheres with a novel hollow morphology were prepared via a rapid inverse emulsion method. CdTe quantum dots (QDs), which were synthesized by a simple one-pot reflux process using thioglycolic acid as a stabilizer in an aqueous phase, were embedded into the polymer skeleton. The P(St-nBA-AA) component with a low glass transition temperature (Tg = 65 °C) was prepared by soap-free emulsion polymerization. Subsequently, the morphology, composition and spectral characteristics of the CdTe QDs and CdTe/P(St-nBA-AA) pierced fluorescent microspheres were determined by SEM, TEM, FTIR, TGA, XRD, laser particle analysis, and fluorescence spectrometry. The results indicated that the fluorescent microspheres had a relatively smooth surface and hollow internal structure. The QD content of the pierced fluorescent microspheres was 12.68%. Moreover, a synergistic effect mechanism of solvent swelling and phase transition was proposed. The formation process of pierced fluorescent microspheres was the swelling, movement, winding of the polymer chains of P(St-nBA-AA) particles, which were stabilized on the interface of the water/oil phase at temperatures higher than the Tg of the polymer component.
QDs/polymer composite particles possess both excellent properties of the two components, for instance, fluorescence properties, luminous stability, modifiability, and the easy control features. Currently, the preparation of QDs/polymer composite particles are composed mainly of a layer-by-layer self-assembly method,5–7 template method,8–10 emulsion polymerization,11,12 and microfluidics method.13–16 Although there are various preparation methods, there still remains a variety of blocks, including complicated preparation process, single morphology, QDs fluorescence quenching after aggregation17–19 and other issues. Therefore, it is essential to establish a quick and simple synthetic method to produce QDs/polymer composite particles with novel structures and high fluorescence intensity. Through this, the fluorescence intensity, enhancement of the luminous stability, and the expanding applications of QDs can be maintained.
On the basis of the above information, in this work, water-dispersible fluorescent CdTe QDs were prepared by a simple one-pot reflux process using thioglycolic acid as a stabilizer in an aqueous phase, which served as the fluorescent component. P(St-nBA-AA) polymer particles with low Tg were prepared by soap-free emulsion polymerization. A stable inverse emulsion using n-octanol as the oil phase was formed using the above two components. The polymer chains on the surface of the polymer particles began moving and fusing due to the synergistic effect of solvent swelling and phase transition. CdTe/P(St-nBA-AA) pierced fluorescent microspheres with a novel hollow morphology were finally obtained when the temperature was heated above the Tg of P(St-nBA-AA) and the QDs were embedded into the skeleton of the particles simultaneously. This preparation process was a simple method to solve the problems of fluorescence quenching significantly when the two components recombined directly. Meanwhile, new ways were proposed to build the construction of multifunctional fluorescent composites, and the foundation for expanding the applications of multi-functional fluorescent composites was laid.
The glass transition temperature (Tg) of the P(St-nBA-AA) polymer particles was 65 °C, which was characterized by DSC analysis, as shown in Fig. 2. When the temperature exceeded 65 °C, the state of the polymer particles transformed gradually from glassy into rubbery, resulting in the flow of the molecular chains of the polymer particles. Thereafter, the structure of the particles changed and the adjacent molecules crosslinked to form a hollow structure.
The morphology of the obtained CdTe QDs and their spatial distribution were analyzed by TEM. Under TEM, the as-prepared QDs were quasi-spherical particles (Fig. 3a), which is consistent with the previously reported aqueous CdTe QDs.20 The HRTEM (inset) images showed that the CdTe QDs were crystalline, sufficiently monodisperse and well separated. This was attributed to thioglycolic acid ligands modified on the surface of the QDs, which not only enhanced its hydrophilicity, but also served as a release agent between the particles. As shown in Fig. 3b, it was obvious from the TEM analysis of a CdTe/P(St-nBA-AA) fragment that the QDs were embedded randomly into the pierced microspheres.
Fig. 3c–f shows typical SEM images of CdTe/P(St-nBA-AA) pierced fluorescent microspheres. The overall size of the microspheres ranged from a few microns to dozens of microns, as shown in Fig. 3c. Most microspheres possessed an almost spherical shape. Only a fraction of them were irregular, presumably due to disruption during sample preparation and analysis. After an appropriate amplification, the surfaces of the microspheres were relatively smooth, as displayed in Fig. 3d. The SEM image in Fig. 3e showed that the adjacent microspheres approach each other and coalescence occurred during this process, which is in accordance with the growth process expected originally. In order to demonstrate the internal structure of the microspheres, a section of a microsphere is presented in Fig. 3f. A large number of channels inside the sphere were observed, confirming the hollow structure of the microspheres. In other words, the effectiveness of the preparation method was proven.
With more detailed studies, the formation of pierced microspheres was not only caused by the phase transition of polymer particles, but also influenced by the solvent. A series of temperature gradients, ranging from 20 °C to 70 °C, was set up to systematically investigate the effect of temperature on the formation of pierced microspheres and explore the formation mechanism. As shown in Fig. 4, the temperature was dominant to promote the growth of microspheres, which was consistent with a previous report.21 However, it was imperative to determine that the pierced microspheres formed below the Tg of P(St-nBA-AA). Fig. 4a shows that irregular microspheres with a smaller size formed at room temperature. With increasing temperature, the sphericity, particle size and surface roughness of these microspheres were improved evidently. A mass of grainy embossments were present on the surface of the microspheres until the temperature was higher than Tg of P(St-nBA-AA). At 70 °C, the microspheres possessed favorable sphericity with a smooth surface and relatively large particle size.
Fig. 4 SEM images of the CdTe/P(St-nBA-AA) pierced fluorescent microspheres at different reaction temperatures: (a) 20 °C, (b) 30 °C, (c) 40 °C, (d) 50 °C, (e) 60 °C, and (f) 70 °C. |
On the basis of the SEM observation during the growth process of CdTe/P(St-nBA-AA) pierced fluorescent microspheres and the above discussion, we proposed a possible microspheres formation mechanism that contained two main steps, as shown in Scheme 1. First, the emulsion of P(St-nBA-AA) polymer particles was mixed with CdTe QDs, and then added to the solution of n-octanol dispersed with non-ionic surfactant Span80. With continuous stirring, an increasing number of polymer particles were exposed to the surrounding n-octanol. The P(St-nBA-AA) polymer particles became increasingly loose because of the swelling effect of n-octanol. Meanwhile, P(St-nBA-AA) polymer particles were likely to approach each other due to the surfactant. The molecular chains among the adjacent microspheres started flowing, as indicated below, to form a hollow-out network structure after crosslinking. The CdTe QDs were dispersed in the pores of the microspheres. When the temperature was higher than the Tg of the polymer (65 °C), the polymer particles gradually transformed from a glassy state to an elastomeric state. The flow of the molecular chain accelerated dramatically due to the synergistic effect. CdTe/P(St-nBA-AA) pierced fluorescent microspheres with a smooth surface were finally obtained.
Scheme 1 Schematic for the formation mechanism of CdTe/P(St-nBA-AA) pierced fluorescent microspheres. |
The binding of thioglycolic acid onto the surface of CdTe QDs was confirmed by FT-IR spectroscopy. As shown in Fig. 5, the FT-IR spectrum of the thioglycolic acid-functionalized CdTe QDs (curve a) showed the characteristic peaks of thioglycolic acid at 3428 cm−1, 2923 cm−1, 2866 cm−1, and 1737 cm−1. The band at 3428 cm−1 was assigned to the O–H stretching vibration of a carboxyl functional group, while the bands at 2923 cm−1 and 2866 cm−1 were due to the C–H symmetric and antisymmetric stretching vibrations, respectively. The peak at 1737 cm −1 was attributed to the CO stretching vibration. However, there was no characteristic peak for S–H in the vicinity of 2565 cm−1, which indicated that coordination occurred between S–H of thioglycolic acid and Cd2+ of CdTe QDs. In addition, the aromatic C–H stretching vibration appeared at 3028 cm−1, as shown in curve b. The emerging absorption peak near 1606 cm−1 and 1446 cm−1 corresponded to the skeleton vibration of benzene ring synchronously. The characteristic absorption peaks of P(St-nBA-AA) polymer and surface ligand thioglycolic acid of CdTe QDs coexisted on curve b in the infrared spectra. Hence, these results suggest that a composite of the two components had been successfully completed.
In addition, the crystal structure of the synthesized CdTe QDs and CdTe/P(St-nBA-AA) pierced fluorescent microspheres were also examined by X-ray diffraction (XRD). In Fig. 6, although a phenomenon of wider diffraction peaks appeared, we could still clearly make out the three characteristic diffraction peaks of CdTe QDs. The broad Bragg scattering peaks could be attributed to the (111), (220) and (311) lattice planes of the sphalerite phase CdTe (JCPDS File card no. 75-2086), which corresponded to the 2θ values of 24.4°, 41.7° and 47.3°, respectively. Compared to bulk materials, its diffraction peak position shifted to CdS. It can be concluded that the partial hydrolysis of the thiols and the incorporation of sulfur from the thiol molecules into the growing nanoparticles occurred, which was in keeping with the FT-IR spectrum mentioned above. Distinct with curve a, a wide and dispersion diffraction peak with a 2θ value of 20.2° belonged to P(St-nBA-AA) (curve b). Because the polymer component plays a predominant role in the pierced microspheres, the intensity of the polymer diffraction peak became much higher and the three scattering peaks of CdTe QDs became gradually fuzzy. Therefore, these findings strongly suggested that the CdTe/P(St-nBA-AA) pierced fluorescent microspheres had been prepared.
Fig. 6 X-ray diffraction (XRD) pattern of CdTe fluorescent QDs (a); CdTe/P(St-nBA-AA) pierced fluorescent microspheres (b). |
To further examine the proportion of CdTe QDs in the pierced microspheres, TGA was performed on both CdTe QDs and CdTe/P(St-nBA-AA) pierced fluorescent microspheres. The TGA curves are shown in Fig. 7. The mass loss of the two samples were 17.9% and 87.32%, respectively, over the whole temperature range. As in the former one, it can be observed clearly that the initial weight loss of CdTe QDs started at room temperature and lasted until 200 °C, which was due to the evaporation of absorbed or crystalline water. When the temperature ranged from 240 °C to 413 °C, the mass loss was attributed to the decomposition of coated thioglycolic acid ligand. The content of the residual component was 82.1%, which was perceived as bare CdTe QDs. Curve b indicated that the CdTe/P(St-nBA-AA) pierced fluorescent microspheres decomposed completely at approximately 522 °C. Similarly, the decomposition of pierced microspheres could also be divided into two sections. From 265 °C to 410 °C, the mass loss of this stage was driven by thermal decomposition of the P(St-nBA-AA) polymer component. When the temperature exceeded 410 °C, the inconspicuous weight loss process, which was caused by the degradation of the thioglycolic acid ligand, was delayed with the introduction of P(St-nBA-AA). The calculation results showed that the CdTe QDs content of the pierced microspheres can be up to 12.68 wt%.
In a contrast experiment, the mass ratio of CdTe/P(St-nBA-AA) was changed to investigate how the content of CdTe QDs varied. The results are displayed in Table 1. The content of CdTe QDs increase approximately linearly with increasing ratio.
The mass ratio of CdTe/P(St-nBA-AA) | Mass loss | The content of CdTe QDs |
---|---|---|
1:2 | 95.57 | 4.43 |
1:1 | 91.32 | 8.68 |
1.5:1 | 87.32 | 12.68 |
2:1 | 85.84 | 14.16 |
As the major fluorescent material, CdTe QDs were added to the surrounding polymer particles during the reverse emulsification process, as described above. Assessing the fluorescence properties of the two components and pierced microspheres is of vital importance. The fluorescence properties of the CdTe QDs, P(St-nBA-AA), as well as CdTe/P(St-nBA-AA) were studied. A representative result is shown in the emission spectra in Fig. 8a. As expected, an observable shoulder arose at a wavelength of 486 nm, which almost completely overlapped with the emission peak of P(St-nBA-AA). Hence, the CdTe QDs and P(St-nBA-AA) recombined entirely, and their fluorescence properties were also retained. However, a noticeable blue shift appeared in the QDs emission spectrum. This was likely due to the reduced hydrophilicity of their surroundings when CdTe QDs were encapsulated into the polymer skeleton. In addition, CdTe QDs might absorb less energy under irradiation with the lights of the same wavelength as they were embedded in the polymer component. It was not strictly obvious that the emission spectrum of P(St-nBA-AA) was affected. P(St-nBA-AA) prior to adsorbing energy might contribute to this phenomenon. Furthermore, the proportion of the polymer component was much higher than CdTe QDs; hence, it could not be affected easily.
For further verification of the stability and permanency of the QDs into the microspheres, a series of contrast experiments were performed. The CdTe/P(St-nBA-AA) in an aqueous solution with same concentration was kept for 0.5 h, 1 h, 2 h, 6 h, 12 h, 24 h, 48 h, and 96 h, respectively. The supernatant was collected via centrifugation. Fig. 8b shows the spectroscopic properties of the supernatant and original CdTe/P(St-nBA-AA) pierced fluorescent microspheres solution with the same concentration. As we can see from the spectrum, negligible signal changes were observed when all the above supernatant was excited. An extremely weak emission peak arose at a wavelength of 486 nm, which was assigned to P(St-nBA-AA). It might be that some fragments fell off from the surface of CdTe/P(St-nBA-AA) pierced fluorescent microspheres. The fluorescence intensity at a wavelength of 530 nm was almost invisible compared to the original CdTe/P(St-nBA-AA) pierced fluorescent microspheres solution. These observations indicated that CdTe/P(St-nBA-AA) pierced fluorescent microspheres have great potential in biological applications as a valuable alternative.
In a control experiment, we examined the impact of the CdTe QDs content on the fluorescent property of pierced microspheres. Fig. 8c shows the fluorescence intensity of microspheres prepared with different QDs contents. Irrespective of their stability, given a higher CdTe QDs content, the associated emission intensity increased significantly.
This journal is © The Royal Society of Chemistry 2015 |