Gao-Yuan Yang,
Shuai Shao,
Yi-Hu Ke,
Chun-Ling Liu*,
Hui-Fang Ren and
Wen-Sheng Dong*
Key Laboratory of Applied Surface and Colloid Chemistry (SNNU), MOE, School of Chemistry and Chemical Engineering, Shaanxi Normal University, Xi'an, 710062, China. E-mail: clliutt@snnu.edu.cn; wsdong@snnu.edu.cn; Fax: +86-29-81530806; Tel: +86-29-81530806
First published on 17th April 2015
Thermally expanded graphene oxide (TEGO) supported PtAu alloy nanoparticles with various compositions was prepared, and then characterized using a combination of atomic absorption spectroscopy, powder X-ray diffraction, transmission electron microscopy and X-ray photoelectron spectroscopy. These catalysts were evaluated for the aerobic oxidation of glycerol in base-free aqueous solution. The results showed that PtAu(7:
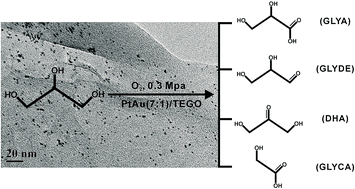
1)/TEGO exhibited the optimum activity for the conversion of glycerol among all the catalysts. Glycerol conversion of 60.4% and selectivities of 53.5% glyceric acid (GLYA), 25.7% glyceraldehydes (GLYDE), 11.6% dihydroxyacetone (DHA), and 3.8% glycolic acid (GLYCA) were obtained when reacting an aqueous solution of glycerol (0.3 M, 20 mL) at 60 °C under 0.3 MPa O2 for 4 h in the presence of 0.023 g PtAu(7
:
1)/TEGO catalyst. Moreover, the reusability of PtAu(7
:
1)/TEGO was investigated, and a reaction mechanism for the oxidation of glycerol was proposed.
Glycerol is currently produced in large amounts as a byproduct of the manufacture of biodiesel by the transesterification of vegetable oils and animal fats. The conversion of the byproduct glycerol into value-added products would make the biodiesel industry economically more attractive. The oxidation of glycerol could follow complex reaction pathways yielding various C3 oxygenates (glyceric acid, glyceraldehyde, dihydroxyacetone, tartronic acid, etc.) together with C2 (oxalic and glycolic acids) and C1 (formic acid) products. Hence, it is still a challenge to control the selectivity to give desired products by choosing highly efficient catalysts.2
The aerobic oxidation of glycerol has been extensively studied using monometallic metal Pt,3–9 Pd,10,11 Au12–18 et al. A major disadvantage of supported Pt-group catalysts is their rapid deactivation by overoxidation of the metal surface and by poisoning of the active sites by strongly adsorbed products or byproducts.8,19 Bimetallic catalysts lead to a strong synergistic effect and show better catalytic performance with respect to monometallic systems. So far, various bi-metal catalysts have been examined in the aerobic oxidation of glycerol in base-free aqueous solution.20–25 For example, Villa et al.26 found only 5% conversion of glycerol and 70% selectivity to glyceric acid over a monometallic 1% Au/H-mordenite catalyst at 100 °C for 2 h under 3 atm O2, but 70% conversion of glycerol and 83% selectivity to glyceric acid over a bimetallic 1% (Au:
Pt 6
:
4)/H-mordenite. Hutchings et al.27 observed 29.2% glycerol conversion and 78.4% glyceric acid selectivity over AuPt(1
:
1)/MgO after reaction at 60 °C for 4 h under 0.3 MPa O2. While 42.9% conversion of glycerol and 78.4% selectivity to glyceric acid were obtained over AuPt(1
:
3)/MgO. More recently, Tongsakul et al.28 investigated the aerobic oxidation of glycerol using hydrotalcite (HT)-supported Au–Pt alloy nanoparticles, and found that Pt60Au40/HT was the most active catalyst in the reaction, giving 73% conversion of glycerol and 78% selectivity to glyceric acid at ambient temperature for 4 h under oxygen flow. Although bimetallic catalysts have been found exhibiting better catalytic performance than monometallic systems, the influence of the composition and internal structure of the alloy, and the understanding of the mechanism by which they give enhanced performances, still remains an open field of research.
Recently, graphene, a one-atom-thick planar sheet of carbon that is densely packed in a honeycomb crystal lattice, has attracted extensive attention as a catalyst support because of its high surface area and outstanding electrical conductivity.29–32 Both surfaces of the sheet are accessible for reactants, which would reduce the diffusion limitations and promoted the reaction efficiency.30,32 Truong-Huu et al.30 have found that palladium nanoparticles (NPs) dispersed on a few-layer graphene exhibited high activity for cinnamaldehyde hydrogenation than those supported on the 1D carbon nanotubes.
Inspired by the excellent performance of the graphene supported catalysts in the various reactions, we prepared bi-metallic platinum–gold nanoparticles dispersed on thermal expanded graphene oxide and used these materials to catalyze the oxidation of glycerol in base-free aqueous solution. This novel catalyst shows good catalytic performance for the efficient conversion of glycerol.
All chemicals were of analytical grade and were used as received without further purification.
Supported Pt–Au catalysts were prepared by immobilizing the colloidal metal particles on the TEGO supports. In a typical preparation, the protecting agent was added (PVA/metal mass ratio = 0.5) to a 50 mL aqueous solution of H2PtCl6·6H2O and HAuCl4 (1.12 × 10⁻³ M) at room temperature (25 °C) under vigorous stirring. A following rapid injection of a 0.1 M aqueous solution of NaBH4 (NaBH4/metal molar ratio = 4) led to the formation of a dark solution, indicating the formation of metallic colloids. The pH of the colloidal solution needed to be adjusted to 2 with sulfuric acid prior to the immobilization. The immobilization of metallic particles on the TEGO material was accomplished at room temperature (25 °C) by adding the support to the colloidal solution by ultrasonication and they were kept in contact until total adsorption (10 wt% metal on the support) occurred, as indicated by a decoloration of the solution. The solids were collected by filtration followed by washing the solid with distilled water to remove all the dissolved species (e.g. Na+, Cl−). Finally, the solids were dried under vacuum at 110 °C for 12 h.
Sample analysis was performed on a Shimadzu HPLC LC-20AT system equipped with both refractive index (RID-10A) and UV (SPD-20A) detectors. An ion exclusion column (Bio-Rad Aminex HPX-87H) at 40 °C was used to separate and identify the compounds. In order to well separate the products, two mobile phases flowing at 0.30 mL min−1 were used. One was aqueous 0.005 M H2SO4, and the other was 0.005 M HCOOH. The amount of products was determined by using calibration curves.
Catalyst | Au (wt%) | Pt (wt%) | Total metal loading (wt%) | Pt/Au atomic ratio |
---|---|---|---|---|
Pt/TEGO | — | 9.8 | 9.8 | — |
PtAu(7![]() ![]() |
1.3 | 8.9 | 10.2 | 6.9 |
PtAu(5![]() ![]() |
1.6 | 8.5 | 10.1 | 5.4 |
PtAu(3![]() ![]() |
2.3 | 7.6 | 9.9 | 3.3 |
PtAu(1![]() ![]() |
4.9 | 5.4 | 10.3 | 1.1 |
PtAu(1![]() ![]() |
8.0 | 2.0 | 10.0 | 0.25 |
Au/TEGO | 9.6 | — | 9.6 | — |
PtAu(7![]() ![]() |
0.5 | 8.6 | 9.1 | 17.4 |
The XRD patterns of Pt/TEGO, Au/TEGO, and PtAu/TEGO catalysts are shown in Fig. 1. A broad peak centered at ∼24° was observed for all the samples, which was ascribed to the formation of “re-graphitized” carbon regions and restacking due to the van der Waals attractive interactions.31 No diffraction peaks at 10.8° from graphite oxide were observed, indicating that the graphite oxide was partially reduced by the thermal expansion at high temperature, without excessive covalent chemical functionalization as in the case of GO.32 The XRD pattern of Pt/TEGO showed a strong reflection peak at 39.7° and a weak peak at 46.4°, corresponding to (1 1 1) and (2 0 0) crystal planes of Pt, respectively. For Au/TEGO, a strong peak at 38.3° and a weak peak at 44.6° were observed, which could be assigned to (1 1 1) and (2 0 0) crystal planes of Au, respectively. All the XRD patterns of PtAu/TEGO revealed the face-centered cubic structure of Pt–Au alloy. The diffraction peak of (1 1 1) plane gradually shifted from 2θ = 38.3°, 38.5°, 38.6°, 38.8°, 38.9°, 39.1°, and 39.7° with increasing the content of Pt in the PtAu/TEGO catalysts, confirming the formation of Pt–Au alloy in the PtAu/TEGO catalysts.28
![]() | ||
Fig. 1 XRD patterns for various graphene supported catalysts: (a) Pt/TEGO, (b) PtAu(7![]() ![]() ![]() ![]() ![]() ![]() ![]() ![]() ![]() ![]() |
TEM micrographs and mean particle size distribution histograms for all catalysts are shown in Fig. 2. The corresponding HRTEM images of the bimetallic catalysts are shown in Fig. s1.† Bimetallic nanoparticles were well dispersed on the surface of TEGO and showed a narrow size distribution. The average Pt particle size in Pt/TEGO was 2.2 nm; the average Au particle size in Au/TEGO was 2.8 nm. Increasing the amounts of Au in the PtAu/TEGO catalysts had a slight effect on the mean particle sizes of Pt–Au alloy. The HRTEM images showed that lattice fringes of Pt–Au alloy particles were 0.225, 0.227, 0.229, 0.229 and 0.231 nm for PtAu(7:
1)/TEGO, PtAu(5
:
1)/TEGO, PtAu(3
:
1)/TEGO, PtAu(1
:
1)/TEGO and PtAu(1
:
3)/TEGO, respectively, which were different from the (1 1 1) lattice spacings Au (0.235 nm) and Pt (0.226 nm), further confirming the formation of Pt–Au alloy.
XPS was used to analyze the surface element composition and content of the catalysts, and the results are summarized in Table 2. The representative spectra for PtAu(7:
1)/TEGO are shown in Fig. s2.† From the C1s spectrum three different peaks centered at 284.8, 286.3, and 288.8 eV were observed, corresponding to C–C, C–O, and C
O groups, respectively. The C–C group occupied the vast majority, revealing that the oxygen-containing functional groups were mostly removed and the conjugated graphene networks were kept after the thermal expansion at high temperature.33 In addition, XPS measurements revealed that the C/O ratio (5.1–6.1) of the TEGO supported catalyst was evidently more than that of graphene oxide (1.7–2.5), and less than that of graphene (10.8–14.9), further confirming that the graphite oxide was partially reduced by the thermal expansion at high temperature.32 The valence state information of Au and Pt was also studied by XPS and the results are shown in Table 2 and Fig. s1.† The binding energy of Au4f7/2 in each sample was almost constant (∼84.2 eV), indicating that Au was present as metallic state and no electronic interaction between Au–TEGO and Au–Pt. The binding energy of Pt4f7/2 in each sample was ∼71.7 eV except for PtAu(1
:
3)/TEGO, indicating that a small positive shift to high binding energy as compared with Pt foil (Pt 4f7/2: 71.2 eV). The results suggest that Pt was present as Ptδ+ because the surface of Pt0 could be easily oxidized when exposed to air. For PtAu(1
:
3)/TEGO, the binding energy of Pt4f7/2 was 71.1 eV, suggesting that Pt species in this catalyst was mainly present in metallic state because this catalyst contained more Au that might prevented the oxidation of Pt. As shown in Tables 1 and 2, the surface contents of Pt and Au were higher than those in the bulk of the catalysts, indicating the enrichment of Pt and Au on the surface. Moreover, the surface Pt/Au atomic ratios for PtAu(3
:
1)/TEGO, PtAu(5
:
1)/TEGO, and PtAu(7
:
1)/TEGO were 2.3, 2.7, and 3.3, respectively; the bulk Pt/Au ratios for the corresponding catalysts were 3.3, 5.4, and 6.9, respectively. The results suggest that Au was relatively enriched on the surface of Au–Pt alloy in these three catalysts. Whereas, for PtAu(1
:
1)/TEGO, PtAu(1
:
3)/TEGO the situations were reversed, Pt was relatively enriched on the surface of Au–Pt alloy in these two catalysts.
Catalysts | Binding Energy (eV) | Surface concentration (wt%) | Pt/Au atomic ratio | ||||
---|---|---|---|---|---|---|---|
Au4f7/2 | Pt4f7/2 | C | O | Pt | Au | ||
Pt/TEGO | — | 71.7 | 63.6 | 14.3 | 22.0 | 0.0 | — |
PtAu(7![]() ![]() |
84.2 | 71.8 | 60.5 | 13.9 | 19.6 | 6.0 | 3.3 |
PtAu(5![]() ![]() |
84.2 | 71.7 | 59.4 | 14.2 | 19.3 | 7.1 | 2.7 |
PtAu(3![]() ![]() |
84.2 | 71.7 | 58.4 | 13.7 | 18.8 | 8.1 | 2.3 |
PtAu(1![]() ![]() |
84.2 | 71.7 | 61.0 | 13.8 | 16.3 | 8.8 | 1.9 |
PtAu(1![]() ![]() |
84.2 | 71.1 | 63.1 | 13.7 | 13.4 | 9.8 | 1.4 |
Au/TEGO | 84.3 | — | 67.2 | 17.5 | 0.0 | 15.3 | — |
PtAu(7![]() ![]() |
— | 71.9 | 62.5 | 14.8 | 22.7 | 0 | — |
![]() | ||
Fig. 3 Oxidation of glycerol using various TEGO supported catalysts in water (catalyst 0.023 g, glycerol 6 mmol, water 20 mL, glycerol/metal = 750 (mol mol−1), 60 °C, 0.3 MPa O2). |
Fig. 4 shows the time course of glycerol oxidation on PtAu(7:
1)/TEGO in base-free aqueous solution. At the initial stage of the oxidation reaction (1.0 h), glycerol conversion was 21.8%. The corresponding selectivities of glyceric acid, glyceraldehyde, glycolic acid, and dihydroxyacetone were 69.5%, 10.7%, 4.8%, and 6.4%, respectively. With prolonged reaction time, glycerol conversion increased and the selectivity of glyceric acid gradually decreased, whereas the selectivities of glyceraldehyde and dihydroxyacetone roughly increased, indicating that as the reaction was in progress the oxidation rate of glyceraldehyde to glyceric acid decreased.
![]() | ||
Fig. 4 Time course of glycerol oxidation over PtAu(7![]() ![]() |
The oxidation of glycerol could follow complex reaction pathways yielding various oxygenated products.2,19 The oxidation of a primary or secondary alcohol produces glyceraldehyde or dihydroxyacetone, respectively. These two produces are often in equilibrium in aqueous solution, depending on the pH.19 Both glyceric acid and dihydroxyacetone can be oxidized to hydroxypyruvic acid. Tartronic acid is produced by the sequential oxidation of glyceric acid, while glycolic acid is the product of sequential oxidation of glyceric acid and tartronic acid. The sequential oxidation of glycolic acid and hydroxypyruvic acid generates oxalic acid and one carbon products (formic acid, COx). In the present study, the main products were glyceric acid and glyceraldehyde together with small amounts of dihydroxyacetone, glycolic acid, and trace amounts of C1 products, suggesting that the formation rate of dihydroxyacetone over PtAu(7:
1)/TEGO was lower than that of glyceraldehyde. Therefore, a plausible reaction pathway for the oxidation of glycerol over PtAu(7
:
1)/TEGO in base-free aqueous solution is proposed in Scheme 1.
The reusability of PtAu(7:
1)/TEGO in the oxidation of glycerol was investigated. After each trial, the catalyst was separated from the reaction solution by filtration, washed with distilled water, dried and then used for the next run under identical reaction conditions. The results in Fig. 5 revealed that both the conversion of glycerol and the selectivity of glyceric acid decreased; whereas the selectivites of glyceraldehyde and dihydroxyacetone increased gradually.
![]() | ||
Fig. 5 Recycling of PtAu(7![]() ![]() |
To determine the real reasons underlying catalyst deactivation, the used PtAu(7:
1)/TEGO catalyst was characterized by XRD, TEM, XPS, and AAS analysis. AAS analysis (Table 1) indicated that contents of Au and Pt in PtAu(7
:
1)/TEGO decreased from 1.3% to 0.5%, and 8.9% to 8.6% after four recycling, respectively. XPS analysis (Fig. s1,† and Table 2) showed that no Au signal was detected on the used catalyst surface; while Pt content increased from 19.6% to 22.7%. The results indicated that the leaching of Au could occur after recycling. Moreover, XRD pattern (Fig. s3†) confirmed that the (1 1 1) diffraction peak of Pt–Au alloy increased in intensity. TEM image (Fig. s4†) showed that the small alloy particles agglomerated together to form larger clusters after recycling. Hence, the decrease of catalytic activity of PtAu(7
:
1)/TEGO during recycling could be due to the combination of the agglomeration of Pt particles, and the leaching of Au.
Footnote |
† Electronic supplementary information (ESI) available. See DOI: 10.1039/c5ra04048e |
This journal is © The Royal Society of Chemistry 2015 |