DOI:
10.1039/C5RA03966E
(Paper)
RSC Adv., 2015,
5, 41923-41933
The corrosion inhibition effect of aryl pyrazolo pyridines on copper in hydrochloric acid system: computational and electrochemical studies
Received
6th March 2015
, Accepted 17th April 2015
First published on 17th April 2015
Abstract
The inhibition effect of three aryl pyrazole pyridine derivatives, namely, 3-methyl-6-oxo-4,5,6,7-tetrahydro-2H-pyrazolo[3,4-b]pyridine-5-carbonitrile (APP I), 3-methyl-6-oxo-4-(3-phenoxyphenyl)-4,5,6,7-tetrahydro-2H-pyrazolo[3,4-b]pyridine-5-carbonitrile (APP II) and 3-methyl-6-oxo-4-(thiophen-2-yl)-4,5,6,7-tetrahydro-2H-pyrazolo[3,4-b]pyridine-5-carbonitrile (APP III), against the corrosion of copper in 0.5 M HCl solution has been systematically investigated by electrochemical impedance spectroscopy, potentiodynamic polarization measurements and quantum chemical methods. A good correlation between the computed energy gap (ΔE) data and the experimental inhibition efficiencies were found. Potentiodynamic polarization measurement results indicate that all three APP derivatives are cathodic type inhibitors. Among the studied compounds, APP I exhibited the best inhibition activity of 92.3% at 1.59 mmol L−1. Scanning electron microscopy (SEM) and energy-dispersive X-ray (EDX) spectroscopy confirmed the presence of inhibitors on the copper surface.
1. Introduction
Copper is one of the most preferred metals which are used in several industries owing to its high electrical and thermal conductivity, its malleability, and its relatively noble properties.1 In order to prevent the dissolution of copper during the picking and cleaning process, inhibited solutions were used.2,3 A perusal of the literature reveals that heterocyclic compounds such as 1,3,4-thiadiazole, tetrazoles, benzotriazole, azoles and some eco-friendly corrosion inhibitors have been reported to inhibit the corrosion of copper.4–11
Nowadays, various experimental and theoretical techniques have been developed to study the structural properties of inhibitor molecules and their activity towards metal surfaces, but quantum chemical calculations based on density functional theory (DFT) have led to an attractive theoretical method because it gives exact basic vital parameters.12 A quantum chemical approach is adequately sufficient to forecast the inhibitor effectiveness.
Recently, versatile biologically active pyrazolo[3,4-b]pyridines13,14 were used as good corrosion inhibitors for mild steel in hydrochloric acid.15 In the present work, we investigated the three selected aryl pyrazolo[3,4-b]pyridines (APPs), namely, 3-methyl-6-oxo-4,5,6,7-tetrahydro-2H-pyrazolo[3,4-b]pyridine-5-carbonitrile (APP I), 3-methyl-6-oxo-4-(3-phenoxyphenyl)-4,5,6,7-tetrahydro-2H-pyrazolo[3,4-b]pyridine-5-carbonitrile (APP II) and 3-methyl-6-oxo-4-(thiophen-2-yl)-4,5,6,7-tetrahydro-2H-pyrazolo[3,4-b]pyridine-5-carbonitrile (APP III) as corrosion inhibitors for copper in 0.5 M HCl solution. The selection of these compounds is based on the consideration that these compounds contain a good π electron conjugation, an aromatic ring and a heteroatom, enhancing their coordination and adsorption properties and their synthesis has a high atom economy. The inhibition studies of the abovementioned aryl pyrazolo[3,4-b]pyridine derivatives were assured by electrochemical impedance, potentiodynamic polarization and computational methods. The SEM and EDX techniques were also used to examine the surface morphology of copper with and without inhibitors in hydrochloric acid solution.
2. Experimental
2.1 Electrode and solutions
The working electrode, for electrochemical impedance and potentiodynamic polarization studies, was cut from a copper sheet of purity 99.9%. The dimensions of the working electrode were 8 × 1 × 0.025 cm3, and an area of only 1 cm2 was exposed to the electrolyte, whereas the remaining area was insulated with epoxy resin. To remove impurities from the surface, the working electrode was mechanically abraded using different grades (600–1200) of silicon carbide (SiC) abrasive papers, then degreased in acetone, and dried at ambient temperature.16 For each test, a freshly abraded electrode was used. The test solution, 0.5 M HCl, was prepared from 37% hydrochloric acid (Merck) analytical grade chemical and double-distilled water.
2.2 Inhibitors
The inhibitors' synthetic route is given in Fig. 1, and their synthesis is reported elsewhere.17 Melting points were recorded using a Toshniwal apparatus and are uncorrected. The purity of compounds was checked on thin layers of silica gel in various non-aqueous solvent systems e.g. benzene![[thin space (1/6-em)]](https://www.rsc.org/images/entities/char_2009.gif) :
:![[thin space (1/6-em)]](https://www.rsc.org/images/entities/char_2009.gif) ethyl acetate (9
ethyl acetate (9![[thin space (1/6-em)]](https://www.rsc.org/images/entities/char_2009.gif) :
:![[thin space (1/6-em)]](https://www.rsc.org/images/entities/char_2009.gif) 1) and benzene
1) and benzene![[thin space (1/6-em)]](https://www.rsc.org/images/entities/char_2009.gif) :
:![[thin space (1/6-em)]](https://www.rsc.org/images/entities/char_2009.gif) dichloromethane (8
dichloromethane (8![[thin space (1/6-em)]](https://www.rsc.org/images/entities/char_2009.gif) :
:![[thin space (1/6-em)]](https://www.rsc.org/images/entities/char_2009.gif) 2). IR spectra were recorded using a Shimadzu FT IR–8400s spectrophotometer, and 1H NMR and 13C NMR spectra were recorded using a Bruker DRX-300 instrument at 300 and 75 MHz, respectively, in CDCl3 with tetramethylsilane as an internal reference and data is given in Table 1.
2). IR spectra were recorded using a Shimadzu FT IR–8400s spectrophotometer, and 1H NMR and 13C NMR spectra were recorded using a Bruker DRX-300 instrument at 300 and 75 MHz, respectively, in CDCl3 with tetramethylsilane as an internal reference and data is given in Table 1.
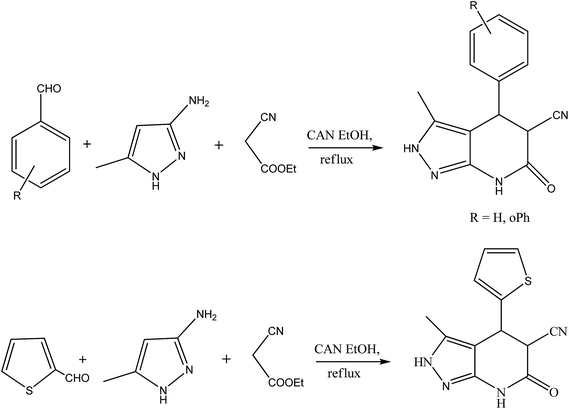 |
| | Fig. 1 Synthetic route of APP derivatives. | |
Table 1 Molecular structure and analytical data for studied organic compounds as inhibitors
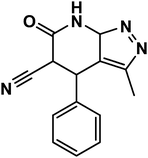 |
3-Methyl-6-oxo-4,5,6,7-tetrahydro-2H-pyrazolo[3,4-b]pyridine-5-carbonitrile (APP I) |
White powder; IR (KBr) cm−1: 3570, 3290, 2240, 1710, 1535; 1H NMR (300 MHz, DMSO-d6) δ: 1.49 (s, 3H, CH3), 4.41 (d, 3J = 12.0 Hz, 1H, CH), 4.65 (d, 3J = 11.7 Hz, 1H, CH), 7.12–7.56 (m, 5H, ArH), 10.96 (s, 1H, NHamid), 11.99 (brs, 1H, NHpyrazole) ppm. 13C NMR (75 MHz, DMSO-d6) δ: 9.95, 36.82, 43.92, 101.05, 117.58, 127.95, 128.66, 130.29, 135.77, 137.76, 147.68, 163.61 ppm |
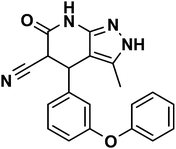 |
3-Methyl-6-oxo-4-(3-phenoxyphenyl)-4,5,6,7-tetrahydro-2H-pyrazolo[3,4-b]pyridine-5-carbonitrile (APP II) |
White powder; IR (KBr) cm−1: 3568, 3284, 2238, 1705, 1542; 1H NMR (300 MHz, DMSO-d6) δ: 1.48 (s, 3H, CH3), 4.50 (d, 3J = 12.0 Hz, 1H, CH), 4.69 (d, 3J = 12.0 Hz, 1H, CH), 7.14–7.63 (m, ArH, 9H), 10.96 (s, 1H, NHamid), 12.00 (brs, 1H, NHpyrazole) ppm. 13C NMR (75 MHz, DMSO-d6) δ: 9.92, 36.61, 43.98, 100.83, 115.91, 116.19, 116.77, 117.54, 129.77, 130.87, 135.69, 135.78, 136.61, 147.62, 160.48, 163.55 ppm |
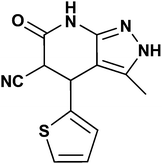 |
3-Methyl-6-oxo-4-(thiophen-2-yl)-4,5,6,7-tetrahydro-2H-pyrazolo[3,4-b]pyridine-5-carbonitrile (APP III) |
White crystalline solid; IR (KBr) cm−1: 3570, 3282, 2248, 1716, 1534; 1H NMR (300 MHz, DMSO-d6) δ: 2.07 (s, 3H, CH3), 4.38 (d, 3J = 12.0 Hz, 1H, CH), 4.64 (d, 3J = 11.7 Hz, 1H, CH), 6.97–7.51 (m, ArH, 3H), 10.99 (s, 1H, NHamid), 12.10 (brs, 1H, NHpyrazole) ppm. 13C NMR (75 MHz, DMSO-d6) δ: 10.01, 35.54, 42.39, 101.96, 117.07, 125.96, 126.21, 127.73, 135.07, 142.66, 146.84, 162.52 ppm |
2.3 Electrochemical measurements
Impedance measurements were carried out using a Gamry Potentiostat/Galvanostat electrochemical workstation with a Gamry framework based on ESA400 with a classical three-electrode cell assembly. In this cell, the bare copper specimen served as the working electrode, and a platinum electrode and a saturated calomel electrode (SCE) were used as counter and reference electrodes, respectively. Impedance measurements were carried out at the open-circuit potential in the frequency range from 100 kHz to 10 MHz, with a signal amplitude perturbation of 10 mV, and Nyquist plots were obtained.
Potentiodynamic polarization studies were carried out using the same electrochemical workstation and the cell assembly used for impedance studies. The polarization curves were recorded in the potential range from −250 to +250 mV vs. corrosion potential at a scan rate of 1 mV s−1. For each experiment, a newly prepared electrode and the test solution were used. Prior to the impedance and potentiodynamic polarization measurements, the working electrode was immersed in 0.5 M HCl with and without the addition of inhibitor for 2 h for the stabilization of open circuit potential (OCP) w.r.t. SCE at the ambient temperature. All electrochemical data were assessed by Echem Analyst version 6.03 software packages.
2.4 Cyclic voltammetric studies
Cyclic voltammetry was carried out for the bare copper electrode and the inhibitor-covered electrode in the test solution. The working electrode was scanned from negative to positive in the potential range of −0.4 to 0.4 V at a scan rate of 20 mV s−1.
2.5 Quantum chemical calculations
Quantum chemical calculations using density functional theory (DFT) at the B3LYP/6-31G++ (d, p) basis set level with the Gaussian 03 package were applied to elucidate the structure–activity relationships of all APPs. The geometry of all compounds under investigation was determined by optimizing all geometrical variables without any symmetry constraints. These calculations give values for the energy of the highest occupied molecular orbital (EHOMO), the energy of the lowest unoccupied molecular orbital (ELUMO), the energy gap (ELUMO–EHOMO), ΔE, representing the function of reactivity, the Mulliken charge, the dipole moment, and the μ of the inhibitor molecule of interest.
2.6 Surface morphology
The SEM images were recorded to ascertain the interactions of the inhibitor molecules with the metal surface. The copper specimens of size 2.5 × 2 × 0.025 cm were immersed in 0.5 M HCl in the absence and in the presence of 1.59 mmol L−1 of APP I for 72 h. Thereafter, the copper specimens were taken out, washed with distilled water, degreased with acetone, dried at ambient temperature, and mechanically cut into 1 cm2 sizes for SEM and EDX investigations. Morphological illustrations were taken through an SEM model FEI Quanta 200F microscope at an accelerating voltage of 20 kV at 100× magnification.
3. Results and discussion
3.1 Electrochemical studies
3.1.1 Electrochemical impedance spectroscopy (EIS) studies. The Nyquist plots are represented in Fig. 2a–c for copper with and without various concentrations of APPs in 0.5 M HCl. The Nyquist plots for copper showed two capacitive loops over the frequency range studied.18 The experimental impedance data were appraised by fitting the equivalent circuit model shown in Fig. 3. This model consists of two time constants in series with the uncompensated resistance Rs. A large part of Rs comes from solution resistance. In the first time constant, Rct describes the charge transfer resistance of copper dissolution, between the metal and the OHP (outer Helmholtz plane) to the metal–solution interface, in the high frequency region. Moreover, Qdl represents the first constant phase element (CPE), for a double layer capacitor on the metal–solution interface. In the second time constant, Qf symbolizes the CPE of the surface layer (as in a very thin coating), Rf is the resistance of soluble corrosion products or the ion conducting paths that developed in the surface layer and W is the Warburg element for the semi-infinite (unrestricted) layer thickness diffusion.19
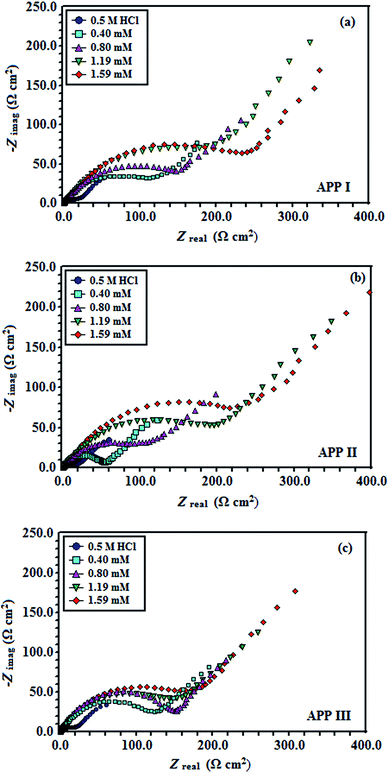 |
| | Fig. 2 Nyquist plots for copper in 0.5 M HCl containing different concentrations of (a) APP I, (b) APP II and (c) APP III. | |
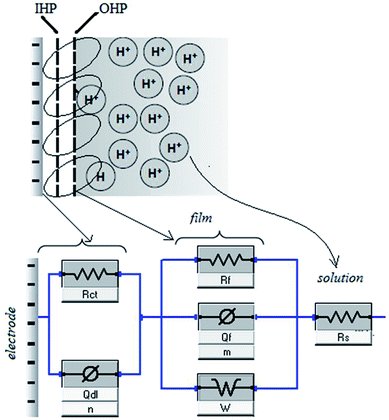 |
| | Fig. 3 Equivalent circuit model used to fit the impedance spectra. | |
The impedance of the CPE is described as:20,21
where
Q is a proportionality factor and is frequency independent,
i is the imaginary number (
i2 = −1),
ω is the angular frequency (
ω = 2π
f), and
n is a CPE exponent.
Thus the impedance of the first time constant is as follows:
| |
 | (2) |
The impedance of the second time constant, including semi-infinite diffusion is as follows:
| |
 | (3) |
and the total impedance for the model is defined as follows:
| |
 | (4) |
An excellent fit with this model was obtained for all experimental data. As an example, the Nyquist plots for the free acid solution and the optimum concentration of all inhibitors are presented in Fig. 4. The fitting procedure gave the results of inhibition efficiencies and other impedance parameters, which are compiled in Table 2. From Table 2, the first (CPE), Qdl, having low values for the inhibited solution compared to the non-inhibited solution is usually explained by the displacement of water molecules from the surface due to the adsorption of inhibitor molecules. Moreover, changes in n-values (from 0.58–0.83) are also attributed to adsorption of inhibitor molecules and formation of porous layers.22 The values of Rct increase when the APPs concentration increases, consequently giving a decrease in the corrosion rate. The inhibition efficiency (η%) of the inhibitor was estimated by equating the values of charge transfer resistance in the absence (R0ct) and presence (Rict) of inhibitor as follows:
| |
 | (5) |
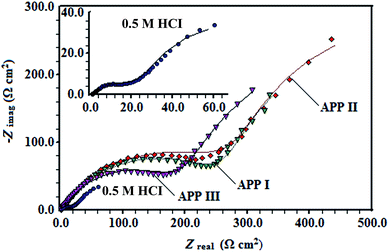 |
| | Fig. 4 Simulated (solid curves) and experimentally (dotted curves) Nyquist plots in the absence and presence of 1.59 mmol L−1 of APP I, APP II, and APP III. | |
Table 2 Electrochemical impedance parameters accomplished by fitting the Nyquist plots with the equivalent circuit (Fig. 3) in the absence and presence of various concentrations of APP I, APP II and APP III
| Conc. of inhibitor (mmol L−1) |
Rs (Ω cm−2) |
Qdl |
Rct (Ω cm−2) |
Qf |
Rf Ω (× 108) |
W (× 10−2) (Ω−1 s1/2 cm−2) |
Inhibition efficiency (η%) |
| Yo × 10−3 (Ω−1 sn cm−2) |
n |
Yo × 10−8 (Ω−1 sn cm−2) |
m |
| Blank |
1.14 |
8.25 |
0.58 |
17.9 |
0.069 |
0.44 |
0.000116 |
8.54 |
|
![[thin space (1/6-em)]](https://www.rsc.org/images/entities/char_2009.gif) |
| APP I |
| 0.40 |
0.96 |
3.71 |
0.61 |
125.4 |
0.794 |
0.43 |
1.48 |
4.96 |
85.7 |
| 0.80 |
0.76 |
2.29 |
0.78 |
148.0 |
0.017 |
0.45 |
3.03 |
3.39 |
87.9 |
| 1.19 |
1.12 |
2.04 |
0.81 |
170.5 |
4.540 |
0.46 |
7.98 |
1.48 |
89.5 |
| 1.59 |
1.11 |
1.39 |
0.82 |
225.2 |
3.850 |
0.47 |
25.9 |
2.18 |
92.0 |
![[thin space (1/6-em)]](https://www.rsc.org/images/entities/char_2009.gif) |
| APP II |
| 0.40 |
1.03 |
1.79 |
0.59 |
52.7 |
0.821 |
0.44 |
0.56 |
5.23 |
65.9 |
| 0.80 |
0.94 |
3.20 |
0.74 |
114.5 |
0.482 |
0.45 |
1.41 |
3.80 |
84.3 |
| 1.19 |
0.89 |
1.15 |
0.79 |
183.4 |
0.164 |
0.45 |
4.33 |
1.79 |
90.2 |
| 1.59 |
0.98 |
1.49 |
0.83 |
220.2 |
0.175 |
0.46 |
6.08 |
1.38 |
91.8 |
![[thin space (1/6-em)]](https://www.rsc.org/images/entities/char_2009.gif) |
| APP III |
| 0.40 |
0.57 |
1.22 |
0.66 |
119.8 |
2.350 |
0.52 |
33.4 |
3.91 |
85.0 |
| 0.80 |
0.73 |
1.70 |
0.69 |
144.9 |
2.680 |
0.52 |
11.0 |
2.26 |
87.6 |
| 1.19 |
0.82 |
1.47 |
0.73 |
158.4 |
5.274 |
0.49 |
54.0 |
1.89 |
88.7 |
| 1.59 |
0.98 |
1.79 |
0.79 |
210.9 |
4.620 |
0.58 |
8.13 |
1.39 |
91.5 |
The order of the inhibition efficiency is APP I > APP II > APP III, and the maximum inhibition efficiency is 92.0% for APP I. The second CPE, Qf, is almost like the Warburg impedance, suggesting the close and denser surface layer is formed on the copper surface.23 This was confirmed by the higher Rf values (Table 2) in the presence of inhibitors rather than blank solution.
Fig. 5a–c show Bode phase plots ad also denotes two time constants for the same data pictured in the Nyquist plots. In the Bode plot, log![[thin space (1/6-em)]](https://www.rsc.org/images/entities/char_2009.gif) |Z| and phase angle (α) are plotted against log
|Z| and phase angle (α) are plotted against log![[thin space (1/6-em)]](https://www.rsc.org/images/entities/char_2009.gif) f shown in three distinct divisions. At the highest frequency region (f = 100 kHz), log
f shown in three distinct divisions. At the highest frequency region (f = 100 kHz), log![[thin space (1/6-em)]](https://www.rsc.org/images/entities/char_2009.gif) |Z| vs. log
|Z| vs. log![[thin space (1/6-em)]](https://www.rsc.org/images/entities/char_2009.gif) f can be read from the horizontal plateau and the phase angle tends to (0°) in this frequency range. This is a behaviour of typical ohmic resistor and counterpart to an uncompensated resistance Rs, and thus for large values of f, |Z| → Rs as f → ∞.23 At the second segment at intermediate frequencies, log
f can be read from the horizontal plateau and the phase angle tends to (0°) in this frequency range. This is a behaviour of typical ohmic resistor and counterpart to an uncompensated resistance Rs, and thus for large values of f, |Z| → Rs as f → ∞.23 At the second segment at intermediate frequencies, log![[thin space (1/6-em)]](https://www.rsc.org/images/entities/char_2009.gif) |Z| vs. log
|Z| vs. log![[thin space (1/6-em)]](https://www.rsc.org/images/entities/char_2009.gif) f with slope values (S) 0.38–0.53 and the phase angle values for blank solution 0.5 M HCl (−33.0), APP I (−48.58), APP II (−47) and APP III (−52.14) at 1.59 mmol L−1 are observed. The gradual approach of α towards the ideal capacitive value (−90), on addition of APPs, may be associated with the slowing down of the rate of dissolution of copper, which suggests the formation of a protective layer.24,25 A third segment exhibits a horizontal plateau in the low f region, where |Z| → Rs + Rct + Rf as f → 0 where log
f with slope values (S) 0.38–0.53 and the phase angle values for blank solution 0.5 M HCl (−33.0), APP I (−48.58), APP II (−47) and APP III (−52.14) at 1.59 mmol L−1 are observed. The gradual approach of α towards the ideal capacitive value (−90), on addition of APPs, may be associated with the slowing down of the rate of dissolution of copper, which suggests the formation of a protective layer.24,25 A third segment exhibits a horizontal plateau in the low f region, where |Z| → Rs + Rct + Rf as f → 0 where log![[thin space (1/6-em)]](https://www.rsc.org/images/entities/char_2009.gif) |Z| is almost independent of frequency. These |Z| values for the inhibited solution are higher than for the uninhibited solution, implying the protection of copper. Thus, the Bode-phase plots are consistent with Nyquist results.
|Z| is almost independent of frequency. These |Z| values for the inhibited solution are higher than for the uninhibited solution, implying the protection of copper. Thus, the Bode-phase plots are consistent with Nyquist results.
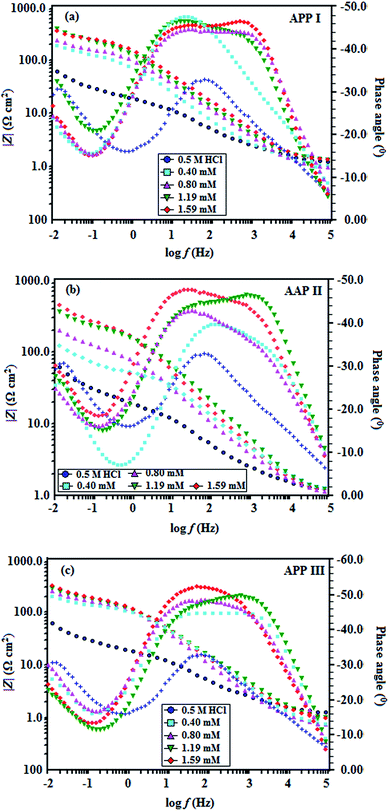 |
| | Fig. 5 Phase-impedance plots for copper in 0.5 M HCl in the absence and presence of different concentrations of (a) APP I, (b) APP II and (c) APP III. | |
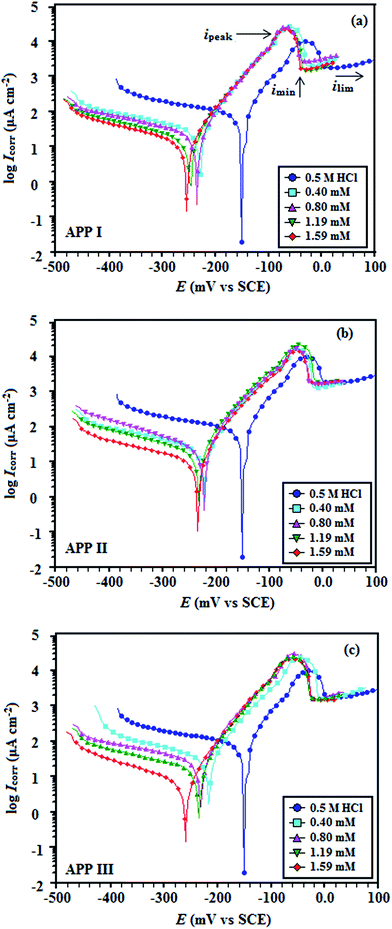
3.1.2 Potentiodynamic polarization measurements. The potentiodynamic polarization curves for copper in 0.5 M HCl, in the absence and presence of the APPs, are illustrated in Fig. 6a–c. The calculated electrochemical parameters, corrosion potential (Ecorr), potential at which hydrogen evolution starts (EH2), anodic (βa) and cathodic (βc) Tafel slopes, corrosion current density (Icorr), current densities  at hydrogen evolution potentials and inhibition efficiency (η%) are calculated and given in Table 3. It is clearly seen from Table 3 that the values of Icorr decreased and the η% increased in the presence of APPs. This effect significantly increased with increasing concentrations of APP and attained a maximum inhibition (92.3%) at 1.59 mmol L−1 for APP I. The inhibition efficiency was calculated from the equation:
| |
 | (6) |
where, I0corr and Iicorr are the corrosion current density in the absence and in the presence of inhibitor, respectively. The calculating anodic (βa) and cathodic (βc) Tafel slopes are also higher in the presence of inhibitor compared those in the absence of inhibitor. Furthermore, the cathodic Tafel slope changes considerably and there is only a small change in the anodic Tafel slope for the inhibited system. This suggests that during the process of inhibition, the inhibitor predominantly controls the cathodic reaction.26 A shift in corrosion potential (Ecorr) values in the negative direction also indicates that APPs preferentially inhibit the cathodic reaction.27 From these data one can recognize a distinctly higher inhibition acquired, among the APPs, for a concentration of 1.59 mmol L−1 and can rank them as follows: APP I > APP II > APP III.
 |
| | Fig. 6 Potentiodynamic polarization curves for copper in 0.5 M HCl containing different concentrations of (a) APP I, (b) APP II and (c) APP III. | |
Table 3 Potentiodynamic polarization measurements parameters: in the absence and presence of various concentrations of APPs (I–III) for copper in 0.5 M HCl
In order to explain the potentiodynamic measurements results, various mechanism steps are considered, which are extensively discussed in the literature.28 The unambiguous division of the anodic curves into three regions have been reported previously.29 From the Fig. 6, for inhibitor-free solution, it is observed that in the first region, there is an increase of anodic current, starting from Eocp, with increase at a lower over-potential and extending to the potential (−30.77 mV) of the peak current density (ipeak = 8700 μA) due to the fast dissolution of Cu(0) into Cu+ (eqn (7)). In the second region, the peak current density
| | |
Cu+ → Cu2+ + e− (slow)
| (8) |
decreases until a minimum current (
imin = 2000 μA) is reached (having a potential of −0.066 mV) due to slow oxidation of Cu
+ to Cu
2+; this results in the formation of CuCl, (
eqn (9)), since Cu
+ reacts faster with Cl
− than Cu
2+ does. Finally, there is a third region of sudden increase
in current density at more positive potentials, leading to a limiting current value (
ilim) as a result of CuCl
2− formation (
eqn (10)), which is responsible for copper corrosion due to its dissolution into the bulk solution and/or its further oxidation to Cu
2+ (
eqn (12)).
30| | |
CuCl2− (surface) → CuCl2− (solution)
| (11) |
| | |
CuCl2− (solution) ↔ Cu2+ + 2Cl− + e−
| (12) |
On this ground, the anodic curves are characterized by a quasi-Tafelian behavior, i.e. the anodic copper dissolution is not solely activation-controlled, but is under the control of both the diffusion of CuCl2− from the outer Helmholtz plane and the electro-dissolution of copper to the solution bulk.23
In the evaluation of the cathodic branch of the current potential curves in Fig. 6, the cathodic current density increases up to ∼−162.4 mV (SCE) due to the oxygen diffusion in inhibitor free solution. After that, current plateaus are observed between ∼−162.4 mV and ∼−372.1 mV (SCE), which are attributed to the diffusion controlled reduction of dissolved oxygen. In the presence of inhibitor molecules in the 0.5 M HCl, the diffusion-limited current density of oxygen decreases and the potential shifts in a more negative direction, as shown in Fig. 6a–c and in Table 3. This trend becomes more pronounced with increasing inhibitor concentration. At the hydrogen gas evolution potential, these results suggest that the inhibitors form a protective surface film on the metal surfaces and inhibit the reduction of oxygen.31,32 These results indicate that the APPs have a stronger influence on the oxygen reduction reaction than on the Cu oxidation reaction. The cathodic reaction is the four-electron reduction of dissolved O2 according to the following reaction:
| | |
O2 + 2H2O + 4e− ↔ 4OH−
| (13) |
On the whole, it is observed that addition of APPs affects both the anodic and the cathodic parts of the curves, but the cathodic reaction is inhibited to a greater extent and named as cathodic type inhibitors.
3.2 Cyclic voltammetric study
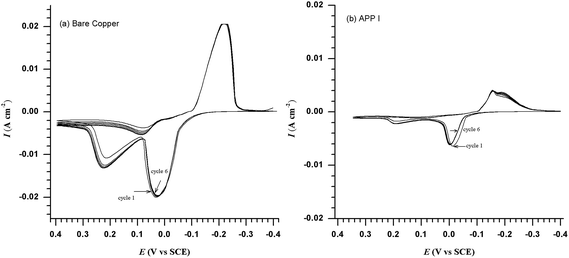
The cyclic voltammograms for a copper electrode in blank and APP I (1.59 mmol L−1) inhibited test solution are shown in Fig. 7. It can be observed from the curves that there are two anodic current peaks and one cathodic peak in the blank solution.33 The first oxidation peak shows that the anodic dissolution of copper occurs by reaction (7). Consequently, the second oxidation peak is related to the conversion of Cu+ to soluble Cu2+ by reaction (12). In a reverse sweep, on one hand, the corrosion product of CuCl can be partially reduced as described in reaction (9); as a result, the concentration of Cl− at the interface of the copper and salt layers increases, which leads to a fast dissolution of copper by reaction (7). On the other hand, the corrosion process would be restrained to a certain extent by the increase in the salt layer. Because of the competition between dissolution and precipitation of the film on copper, an anodic current hump appears in the CV plot on the reverse sweep.34 The stabilities of the bare copper and the APP I coated electrode have been examined by cyclic voltammetry. Investigation indicates that the peak current and the peak potential of the bare and the APP I coated electrode have remained nearly unchanged after 6 cycles with a scan rate of 20 mV s−1. Another observed key point is that the presence of APP I causes a decrease in the current density of the first anodic peak. This indicates that APP I can effectively inhibit the Cu+ oxidation. Moreover, the decrease in the anodic currents of the inhibitors are a result of the decreased chloride ion attack on the copper surface due to inhibitor molecule adsorption. The second anodic peaks diminish, and this indicates that APP I can effectively inhibit the Cu+ oxidation to soluble Cu2+. On this basis, this confirms that APPs are effective inhibitors for copper.
 |
| | Fig. 7 Cyclic voltammograms for copper obtained in 0.5 M HCl (a) bare copper and (b) 1.59 mmol of APP I in solution. | |
3.3 Quantum calculation
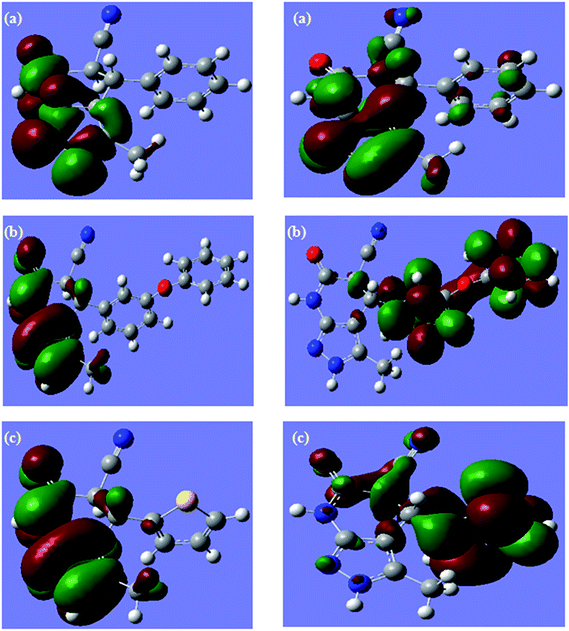
Quantum chemical calculations are used only to correlate the experimentally classified inhibition efficiency with different methods, and therefore, the neutral inhibitor molecules are under investigation. Geometrical optimizations of APP I, APP II, and APP III using the DFT/B3LYP/6-31G++ (d, p) basis set35 are depicted in Fig. 8a–c. The Frontier molecular orbital (FMO) density distributions of three APPs are presented in Fig. 9a–c. Quantum chemical parameters obtained from the calculations, which are responsible for the inhibition efficiency of inhibitors, such as the energy of the highest occupied molecular orbital (EHOMO), the energy of the lowest unoccupied molecular orbital (ELUMO), the energy gap (ELUMO–EHOMO), ΔE, the Mulliken charge, and the dipole moment, μ, which are collected in Table 4. It is clear from Table 4 that the values of EHOMO and ELUMO change in an irregular manner, whereas the values of ELUMO–EHOMO are in good correlation with experimental inhibition efficiencies. According to the hard–soft-acid–base (HSAB) principle, the bonding tendencies of the inhibitors towards the metal atom follow the general rule that hard acids prefer to co-ordinate to hard bases and soft acids prefer to co-ordinate to soft bases. By the same token, metal atoms are acknowledged as soft acids. Hard molecules have a high ELUMO–EHOMO gap and soft molecules have a small ELUMO–EHOMO gap,36 and thus soft base inhibitors are the most effective for metals. Therefore, the APP I compound, which has the lowest energy gap (ΔE) and the highest softness, has the highest inhibition efficiency.
 |
| | Fig. 8 Optimized molecular structures (a) APP I, (b) APP II and (c) APP III. | |
 |
| | Fig. 9 Frontier molecular orbital density distribution of (a) APP I, (b) APP II and (c) APP III. | |
Table 4 Quantum chemical parameters of APP I, APP II and APP III
| Inhibitors |
EHOMO |
ELUMO |
ΔE |
Mulliken charges |
| N6 |
N7 |
N8 |
N11 |
O18 |
O25 |
| APP I |
−6.9131 |
−2.3135 |
4.599 |
−0.5310 |
−0.2263 |
−0.1845 |
−0.4602 |
−0.4755 |
— |
| APP II |
−6.1280 |
−0.6130 |
5.514 |
−0.6254 |
−0.3911 |
−0.3946 |
−0.4712 |
−0.5727 |
−0.4745 |
| APP III |
−6.3337 |
−0.7491 |
5.584 |
−0.6238 |
−0.3862 |
−0.3904 |
−0.4706 |
−0.4730 |
— |
To judge the adsorption centres in an inhibitor molecule for the interaction with metal surfaces, the Mulliken charge and the dipole moment (μ) were also calculated. Mulliken population analysis establishes that the more negatively charged heteroatoms are the reactive sites36 and these are labelled as N6, N7, N8, N11, N18, and O25 in the ring of pyrazole pyridine derivatives and are shown in Table 4. For the dipole moment (μ), some authors are in favor of low values37 of the dipole moment and others favor high values38,39 on the basis of the dipole–dipole interaction between molecules and metal surfaces. In the present case, a lower value of μ obtained for APP I indicates a stronger interaction with the metallic surface in comparison with other APPs.
3.4 Scanning electron microscopy analysis
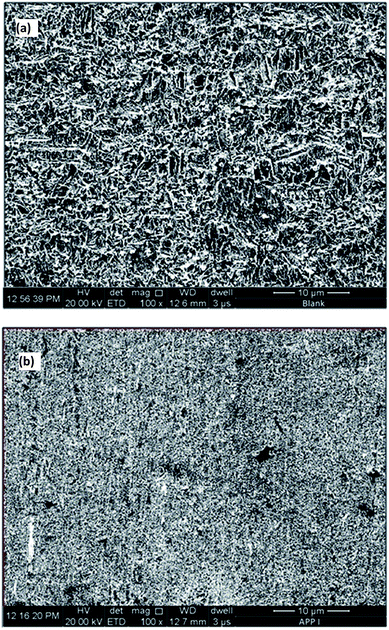
The SEM micrographs for copper in the absence and in the presence of the optimum concentration of APP I, after immersion in 0.5 M HCl for 72 h, are represented in Fig. 10a and b, respectively. It appears that the specimen surface was highly deteriorated, with some pits and cracks under inhibitor-free conditions (Fig. 10a). The corresponding EDX profile (Fig. 11a) has no oxygen peak, which indicates the breakdown of the air-formed oxide film, resulting in free corrosion of bare copper. On the other hand, it is clearly seen in Fig. 10b that corrosive attack has been suppressed successfully in the presence of 1.59 mmol L−1 APP I. The less damaged surface indicates the creation of a physical barrier of adsorbed inhibitors between the metal and the corrosive environment. According to the EDX analysis (Fig. 11b), an extra nitrogen peak was also present. Even though its intensity is very low, it is evidence for the role of nitrogen atoms for binding to copper surface. These EDX results prove that the APPs are effective corrosion inhibitors for copper in HCl.
 |
| | Fig. 10 SEM micrographs of copper surfaces: (a) uninhibited 0.5 M HCl and (b) in the presence of APP I. | |
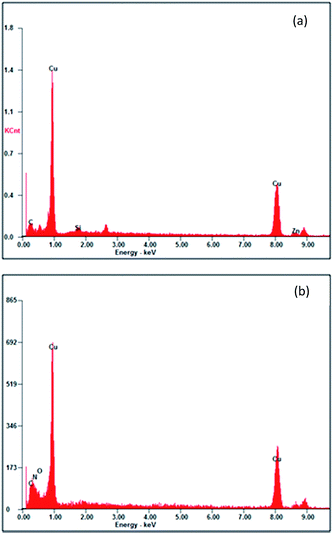 |
| | Fig. 11 EDX spectra of copper specimens: (a) uninhibited 0.5 M HCl and (b) in the presence of APP I. | |
4. Conclusions
This study has revealed that APPs are good inhibitors of copper corrosion in 0.5 M HCl solutions. The order of inhibition efficiency is APP I > APP II > APP III at the optimum concentration and the maximum inhibition efficiency for APP I is 92.3%. Polarization measurements show that APPs are cathodic type inhibitors and results indicate that inhibitors have a stronger influence on the oxygen reduction than on the Cu oxidation reaction. The impedance response in the low frequency range revealed film formation and a diffusion controlled process at the copper–solution interface. In addition, SEM and EDX studies of the copper surface indicate that the corrosion reaction was inhibited by adsorption of the APPs on the corroding copper surface. A good correlation has been found between a quantum chemical approach and experimentally obtained inhibition efficiencies.
Acknowledgements
Sudheer expresses his deep thanks to the Department of Chemistry, Indian Institute of Technology (Banaras Hindu University), Varanasi, India, for financial support under the Teaching Assistantship scheme.
References
- M. G. Fontana, Corrosion Engineering, Mc Graw-Hill International, New York, 1987 Search PubMed.
- M. M. El-Naggar, Corros. Sci., 2000, 42, 773 CrossRef CAS.
- H. Ma, S. Chen, B. Yin, S. Zhao and X. Liu, Corros. Sci., 2003, 45, 867 CrossRef CAS.
- E. M. Sherif and S.-M. Park, Electrochim. Acta, 2006, 51, 6556 CrossRef CAS PubMed.
- E.-S. M. Sherif, R. M. Erasmus and J. D. Comins, Corros. Sci., 2008, 50, 3439 CrossRef CAS PubMed.
- K. F. Khaled, Electrochim. Acta, 2009, 54, 4345 CrossRef CAS PubMed.
- M. M. Antonijević, S. M. Milić and M. B. Petrović, Corros. Sci., 2009, 51, 1228 CrossRef PubMed.
- M. S. El-Deab, Mater. Chem. Phys., 2011, 129, 223 CrossRef CAS PubMed.
- H. Tian, W. Li, K. Cao and B. Hou, Corros. Sci., 2013, 73, 281 CrossRef CAS PubMed.
- P. Wang, D. Zhang, R. Qiu, Y. Wan and J. Wu, Corros. Sci., 2014, 80, 366 CrossRef CAS PubMed.
- K. Krishnaveni and J. Ravichandran, J. Electroanal. Chem., 2014, 735, 24 CrossRef CAS PubMed.
- A. Ehsani, M. G. Mahjani, R. Moshrefi, H. Mostaanzadeh and J. S. Shayeh, RSC Adv., 2014, 4, 20031 RSC.
- H. Ma, S. Chen, L. Niu, S. Zhao, S. Li and D. Li, J. Appl. Electrochem., 2002, 32, 65 CrossRef CAS.
- T. M. Fong and S. B. Heymsfield, Int. J. Obes., 2009, 33, 947 CrossRef CAS PubMed.
- A. Dandia, S. L. Gupta, P. Singh and M. A. Quraishi, ACS Sustainable Chem. Eng., 2013, 1, 1303 CrossRef CAS.
- D. K. Yadav, D. S. Chauhan, I. Ahamad and M. A. Quraishi, RSC Adv., 2013, 3, 632 RSC.
- A. Rahmati, Tetrahedron Lett., 2010, 51, 2967 CrossRef CAS PubMed.
- K. F. Khaled, Corros. Sci., 2010, 52, 3225 CrossRef CAS PubMed.
- R. Solmaz, E. Altunbaş Şahin, A. Döner and G. Kardaş, Corros. Sci., 2011, 53, 3231 CrossRef CAS PubMed.
- E.-S. Sherif, J. Solid State Electrochem., 2012, 16, 891 CrossRef CAS PubMed.
- D. K. Yadav and M. A. Quraishi, Ind. Eng. Chem. Res., 2012, 51, 1496 Search PubMed.
- W. Deng, P. Lin, Q. Li and G. Mo, Corros. Sci., 2013, 74, 44 CrossRef CAS PubMed.
- M. Finšgar, Corros. Sci., 2013, 68, 51 CrossRef PubMed.
- F. Caprioli, A. Martinelli, V. Di Castro and F. Decker, J. Electroanal. Chem., 2013, 693, 86 CrossRef CAS PubMed.
- M. Finšgar and D. K. Merl, Corros. Sci., 2014, 80, 82 CrossRef PubMed.
- A. Yurt and G. Bereket, Ind. Eng. Chem. Res., 2011, 50, 8073 CrossRef CAS.
- Y.-C. Pan, Y. Wen, L.-Y. Xue, X.-Y. Guo and H.-F. Yang, J. Phys. Chem. C, 2012, 116, 3532 CAS.
- E.-S. Sherif, J. Solid State Electrochem., 2012, 16, 891 CrossRef CAS PubMed.
- Sudheer and M. A. Quraishi, Corros. Sci., 2013, 70, 161 CrossRef CAS PubMed.
- E.-S. M. Sherif, J. Ind. Eng. Chem., 2013, 19, 1884–1889 CrossRef CAS PubMed.
- P. Song, X.-Y. Guo, Y.-C. Pan, S. Shen, Y. Sun and Y. Wen, et al., Electrochim. Acta, 2013, 89, 503 CrossRef CAS PubMed.
- A. Döner, A. O. Yüce and G. Kardaş, Ind. Eng. Chem. Res., 2013, 52, 9709 CrossRef.
- S. Zor, M. Saracoglu, F. Kandemirli and T. Arslan, Corrosion, 2011, 67, 125003 CrossRef.
- S. Issaadi, T. Douadi and S. Chafaa, Appl. Surf. Sci., 2014, 316, 582 CrossRef CAS PubMed.
- M. J. Frisch, G. W. Trucks, H. B. Schlegel, G. E. Scuseria, M. A. Robb, J. R. Cheeseman, J. A. Montgomery Jr, T. Vreven, K. N. Kudin, J. C. Burant, J. M. Millam, S. S. Iyengar, J. Tomasi, V. Barone, B. Mennucci, M. Cossi, G. Scalmani, N. Rega, G. A. Petersson, H. Nakatsuji, M. Hada, M. Ehara, K. Toyota, R. Fukuda, J. Hasegawa, M. Ishida, T. Nakajima, Y. Honda, O. Kitao, H. Nakai, M. Klene, X. Li, J. E. Knox, H. P. Hratchian, J. B. Cross, C. Adamo, J. Jaramillo, R. Gomperts, R. E. Stratmann, O. Yazyev, A. J. Austin, R. Cammi, C. Pomelli, J. W. Ochterski, P. Y. Ayala, K. Morokuma, G. A. Voth, P. Salvador, J. J. Dannenberg, V. G. Zakrzewski, S. Dapprich, A. D. Daniels, M. C. Strain, O. Farkas, D. K. Malick, A. D. Rabuck, K. Raghavachari, J. B. Foresman, J. V. Ortiz, Q. Cui, A. G. Baboul, S. Clifford, J. Cioslowski, B. B. Stefanov, G. Liu, A. Liashenko, P. Piskorz, I. Komaromi, R. L. Martin, D. J. Fox, T. Keith, M. A. Al-Laham, C. Y. Peng, A. Nanayakkara, M. Challacombe, P. M. W. Gill, B. Johnson, W. Chen, M. W. Wong, C. Gonzalez and J. A. Pople, Gaussian 03, Revision C.02, Gaussian, Inc., Wallingford CT, 2007 Search PubMed.
- G. Gece, Corros. Sci., 2008, 50, 2981 CrossRef CAS PubMed.
- M. Mahdavian and S. Ashhari, Electrochim. Acta, 2010, 55, 1720 CrossRef CAS PubMed.
- M. K. Awad, M. R. Mustafa and M. M. Abo Elnga, J. Mol. Struct.: THEOCHEM, 2010, 959, 66 CrossRef CAS PubMed.
- V. S. Sastri, Corrosion Inhibition Mechanisms, in Green Corrosion Inhibitors, John Wiley & Sons, Inc., 2011, pp. 167–211 Search PubMed.
|
| This journal is © The Royal Society of Chemistry 2015 |
Click here to see how this site uses Cookies. View our privacy policy here. ![[thin space (1/6-em)]](https://www.rsc.org/images/entities/char_2009.gif) :
:![[thin space (1/6-em)]](https://www.rsc.org/images/entities/char_2009.gif) ethyl acetate (9
ethyl acetate (9![[thin space (1/6-em)]](https://www.rsc.org/images/entities/char_2009.gif) :
:![[thin space (1/6-em)]](https://www.rsc.org/images/entities/char_2009.gif) 1) and benzene
1) and benzene![[thin space (1/6-em)]](https://www.rsc.org/images/entities/char_2009.gif) :
:![[thin space (1/6-em)]](https://www.rsc.org/images/entities/char_2009.gif) dichloromethane (8
dichloromethane (8![[thin space (1/6-em)]](https://www.rsc.org/images/entities/char_2009.gif) :
:![[thin space (1/6-em)]](https://www.rsc.org/images/entities/char_2009.gif) 2). IR spectra were recorded using a Shimadzu FT IR–8400s spectrophotometer, and 1H NMR and 13C NMR spectra were recorded using a Bruker DRX-300 instrument at 300 and 75 MHz, respectively, in CDCl3 with tetramethylsilane as an internal reference and data is given in Table 1.
2). IR spectra were recorded using a Shimadzu FT IR–8400s spectrophotometer, and 1H NMR and 13C NMR spectra were recorded using a Bruker DRX-300 instrument at 300 and 75 MHz, respectively, in CDCl3 with tetramethylsilane as an internal reference and data is given in Table 1.


![[thin space (1/6-em)]](https://www.rsc.org/images/entities/char_2009.gif)
![[thin space (1/6-em)]](https://www.rsc.org/images/entities/char_2009.gif)
![[thin space (1/6-em)]](https://www.rsc.org/images/entities/char_2009.gif)
![[thin space (1/6-em)]](https://www.rsc.org/images/entities/char_2009.gif) |Z| and phase angle (α) are plotted against log
|Z| and phase angle (α) are plotted against log![[thin space (1/6-em)]](https://www.rsc.org/images/entities/char_2009.gif) f shown in three distinct divisions. At the highest frequency region (f = 100 kHz), log
f shown in three distinct divisions. At the highest frequency region (f = 100 kHz), log![[thin space (1/6-em)]](https://www.rsc.org/images/entities/char_2009.gif) |Z| vs. log
|Z| vs. log![[thin space (1/6-em)]](https://www.rsc.org/images/entities/char_2009.gif) f can be read from the horizontal plateau and the phase angle tends to (0°) in this frequency range. This is a behaviour of typical ohmic resistor and counterpart to an uncompensated resistance Rs, and thus for large values of f, |Z| → Rs as f → ∞.23 At the second segment at intermediate frequencies, log
f can be read from the horizontal plateau and the phase angle tends to (0°) in this frequency range. This is a behaviour of typical ohmic resistor and counterpart to an uncompensated resistance Rs, and thus for large values of f, |Z| → Rs as f → ∞.23 At the second segment at intermediate frequencies, log![[thin space (1/6-em)]](https://www.rsc.org/images/entities/char_2009.gif) |Z| vs. log
|Z| vs. log![[thin space (1/6-em)]](https://www.rsc.org/images/entities/char_2009.gif) f with slope values (S) 0.38–0.53 and the phase angle values for blank solution 0.5 M HCl (−33.0), APP I (−48.58), APP II (−47) and APP III (−52.14) at 1.59 mmol L−1 are observed. The gradual approach of α towards the ideal capacitive value (−90), on addition of APPs, may be associated with the slowing down of the rate of dissolution of copper, which suggests the formation of a protective layer.24,25 A third segment exhibits a horizontal plateau in the low f region, where |Z| → Rs + Rct + Rf as f → 0 where log
f with slope values (S) 0.38–0.53 and the phase angle values for blank solution 0.5 M HCl (−33.0), APP I (−48.58), APP II (−47) and APP III (−52.14) at 1.59 mmol L−1 are observed. The gradual approach of α towards the ideal capacitive value (−90), on addition of APPs, may be associated with the slowing down of the rate of dissolution of copper, which suggests the formation of a protective layer.24,25 A third segment exhibits a horizontal plateau in the low f region, where |Z| → Rs + Rct + Rf as f → 0 where log![[thin space (1/6-em)]](https://www.rsc.org/images/entities/char_2009.gif) |Z| is almost independent of frequency. These |Z| values for the inhibited solution are higher than for the uninhibited solution, implying the protection of copper. Thus, the Bode-phase plots are consistent with Nyquist results.
|Z| is almost independent of frequency. These |Z| values for the inhibited solution are higher than for the uninhibited solution, implying the protection of copper. Thus, the Bode-phase plots are consistent with Nyquist results. at hydrogen evolution potentials and inhibition efficiency (η%) are calculated and given in Table 3. It is clearly seen from Table 3 that the values of Icorr decreased and the η% increased in the presence of APPs. This effect significantly increased with increasing concentrations of APP and attained a maximum inhibition (92.3%) at 1.59 mmol L−1 for APP I. The inhibition efficiency was calculated from the equation:

![[thin space (1/6-em)]](https://www.rsc.org/images/entities/char_2009.gif)
![[thin space (1/6-em)]](https://www.rsc.org/images/entities/char_2009.gif)
![[thin space (1/6-em)]](https://www.rsc.org/images/entities/char_2009.gif)


