DOI:
10.1039/C5RA03924J
(Paper)
RSC Adv., 2015,
5, 35541-35550
Phase formation and stability of alloy phases in free nanoparticles: some insights
Received
5th March 2015
, Accepted 10th April 2015
First published on 10th April 2015
Abstract
This paper explores phase formation and phase stability in free nanoparticles of binary alloys. A procedure for estimating the size and composition dependent free energies incorporating the contributions from the interfaces has been presented. Both single phase solid solution and two phase morphology containing interphase interfaces have been considered. A free energy scenario has been evaluated for two binary alloy systems Ag–Ni and Ag–Cu to predict the microstructure of the alloy nanoparticles at different size ranges as a function of composition. Both Ag–Cu and Ag–Ni systems exhibit wide bulk immiscibility. Ag–Ni nanoparticles were synthesized using the wet chemical synthesis technique whereas Ag–Cu nanoparticles were synthesized using laser ablation of a Ag–Cu target immersed in distilled water. Microstructural and compositional characterization of Ag–Ni and Ag–Cu nanoparticles on a single nanoparticle level was conducted using transmission electron microscopy. Nanoparticle microstructures observed from the microscopic investigation have been correlated with thermodynamic calculation results. It is shown that the observed two phase microstructure consisting of Ag–Ni solid solution in partial decomposed state coexisting with pure Ag phases in the case of Ag–Ni nanoparticles can be only be rationalized by invoking the tendency for phase separation of an initial solid solution with increase in nanoparticle size. Smaller sized Ag–Ni nanoparticles prefer a single phase solid solution microstructure. Due to an increase in particle size during the synthesis process the initial solid solution decomposes into an ultrafine scale phase separated microstructure. We have shown that it is necessary to invoke critical point phenomenon and wetting transition in systems showing a critical point that leads to phase separated Ag–Ni nanoparticles providing a catalytic substrate for the nucleation of equilibrium Ag over it. In the case of the Ag–Cu system, we report the experimental observation of a core shell structure at small sizes. This can be rationalized in terms of a metastable solid solution. It is argued that the nucleation barrier can prevent the formation of biphasic morphology with an internal interface. In such a situation, demixing of the solid solution can bring the system to a lower energy configuration. This has lead to the observed core–shell morphology in the Ag–Cu system during room temperature synthesis.
1. Introduction
In recent years, studies on phase stability and phase transformations in nano-sized systems have gained considerable scientific and technological importance. These studies are needed to comprehend the fundamental science behind the phase stability criterion prevalent in systems at the nanometric length scale.1–7 One interesting effect of the size induced alteration in bulk phase stability observed in the case of nano-sized isolated particles is the realization of miscibility leading to the formation of solid solution between immiscible component atoms.8–10 Elemental immiscibility at the bulk scale results from a large difference in the sizes of the component atoms and a positive enthalpy of their mixing.11 Size-induced enhancement in miscibility is extremely relevant as it can facilitate manufacturing of novel alloys with exploitable technological properties.8 Although several experimental and theoretical studies on the phenomenon of size induced enhancement in miscibility have been reported by several research groups,8,9,12 many relevant issues related to the phase stability and microstructure still need to be addressed in a comprehensive manner. Furthermore, with respect to the understanding of the phase stability in systems with nanometric length scale, it should be emphasized that apart from the bulk-to-nano comparisons, the focus also should be on the “size effect” aspects. By “size-effect” it is meant that within the nano-scale regime, changes in the value of the surface and interface energies and the corresponding changes in the thermodynamic functions due to small changes in the size of the system is quite significant.13–18
Present work explores and extends some of our current ideas on the size effect in alloy particles at nanometric length scale. These include few critical results obtained recently that have the potential to throw light on the phase stability issues at small scale. In particular, in this paper we develop a general thermodynamic description of the alloys at small scale using the existing knowledge of thermodynamics of pure element and extending them to the case of alloys. However, before one dwells into the issue of phase transition and stability at small scale, one needs to explore the kind of equilibrium that is expected at small scale for the case of alloys. Since phase transformation is a kinetic process involving mass transport, it is possible to describe equilibrium in terms of diffusion distance. In the case of bulk, the time required for the two phases to equilibrate their chemical potentials is generally large. The diffusion distance given by the expression Ddiff/V where Ddiff is the diffusivity and V is the growth velocity is much smaller than the dimension of each phase in equilibrium. In such a case, we adopt the concept of local equilibrium where only the composition of the phases at the phase interface is dictated by that given by the phase diagram. The diffusional mass flow in such a case occurs by the flow across the chemical potential gradient. The exceptions to this occur during nucleation process as well as in some instances during decomposition of metastable solid solution in an immiscible system when the transport process is dictated by fluctuation. In general, the time to reach global equilibrium is dictated by system size. In the case of liquid to solid transition, a growth rate of 10−2 m s−1 and diffusivity of 10−8 m2 s−1 which is typical of such transition will yield a diffusion distance of 1 μm. Therefore, for any system size less than one micron, the liquid ahead of the growth interface will be globally mixed and hence full equilibrium can be assured. In the case of solid state, the growth rates are much smaller (of the order of μm s−1). This often is countered by reduced diffusivity in solid state. The diffusion distance can still be ∼1 μm if the diffusivity is of the order 10−12 m2 s−1. For systems with sluggish diffusivity, this can be even smaller. In general, however, it is reasonable to expect full equilibrium in treating phase changes in nanoparticles. Thus, thermodynamics should reasonably accurately predict the co-existing phases and their transitions as a function of temperature for these particles. In developing an expression for free energy changes for nanoparticles, one, however, needs to consider the surface and interface energies. In the following we first review the size dependent free energies of pure elements. Following this we shall attempt to develop an expression to estimate the free energies of alloy particles.
2. Size dependent surface energy of pure fcc elements
Thermodynamics at small size is dominated by the surface energy. However, the surface energy of small system is difficult to measure due to experimental constraints. Different methods are adopted by different research groups to estimate the surface energy of nanosize free particles. One of the methods is to find the vapor pressure difference due to change in particle size to get the surface energy of the pure elements. Piuz and Borel19 had calculated the surface energy of small crystals of pure Ag by calculating vapor pressure difference due to change in particle size. The surface energy is related to the chemical potential by the Gibbs Thomson's relation20 given by| |
 | (1) |
In this expression, γ is the average surface energy of a spherical particle with radius r; ρ is the specific mass and μ∞ is chemical potential in a crystal of infinite dimension. The well-known Kelvin equation21 can be obtained by equating the chemical potentials of crystal and the vapor and is given by| |
 | (2) |
where, p(r) is the actual vapor pressure of particle size r and p(∞) is the saturated vapor pressure, R is gas constant and T is the temperature. Therefore in order to obtain surface energy we need to know p(r). This can be estimated from the change in size of the particle using Langmuir law19 given by,| |
 | (3) |
here, α is the evaporation coefficient, p is the actual vapor pressure of particle, M is the molar volume.
Piuz and Borel19 used this to obtain equilibrium surface energy. However, these experiments can also be used to determine size dependent surface energy. The size dependent surface energy can also be obtained by measuring the changes in the lattice parameter with size. This quantity with the knowledge of modulus and an isotropic assumption allow us to estimate pressure on the particles due to surface energy which with the help of Kelvin equation can yield an estimate of surface energy value.
Recently Liu et al.22 have developed methods of estimating the surface energy of small particles of pure elements using the size dependent cohesive energy of the pure metal. This is elaborated in a later section. The plot of size dependent surface energy of pure Ag and Ni estimated from this formalism is shown in Fig. 1. The figure indicates significant increase in surface energy at small sizes. The extrapolated surface energies of 1.25 J m−2 and 2.45 J m−2 matches well with the reported bulk surface energies23 of Ag and Ni respectively. It should be noted that the thermodynamic calculations that produced the curve for variation in surface free energy with particle size in Fig. 1 considers average surface energy of a fcc crystal having equilibrium truncated octahedron geometry with clear crystal–air interfaces. In this study, since Ag–Ni and Ag–Cu nanoparticles grow in the liquid medium, the assumption may need modification. We have also ignored the effect of concentration gradient and hence contribution of the gradient energy. The experimental results presented are a temporal snapshot during the growth. These are larger than the critical size for solid solution which the particles have evolved through at the initial stages. Since they are larger, the initial solid solution is expected to start decomposing in a spontaneous manner (possibly through spinodal decomposition). This is exactly what has been observed and indirectly support our model.
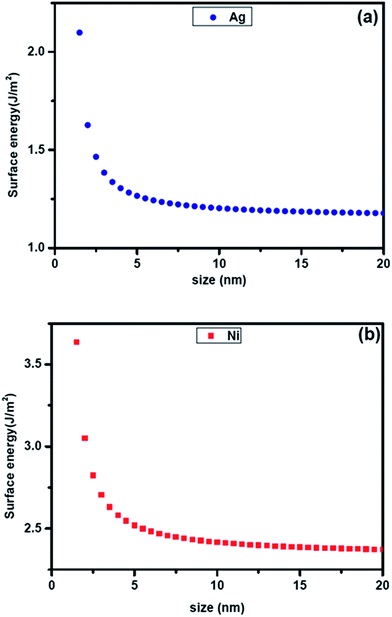 |
| | Fig. 1 Plot showing the calculated size dependent specific energy of (a) pure Ag and (b) pure Ni. | |
Surface energy plays a crucial role in phase formation at small scale. Although the surface energy contributions are generally neglected in the equilibrium phase diagram, it cannot be neglected at small sizes. The free energy function in this case should contain surface energy terms as contribution from surfaces and interfaces can be significant. For alloys, the geometry of the various surfaces needs to be known to estimate the surface energy contribution to the overall free energy. Fig. 2 shows two configurations of free nanoparticles that are possible in a particle of two components (A and B) at small length scale. The nanoparticles can be biphasic with an interphase interface separating them (Fig. 2a). The two elements A and B may also be completely mixed yielding nanoparticles of solid solution (Fig. 2b). In the following sections we present the free energy functions incorporating the size dependent free energies which can be used to estimate free energies of nanoparticles of different binary systems.
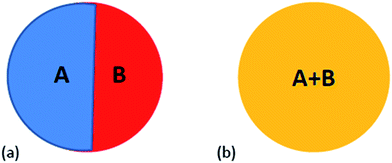 |
| | Fig. 2 Schematic of the two distinct morphologies that can be observed in binary alloys: (a) biphasic nanoparticle with internal interface, (b) nanoparticle of single phase solid solution between elements A and B. | |
3. Free energy of biphasic free nanoparticles containing interphase interface
This corresponds to situation illustrated in Fig. 2a. Here each free nanoparticle contains two phases, A and B separated by an internal interphase interface. Each biphasic particles have three surface energy contributions. Two of them arise from free surfaces surrounding the two phases in the particle. The third arise from the interface between the two phases. Therefore, the free energy of such a free nanoparticle can be expressed as:| | |
Gbiph = xAGA + xBGB + αASAγA(D) + αBSBγB(D) + Gint(D)
| (4) |
where, xA and xB are the mole fractions of phase A and B respectively. GA and GB are molar free energies of phase A and phase B; γA(D) and γB(D) are the size dependent specific surface energy (surface energy per unit area) where D is the diameter of the particle; SA and SB are the surface areas occupied by one mole of A and B respectively; αA and αB are the ratios of atoms at the surface and in the bulk of A and B respectively. The last term Gint(D) represents the interfacial energy between phase A and B. Considering the case when both A and B contain only one component, the surface energy can be calculated by the relation given by Turnbull.24 It consists of two terms, the geometrical term (γgeo) and the chemical (γchem) term. Therefore Gint(D) can be written as,25| | |
Gint = Sint(γgeo + γchem)
| (5) |
where,| | |
γgeo = [0.33(γA(D) + γB(D))]/2
| (6) |
and| | |
γchem = {xAΔHBinA/[C0(VA)2/3] + xBΔHAinB/[C0(VB)2/3]}
| (7) |
The term Sint is the interfacial area between A and B phases. ΔHAinB (or ΔHBinA) is the chemical interaction parameter for infinite dilution of A in B (or B in A). These quantities are available in the literature.26 The quantities VA and VB are the molar volumes of A and B respectively and C0 is a constant generally taken as 4.5 × 10⁸ [ref. 27].
4. The free energy of nanoparticles containing single phase solid solution of A and B
In the case described above, each phase contains only one component and there is no alloy formation between A and B except at the interface when the two pure phases interact. Fig. 2b describes the second scenario. Here both the components interact and form complete solid solution yielding a free single phase alloy particle. Here the surface energy of the alloy nanoparticle depends on both size and the composition of the alloy. The free energy of solid solution (Gss) in such a case is given by| | |
Gss = xAGA + xBGB + ΔGmix + (2γss(D,x)VAB)/(D/2)
| (8) |
here, xA and xB are the mole fractions of phase A and B respectively, GA and GB are the molar free energies of A and B respectively, ΔGmix is the excess free energy of the alloy and γss(D,x) is the size and composition dependent specific surface energy (surface energy per unit area) of the nanoparticle with solid solution between element A and B. The term VAB represents the molar volume of solid solution and D is the diameter of the particle. Free energy of an alloy phase due to mixing (ΔGmix) is given by,| | |
ΔGmix = ΔHmix − TΔSmix
| (9) |
where ΔHmix and ΔSmix are the enthalpy and entropy of mixing terms respectively. Assuming ideal solution, the entropy term can be written as| |
ΔSmix = −R[xA![[thin space (1/6-em)]](https://www.rsc.org/images/entities/char_2009.gif) ln ln![[thin space (1/6-em)]](https://www.rsc.org/images/entities/char_2009.gif) xA + xB xA + xB![[thin space (1/6-em)]](https://www.rsc.org/images/entities/char_2009.gif) ln ln![[thin space (1/6-em)]](https://www.rsc.org/images/entities/char_2009.gif) xB] xB]
| (10) |
where R is the gas constant. According to Miedema model28 the enthalpy of mixing (ΔHmix) has three contributions, chemical (ΔHchem), elastic (ΔHel) and structural (ΔHstr) and can be expressed as| | |
ΔHmix = ΔHchem + ΔHel + ΔHstr
| (11) |
The ΔHchem term is related to electron distribution generated at the interface between dissimilar unit cells. This is expressed as,23| | |
ΔHchem = xAxB[xAΔHchemBinA + xBΔHchemAinB]
| (12) |
here ΔHchemAinB (ΔHchemBinA) is the chemical interaction parameter.25 The elastic (ΔHel) contribution to the enthalpy of mixing arises due to the atomic mismatch of element A and B and is given by,29| | |
ΔHel = xAxB[xAΔHelBinA + xBΔHelAinB]
| (13) |
The term ΔHelAinB (or ΔHelBinA) represents the elastic interaction parameter and can be calculated by the following relation,| | |
ΔHelBinA = 2S′A(V*B − V*A)2/(3V*A + 4S′AkBV*B)
| (14) |
where S′A & S′B are the shear moduli; V*A and V*B are the effective molar volumes corrected for the charge transfer effects; kA and kB are the compressibility factors for of the elements A and B respectively.
The structural contribution (ΔHstr) [ref. 30] arises from the change in valence and crystal structure of the system and is given by,
| | |
ΔHstr = Estralloy(Zalloy) − [xAEstrA(ZA) + xBEstrB(ZB)]
| (15) |
here the
Zalloy,
ZA and
ZB are the average number of valance electrons per atom for the alloy, component A and component B respectively. The terms
Estralloy,
EstrA,
EstrB are the lattice stability parameter of the alloy, A and B respectively. In order to estimate
eqn (5), we now need to know the surface energy which is both composition and size dependent.
Estimation of composition and size dependence of surface energies
We have already briefly discussed the size dependence of surface energies. The specific surface energy γss(D,x) can be expressed in terms of surface energy per mole by the following expression,31| | |
γss(D,x) = NiEsurf(D,x)/παNAD2
| (16) |
where, Ni is the number of atoms on the surface of a particle of diameter D, α is the shape factor and NA is the Avogadro's number. The term Esurf(D,x) is surface energy per mole. Liu and Jiang22 have presented a relation between Esurf(D) and the cohesive energy Ecoh(D) for pure element. This is given ashere, k is a function of coordination number of atoms at the surface and in the volume. Qi32 has extended the size dependence cohesive energy to incorporate the composition dependence in the case of solid solution containing two components A and B. This is given by the following expression| |
 | (18) |
Recently we have shown that this expression does not take into account interaction between two different atoms in the alloys.26 Incorporating this interaction the above expression can be modified as
| |
 | (19) |
where
EA and
EB are the bulk cohesive energy;
dA and
dB are the atomic diameter of element A and B respectively.
α is the shape factor of the particle and
n is the total number of atoms in particle size
D. The interaction parameter is defined by
Ω. Using the
eqn (16),
(17) and
(19), we can now calculate the composition and size dependence surface energies of solid solution. and hence can calculate the free energy change as a function of size and composition.
We now present the experimental results of our observations for two fcc based alloy systems, namely Ag–Ni and Ag–Cu system. The synthesis methods do influence the as synthesized phases. However, we shall strive to rationalize the observed results with regards to prevalent thermodynamic conditions which as we shall show, provide unique insights.
5. The case of Ag–Ni alloy nanoparticle
We now apply the above thermodynamic formulation to understand the phase formation and microstructure evolution in Ag–Ni alloy nanoparticles. Let us consider a nanoparticle of Ag–Ni solid solution. Fig. 3 gives the calculated free energy curve of Ag–Ni solid solution (Gss) for a particles size of 7 nm. The hump in the free energy curve suggests that the solid solution if formed will tend to segregate compositionally without forming sharp interfaces. We have super imposed on this the free energy curve of two phase particles of fcc Ag and Ni of same size and containing interphase interface. As can be seen from these free energy curves, in this size range, the decomposition of the solid solution with the concomitant formation of interface between the phases will increase the free energy and hence will not be favorable. We shall now present the experimental results that we have obtained from chemically synthesized Ag–Ni alloy nanoparticles. The details are given elsewhere.31 The goal is to attempt explaining the origin of the microstructure that has been observed in our experiments by considering the size dependent thermodynamics.
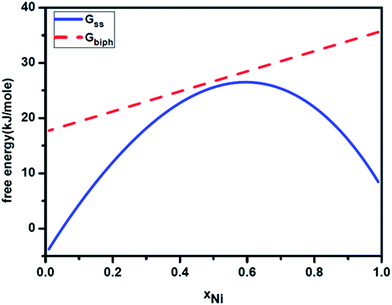 |
| | Fig. 3 Calculated free energy curves for 7 nm Ag–Ni alloy nanoparticle showing free energy curves for single phase solid solution (Gss) and nanoparticle containing two phases (Gbiph). | |
One of the striking results of our experiments is the formation of nanoparticles containing two phases. However, contrary to expectation, the two phases observed are equiatomic Ag–Ni solid solution and a pure Ag phase. A sharp interface separates these two phases. An example of this morphology is shown in Fig. 4a. As can be seen from this high resolution transmission electron microscope image of the particle, the solid solution phase has a size of ∼6–7 nm and it shares an interface with Ag phase. The decrease in lattice parameter of the solid solution phase as determined from the lattice fringe measurements clearly establish this phase to be a solid solution phase. Assuming that lattice parameters follow Vegard's law,33 the observed interplanar spacing of 0.220 nm for (111) planes represents the equiatomic composition of Ag and Ni. The lattice fringes from the other phase correspond to pure Ag. The size of this phase is much larger. A closer examination of the solid solution reveals distortions in the fringes suggesting the onset of process of demixing or compositional segregation through a probable spinodal like decomposition process. To illustrate the abundance of the particles with two phase microstructure, a low magnification bright field TEM image showing several of these particles and a selected area electron diffraction pattern (SAED), obtained from a group of these particles, showing diffraction signals corresponding to Ag–Ni solid solution phase and pure Ag phase is provided in the Fig. 4b and c. In the SAED pattern, the ring with d-spacing of 0.24 nm corresponds to Ag–Ni solid solution phase and the ring with d-spacing of 0.22 nm corresponds to the pure Ag phase.
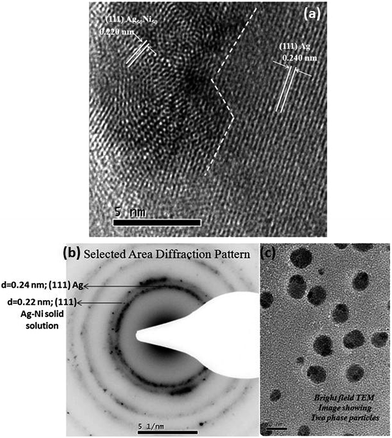 |
| | Fig. 4 (a) A high resolution transmission electron microscopy (TEM) micrograph of nanoparticle of Ag–Ni alloy obtained by chemical synthesis. The two phase particle consists of equiatomic Ag–Ni solid solution of diameter ∼6–7 nm surrounded by a pure Ag phase with sharp interface between the two phases (b) selected area electron diffraction pattern obtained from a group of two phase microstructured particles (c) TEM bright field image of two phase microstructured particles. | |
We propose that the present microstructure observation is a direct consequence of the phenomenon of critical point wetting. As shown by Cahn34 and discussed recently by Puri et al.35 for the case of thin films, system with a miscibility gap containing critical point can undergo a wetting transition of one of the phases. As a consequence the surface of the phase (wetting phase) act as universally wetting surface and can wet any external surface. The consequence of this for the decomposition behavior of metallic glasses with miscibility gap has been discussed recently.36 We argue that these surfaces are ideal catalytic surface for heterogeneous nucleation and lead to a spontaneous nucleation of equilibrium phase in case of complete or even partial wetting.37
In our earlier work,31 detailed thermodynamic calculations including the energy of the surfaces of the nanoparticle and the interfaces between the two phases for a two phase existence within a nanoparticle indicates that there is a critical size when the free energy of the two pure phase separated by an interface within a particle and a particle of the same size where there is a complete solid solution is equal for a given overall composition. For sizes below that there is a driving force in favour of the formation of solid solution.31 However, for the Ag–Ni system, the free energy curve representing solid solution is convex in nature as there is a positive heat of mixing for Ag and Ni. This indicates that even though the solid solution can form, it is not stable and is prone to solid state decomposition. In case the overall composition of the particle is not too near the bimodal line, the decomposition will most likely proceed through a spinodal decomposition triggered by a fluctuation process.38 The wave length of this fluctuation will depend on temperature and strain associated with the formation of solid solution.38 However, since it is a stochastic process, the probability of the initiation of the decomposition process will decrease with size. Thus, at a given temperature, fluctuations can be kinetically frozen below a certain size and one would expect to observe complete solid solution for very small sizes. However, as the particles grow, the solid state decomposition will set in. To understand the microstructure of the particles observed by us, we need to invoke at this stage another phenomenon associated with the spinodal decomposition known as critical point wetting.34,35 As mentioned earlier, during spinodal decomposition, one of the decomposing surfaces acquires the property of completely wetting any surfaces in contact with it. Thus one expects spontaneous nucleation of Ag (or Ni) on the surface of solid solution. In the present study, Ag–Ni nanoparticles were prepared by the chemical synthesis technique which is a bottom up approach for producing nanoparticles.31 Therefore it should be emphasized that the particles nucleated and grew from zero size to a finite size. Mechanistically, all the particles in the reaction mixture must have possessed a solid solution microstructure till the point at which some of them continued to grow over the critical size required for spinodals decomposition. Recent work31 provides the evidence for single phase solid solution structure for nanoparticles with sizes less than a critical size for the observation of spinodal decomposition. Once spinodal decomposition occurs in larger particles, critical point wetting will ensure the formation of terminal phase on the surface of solid solution phase. Thus the further growth of the particles will occur only by the growth of pure Ag leading to the observed morphology. A schematic illustrating the above described mechanism is provided in Fig. 5.
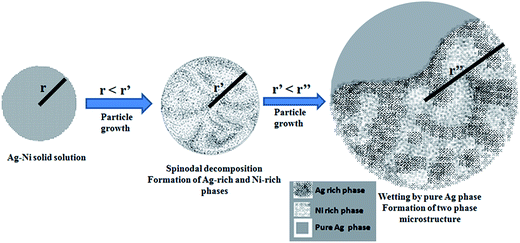 |
| | Fig. 5 A schematic illustrating the possible mechanism of formation of two phase microstructure particles. The schematic shows a sequence where a small sized particle with a solid solution structure grows above a critical size which causes the solid solution phase to spinodally decompose into Ag-rich and Ni-rich phases. Subsequent to the spinodal decomposition reaction, the Ag-rich phase provides a universal wetting surface for the pure Ag phase to nucleates and grows over it accordance with the critical point wetting phenomenon. | |
It should be noted that the size dependent thermodynamic arguments can be used for system sizes within the nanoscale regimen where the surface energy varies significantly with size. The stabilization of the solid solution in immiscible system is clearly a size dependent effect. However, the critical point wetting phenomenon is an universal phenomena that happens in system having critical point and undergoing the decomposition process. As the particles grow, the stabilization of the solid solution vanishes and the system enters phase separating regime. The critical point wetting phenomenon where one of the separating phase behaves as universal wetting surface occurs at this stage and the nucleation barrier on this surface vanishes. Thus pure silver which has lowest free energy forms spontaneously on this surface leading to the observed two-phase nanoparticle microstructure.
6. Microstructure evolution of alloy nanoparticles in Ag–Cu system by laser ablation
We now consider the case of Ag–Cu alloy nanoparticles. The synthesis in this case was carried out by laser ablation process under water. As a consequence, there exist important differences in the growth behavior compared to the case of Ag–Ni alloy. In general the particles form rapidly during laser pulsing and get isolated by the surrounding fluid. The subsequent growth of the particles generally occurs by coalescence and not by diffusion of the solutes through the media. This is unlike the chemical process where the atoms can arrive over a period of time leading to a time dependent growth. In Fig. 6, we have presented the free energy curve at room temperature for three different sizes of Ag–Cu alloy particles namely 5 nm, 13 nm and 25 nm. Again we have considered the two cases as illustrated in Fig. 2. Since the heat of mixing is also positive in this case, the free energy curves for Ag–Cu solid solution exhibit a hump similar to Ag–Ni system. This indicates that the solid solution will have demixing tendency. The free energy curves of nanoparticles containing two phase (Ag and Cu) separated by an interface do not show this behavior.
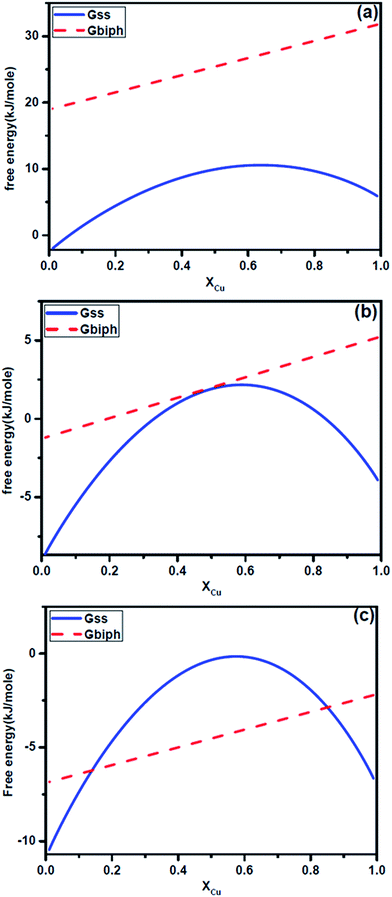 |
| | Fig. 6 Plots showing calculated free energy curves Gss and Gbiph for Ag–Cu alloy nanoparticles at room temperature for three different size of particles: (a) 5 nm, (b) 13 nm, (c) 25 nm. | |
An analysis of the free energy curves again allow us to arrive at some striking conclusions. Let us consider the free energy curve of 5 nm particles (Fig. 6a). It suggests that single phase particle containing solid solution is favorable in comparison to a two phase particle containing pure silver and copper. However, the solid solution will tend to demix and yield compositional segregation without creating an interface. The appearance of internal interface will raise the free energy. We note that we have not completely accounted for elastic energy in our calculation which may further stabilize the solid solution and reduce the miscibility gap. The above discussions yield following conclusions. Below a critical size, the nanoparticles of Ag–Cu alloy will form solid solution. A two phase equilibrium structure is not stable at these sizes. The solid solution can demix through segregation. However, solid solution will not decompose into two phase with an interface separating them.
For a 13 nm particle, the free energy curve of biphasic particles of Ag and Cu touches the free energy curve of solid solution at close to equiatomic composition (Ag50 Cu50) alloy (Fig. 6b). Fig. 6c shows the free energy situation for a 25 nm particle. An analysis of this and other curves with similar sizes in this range suggest that for a range of composition, solid solution can only exist as a metastable phase. A driving force exist for it to decompose into two phase with internal interface separating them. However, if it undergoes demixing, it can again enter into a stable state in comparison to a state containing two distinct phases.
Let us examine the experimental results in the context of this analysis. Fig. 7a shows two laser ablated Ag–Cu alloy nanoparticles of ∼25 nm and ∼35 nm sizes respectively. No internal interface could be observed in both the particles. These are nanoparticles containing single phase Ag–Cu solid solution. The composition profile obtained using 1 nm beam in scanning transmission electron microscopy (STEM) mode using a TECHNAI F30 microscope is shown in Fig. 7b. We have presented the intensities of the signals originating from Ag and Cu. Clearly copper has segregated at the interface while the core is Ag rich. Fig. 7c shows quantification of the composition profile for the 25 nm particle. The nature of segregation of solid solution is clearly revealed. For comparison, we have presented a particle of similar size (Fig. 8) which was heated in an image furnace for 3 minutes at 650 °C. The microstructure reveals internal interface between the two phases. Composition profile (Fig. 8b) clearly identifies the particle to be biphasic containing copper rich and Ag rich phases. The free energy curves for the nanoparticles of Ag–Cu alloy at 650 °C are presented in Fig. 8c. Clearly the driving force for the formation of two phases with interphase interface is much larger at this temperature and hence the solid solution decomposes into biphasic particle.
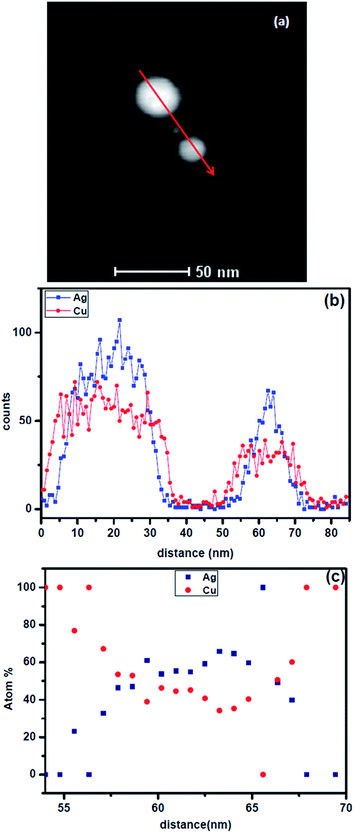 |
| | Fig. 7 (a) A STEM image of Ag–Cu alloy particles of size 35 nm and 20 nm, (b) distribution of intensity of Ag and Cu signals from EDS along the line as shown in (a), (c) composition distribution in the small particle (25 nm). Note the copper segregation at the outer shell and composition modulation of the solid solution near the core. | |
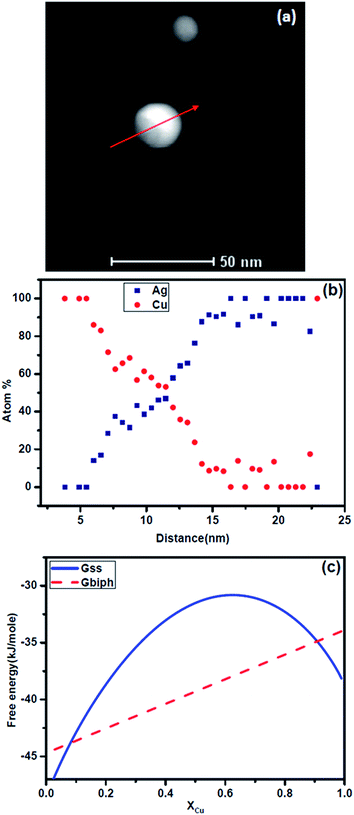 |
| | Fig. 8 (a) STEM image of Ag–Cu nanoparticle (∼25 nm) similar to that shown in Fig. 7 after heat treatment at 650 °C for three minutes in a gold image furnace, (b) composition distribution of Ag and Cu along the arrowed line obtained by STEM analysis using a 1 nm probe, (c) the free energy curve of Gss and Gbiph for the particle of the same size (25 nm) at 650 °C. | |
For the un-annealed Ag–Cu nanoparticles, presence of Cu on the surface of the particles as shown by Fig. 7 can be justified from taking into consideration the combined effect of the critical point wetting phenomenon and relative ablations rates for Ag and Cu atoms from the Ag–Cu target during the laser ablation reaction. As described earlier for the Ag–Ni case, with increase in the size of the Ag–Cu nanoparticles during ablation, initially formed Ag–Cu solid solution phase would undergoes spinodal decomposition at some critical particle size. This decomposition produces relatively Ag-rich and Cu-rich compositional waves in the particles. One such particle with compositional wave is shown in Fig. 9. Fig. 9a shows a high magnification TEM image of a Ag–Cu nanoparticle. Fig. 9b shows a Fast Fourier Transform (FFT) obtained from the image of the particles in Fig. 9a. The FFT reveals the presence of rings corresponding to the planes with interplanar spacing values of 0.21 nm, 0.22 nm and 0.23 nm. When compared to the interplanar spacing values for different planes in the crystal of pure Ag and Cu phases, the observed d-spacing values denote the presence of solid solution phases with Ag-rich and Cu-rich compositions within the particle. An Inverse Fast Fourier Transform images (IFFT) derived from the rings with interplanar spacing values of 0.22 nm and 0.23 nm shown in Fig. 9c and d respectively reveal intermixed Ag-rich and Ni-rich compositional waves characteristic of a spinodically decomposed microstructure. It is well known that the ablation rate for pure metals is directly proportional to their atomic number.39 This signifies that Ag should have a higher ablation rate as compared to Cu. During the laser ablation experiment, the target therefore gets richer in Cu with time. A relatively Cu-rich target would produce relatively Cu-rich atomic flux at the later stages of the ablation process producing compositionally graded microstructure with increasing Cu concentration towards the surface of particles as seen in the present case (Fig. 7). As the target becomes Cu rich with the progress of ablation process, the atomic flux would be copper rich. Due to the zero undercooling that is required for spontaneous nucleation on the perfectly wettable surface provided by the spinodically decomposed Ag–Cu particles (Fig. 9) due to critical point wetting and subsequent wetting transition34 Cu atoms nucleate to produce a Cu rich surface.
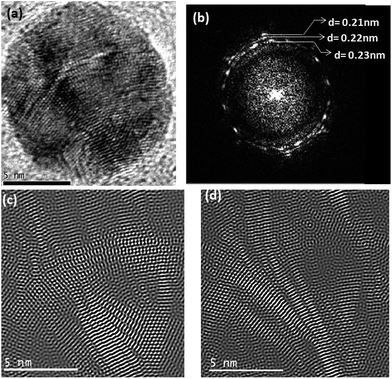 |
| | Fig. 9 (a) High magnification image of a nanoparticle (b) FFT image obtained from the particle in (a), (c) inverse Fourier transform image of the regions in the particle corresponding to the phase represented by the ring with interplanar spacing value of 0.23 nm in the FFT (d) inverse Fourier transform image of the regions in the particle corresponding to the phase represented by the ring with interplanar spacing value of 0.22 nm in the FFT. | |
7. Conclusions
We have presented a procedure for the estimation of size and composition dependent free energy function of fcc based metallic alloys taking into consideration biphasic alloy nanoparticles as well as nanoparticles of single phase solid solution. These free energy curves allow us to examine the possible phase evolution at different sizes. We show that it is possible to have solid solution at small sizes for alloys with high positive heat of mixing with extensive segregation. We note that wetting transition during spinodal decomposition can lead to a two phase structure of pure component and segregated solid solution. The experimental evidence of such occurrence has been presented for chemically synthesized Ag–Ni nanoparticles. For Ag–Cu alloy particle, the segregation can stabilize the alloy nanoparticles and the evidence of the formation of a segregated core shell like Ag–Cu solid solution particle is presented. These particles at higher temperature revert back to biphasic nanoparticles.
Acknowledgements
The authors would like to acknowledge the microscopy facilities available at Advanced Facility for Microscopy and Microanalysis (AFMM), The Indian Institute of Science, Bangalore, India. The funding from SERB and Department of Science and Technology, Government of India is gratefully acknowledged.
References
- A. S. Shirinyan, A. M. Gusak and M. Wautelet, Acta Mater., 2005, 53, 5025–5032 CrossRef CAS PubMed.
- M. Wautelet and A. S. Shirinyan, Pure Appl. Chem., 2009, 81, 1921–1930 CrossRef CAS.
- L. D. Gelb, K. E. Gubbins, R. Radhakrishnan and M. S. Bartkowiak, Rep. Prog. Phys., 1999, 62, 1573–1659 CrossRef CAS.
- S. Xiong, W. Qi, B. Huang, M. Wang, Y. Cheng and Y. Li, J. Comput. Theor. Nanosci., 2011, 8, 2477–2481 CrossRef CAS PubMed.
- A. S. Shirinyan and M. Wautelet, Nanotechnology, 2004, 15, 1720–1731 CrossRef CAS.
- F. Baletto and R. Ferrando, Rev. Mod. Phys., 2005, 77, 371–423 CrossRef CAS.
- M. Einax, W. Dieterich and P. Maass, Rev. Mod. Phys., 2013, 85, 921–939 CrossRef CAS.
- P. Ayyub, Int. J. Nanotechnol., 2009, 6, 530–540 CrossRef CAS.
- Z. Zhang, T. M. Nenoff, J. Y. Huang, D. T. Berry and P. P. Provencio, J. Phys. Chem. C, 2009, 113, 1155–1159 CAS.
- K. D. Malviya and K. Chattopadhyay, J. Phys. Chem. C, 2014, 118, 13228–13237 CAS.
- R. Najafabadi, D. J. Srolovitz, E. Ma and M. Atzmon, J. Appl. Phys., 1993, 74, 3144–3149 CrossRef CAS PubMed.
- S. Xiao, W. Hu, W. Luo, Y. Wu, X. Li and H. Deng, Eur. Phys. J. B, 2006, 54, 479–484 CrossRef CAS.
- P. Buffat and J. P. Borel, Phys. Rev. A, 1976, 13, 2287–2298 CrossRef CAS.
- P. R. Couchman and W. A. Jesser, Nature, 1977, 269, 481–483 CrossRef CAS.
- M. O. Robbins, G. S. Grest and K. Kremer, Phys. Rev. B: Condens. Matter Mater. Phys., 1990, 42, 5579–5585 CrossRef.
- L. H. Liang, D. Liu and Q. Jiang, Nanotechnology, 2003, 14, 438–442 CrossRef CAS.
- K. K. Nanda, S. N. Sahu and S. N. Behera, Phys. Rev. A, 2002, 66, 013208 CrossRef.
- C. Q. Sun, B. K. Tay, X. T. Zeng, S. Li, T. P. Chen, J. Zhou, H. L. Bai and E. Y. Jiang, J. Phys.: Condens. Matter, 2002, 14, 7781–7795 CrossRef CAS.
- F. Piuz and J. P. Borel, Phys. Status Solidi A, 1972, 14, 129–133 CrossRef CAS PubMed.
- R. Defay, I. Prigogine, A. Bellemans and D. H. Everett, Surface Tension and Adsorption, Longmans, London, 1966 Search PubMed.
- W. L. X. Thomson, Philos. Mag., 1871, 42, 448–452 Search PubMed.
- D. Liu and Q. Jiang, Nanoelectronics Conference, 2008 INEC 2008 2nd IEEE International, 2008, pp. 30–32 Search PubMed.
- A. R. Miedema, Z. Metallkd., 1978, 69, 6 Search PubMed.
- D. Turnbull, Metals Park, American Society of Metals, Ohio, 1955, pp. 121–144 Search PubMed.
- X. Y. Li, Z. F. Li and B. X. Liu, J. Alloys Compd., 2002, 334, 167–172 CrossRef CAS.
- A. K. Niessen, F. R. de Boer, R. Boom, P. F. de Châtel, W. C. M. Mattens and A. R. Miedema, CALPHAD: Comput. Coupling Phase Diagrams Thermochem., 1983, 7, 51–70 CrossRef CAS.
- A. R. Miedema, Z. Metallkd., 1978, 69, 287–292 CAS.
- F. R. de Boer, R. Boom, W. C. M. Mattens, A. R. Miedema and A. K. Niessen, Transition Metal Alloys, Amsterdam, North Holland, 1988 Search PubMed.
- J. D. Eshelby, Solid state physics, Academic Press, New York, 1956 Search PubMed.
- L. J. Gallego, J. A. Somoza and J. A. Alonso, Phys. B, 1989, 160, 108–112 CrossRef CAS.
- C. Srivastava, S. Chithra, K. D. Malviya, S. K. Sinha and K. Chattopadhyay, Acta Mater., 2011, 59, 6501–6509 CrossRef CAS PubMed.
- W. H. Qi, J. Mater. Sci., 2006, 41, 5679–5681 CrossRef CAS PubMed.
- A. R. Denton and N. W. Ashcroft, Phys. Rev. A, 1991, 43, 3161–3164 CrossRef CAS.
- J. W. Cahn, J. Chem. Phys., 1977, 66, 3667–3672 CrossRef CAS PubMed.
- K. Binder, S. Puri, S. Das and J. Horbach, J. Stat. Phys., 2010, 138, 51–84 CrossRef CAS.
- B. J. Park, H. J. Chang, D. H. Kim, W. T. Kim, K. Chattopadhyay, T. A. Abinandanan and S. Bhattacharaya, Phys. Rev. Lett., 2006, 96, 245503 CrossRef.
- H. B. W. Biloni, in Physical Metallurgy, ed. R. W. Cahn and P. Haasen, 4th edn, Amsterdam, North-Holland, 1996, pp. 669–842 Search PubMed.
- D. A. Porter, K. E. Easterling and M. Y. Sherif, Phase Transformations in Metals and Alloys, Taylor & Francis Group, 2009 Search PubMed.
- R. A. Burdt, S. Yuspeh, K. L. Sequoia, Y. Tao, M. S. Tillack and F. Najmabadi, J. Appl. Phys., 2009, 106, 033310 CrossRef PubMed.
|
| This journal is © The Royal Society of Chemistry 2015 |
Click here to see how this site uses Cookies. View our privacy policy here. 


![[thin space (1/6-em)]](https://www.rsc.org/images/entities/char_2009.gif) ln
ln![[thin space (1/6-em)]](https://www.rsc.org/images/entities/char_2009.gif) xA + xB
xA + xB![[thin space (1/6-em)]](https://www.rsc.org/images/entities/char_2009.gif) ln
ln![[thin space (1/6-em)]](https://www.rsc.org/images/entities/char_2009.gif) xB]
xB]


