Mechanism study of Li+ insertion into titania nanotubes

Nareerat Plylahana, Amélie Demoulina, Chrystelle Lebouina, Philippe Knauthabc and Thierry Djenizian*abc
aAix-Marseille University, CNRS, MADIREL UMR 7246, F-13397, Marseille, Cedex 20, France. E-mail: thierry.djenizian@univ-amu.fr
bFR CNRS 3459, Réseau sur le Stockage Electrochimique de l’Energie (RS2E), Paris, France
cFR CNRS 3104, ALISTORE-ERI, France

Received 3rd March 2015 , Accepted 13th March 2015

First published on 13th March 2015


Abstract

Li+ insertion into anatase titania nanotubes (TiO2nts) employing PEO-based polymer electrolyte has been studied by cyclic voltammetry and chronoamperometry. The study shows that Li+ storage in the anatase is dominated by the bulk diffusion (into the lattice) and the increasing contribution of the pseudo-capacitive effect with faster kinetics. We also report that the chemical diffusion of Li+ in self-organized TiO2nts is around 2 × 10⁻¹⁶ cm2 s−1 suggesting that the use of a solid electrolyte does not alter the charge transport in the nanostructured electrode.

Titania nanotubes (TiO2nts) have been extensively studied as a negative electrode for lithium-ion batteries (LIBs). Thanks to their nanotubular structure, TiO2nts show a suitable morphology to fabricate 3D lithium-ion microbatteries1 for portable devices. All-solid-state microbatteries are preferable due to the safety concerns and the ease of their fabrication. For these reasons, highly flammable organic liquid electrolytes must be avoided and replaced by solid or polymer electrolytes. Polymer electrolytes such as poly(ethylene oxide) (PEO) – based polymers show interesting properties such as good ionic conductivity,2,3 electrochemical stability,4 thermal stability5 and flexibility. Recently, we have reported the fabrication of half and full cells based on TiO2nts as negative and lithium-bis-(trifluormethanesulfonyl)-imide (LiTFSI) dissolved in PEO-based polymer electrolytes.6–8 These cells exhibit good performance e.g. good capacity and high stability upon cycling. However, the mechanism of Li+ storage in TiO2nts has not been studied yet. In this work, Li+ storage in anatase TiO2nts is investigated along with the determination of the chemical diffusion coefficient for Li+ insertion by electrochemical techniques, i.e. by cyclic voltammetry (CV) and chronoamperometry (CA).

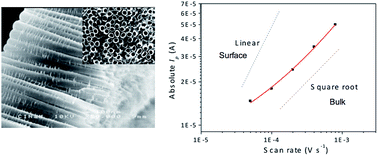
Here, amorphous TiO2nts were directly grown on a Ti substrate by a simple anodization process, then they were annealed to form an anatase phase which has a body-centered tetragonal structure with the space group I41/amd. Fig. 1a shows the morphology of the crystalline TiO2nts obtained by scanning electron microscopy (SEM). The cross-sectional view reveals the presence of highly-organized and smooth nanotubes with a length of 1.5 μm. Examination of the top view (inset) shows that the open diameter (100 nm) and the wall thickness (10 nm) are uniform.


image file: c5ra03759j-f1.tif
Fig. 1 (a) SEM images of TiO2nts and (b) galvanostatic profiles of anatase TiO2nt electrode in the half-cell using the polymer electrolyte and a Li foil as the reference.

The galvanostatic charge/discharge profiles of the anatase TiO2nts in the half-cell using the gel polymer electrolyte and a Li foil as the reference are given in Fig. 1b. The TiO2nt electrode was cycled at C/5 between 1.4 and 2.6 V vs. Li/Li+. The profiles show the discharge and charge plateaus at 1.75 and 1.9 V, respectively. Small plateaus observed in the discharge profile around 1.5 V may result from the electropolymerization of the electrolyte. The electropolymerization stiffens the gel electrolyte, leading to a decrease in ionic conductivity and capacity loss.8,9 The cell delivers a reversible capacity of 35 μA h cm−2 or 140 mA h g−1 which is 83% of the theoretical capacity of the anatase TiO2 (168 mA h g−1). Unlike in the case of TiO2 powder, self-supported TiO2nts are directly grown on the Ti current collector, without mixing with any additives e.g. carbon black or polymer binder. Moreover, the gel polymer electrolyte is in contact with TiO2nts only on the tube top. Thus, the accessibility of Li to the vacant sites in the lattice at the bottom of the tubes is limited only by the Li diffusion from the top. These factors may lower the capacity of TiO2nts.

The reversible insertion reaction of Li+ in anatase TiO2 is given by eqn (1).

 
TiO2 + xLi+ + xe ⇌ LixTiO2 for 0 ≤ x ≤ 0.5 (1)

The Li+ storage mechanism in TiO2nts can be studied by varying the scan rates and recording the peak discharge currents. These data can be exploited to determine whether Li+ is accommodated in the bulk lattice and/or at the surface of the nanotubes according to a pseudo-capacitive mechanism.

Fig. 2a shows five CV curves recorded in the potential window of 1.4–3.0 V vs. Li/Li+ at different scan rates (0.05–0.8 mV s−1). The redox peaks are well defined. The Li+ insertion (cathodic peak) and extraction (anodic peak) occur at 1.72 and 1.97 V vs. Li/Li+, respectively. The positions of the redox peaks are in agreement with the positions of the Li+ insertion/extraction plateaus in the galvanostatic profiles observed in Fig. 1b. At faster scan rate, higher currents, broader peaks, and a shift of the cathodic and anodic peaks to lower and higher potential values, respectively, are observed. These phenomena result from the combination of kinetic and iR drop effects.10–12


image file: c5ra03759j-f2.tif
Fig. 2 (a) CV curves at different scan rates, (b) peak discharge current (Ip) versus scan rate plot: (image file: c5ra03759j-u1.tif) experimental data and (image file: c5ra03759j-u2.tif) fitting, and (c) calculated Ic and Id.

Fig. 2b shows the peak discharge current (Ip) as a function of the scan rate (ν). The best fit of the experimental data using an apparent power-law dependence gives an apparent exponent value of 0.66 (Ipν0.66). Theoretically, the process of Li+ storage can be explained by eqn (2) 13,14

 
Ip = C1ν + C2ν1/2 (2)
where the first term C1ν corresponds to the storage of Li+ at the surface leading to the pseudo-capacitive current (Ic) and the second term C2ν1/2 is attributed to the bulk intercalation which is responsible for the faradic current (Id). In the case of Li+ storage occurring only in the bulk TiO2, the exponent would be 0.5 but when it is close to 1, the pseudo-capacitive effect is predominant. Since the exponent is equal to 0.66, the Li+ storage mechanism is governed by the bulk intercalation and the surface reaction processes. The fit of the experimental data with eqn (2) represented by the solid red line in Fig. 2b gives C1 = 0.016 ± 0.006 and C2 = 0.0011 ± 0.0002. The upper and lower dash lines represent the linear (pure Ic) and square-root (pure Id) dependence on the scan rate, respectively. These results reveal that the bulk intercalation of Li+ in the interstitial sites of anatase is predominant although the storage of charges also occurs partially at the surface.

The mechanism of Li+ insertion is also strongly dependent on the kinetics. Fig. 2c shows the variation of the calculated Ic(C1ν) and Id(C2ν1/2) vs. the scan rate. At slow scan rate, Id is predominant (for example at 0.05 mV s−1 the ratio Id[thin space (1/6-em)]:[thin space (1/6-em)]Ic is 10[thin space (1/6-em)]:[thin space (1/6-em)]1) suggesting that Li+ is mainly accommodated in the bulk material. When the scan rate increases, Ic becomes more significant since the diffusion of Li+ into the lattice is the rate limiting parameter. These results confirm that the pseudo-capacitive effect increases at fast kinetics.

The diffusion coefficient of Li+ at room temperature (25 °C) can be calculated using the Randles–Sevcik equation:

 
Ip = 268[thin space (1/6-em)]600n3/2AD1/2Cv1/2 (3)
where Ip is the peak current, n is the number of electrons involved in the redox reaction of Ti3+/Ti4+ which is equal to 0.5 according to eqn (1), F is the Faraday constant, A is the electrode surface area (active surface area of TiO2nts) which is approximately 32 cm2, D is the diffusion coefficient of Li+, and C is the maximum concentration of Li+ (or Ti3+) in the lattice (0.024 mol cm−3 at x = 0.5).14–16 According to eqn (2), the term 268[thin space (1/6-em)]600n3/2AD1/2C corresponds to C2 = 0.0011. Therefore, the diffusion coefficient of Li+ at room temperature is equal to 2.2 × 10⁻¹⁶ cm2 s−1.

Fig. 3 shows the chronoamperometric plot obtained by applying a constant potential of 1.7 V vs. Li/Li+, which is the potential of the insertion of Li+ into the lattice. The variation of the current density recorded between the maximum (absolute) value and the plateau can be described by the Cottrell equation (eqn (4)):16

 
j = nFCD1/2π−1/2t−1/2 (4)


image file: c5ra03759j-f3.tif
Fig. 3 (a) Chronoamperometric plot and (b) absolute current density (j) versus square-root (1/t): (image file: c5ra03759j-u3.tif) experimental data, (image file: c5ra03759j-u4.tif) linear fit.

The Cottrell equation is valid only in the diffusion control region (in our case approximately from a few ms to 20 s). The diffusion coefficient can be estimated by plotting the absolute current density vs. t−1/2. Ideally, the plot is a straight line when the kinetic is controlled by mass transport. The value of the slope which is equal to nFCD1/2π−1/2 can be determined by the linear fit (solid red line). The calculated diffusion coefficient for Li+ is estimated to be 2.1 × 10⁻¹⁶ cm2 s−1 which is consistent with the result obtained from the CV experiments.

The values obtained from our experiments are very close to those reported by Lindström et al.14,15 Indeed, the diffusion coefficient of Li+ in nanoporous anatase TiO2 studied in liquid electrolyte was found to be 2 × 10⁻¹⁷ cm2 s−1 from the CV and 1 × 10⁻¹⁷ cm2 s−1 from the CA. This result would indicate that one-dimensional nanomaterials such as vertical arrays of nanotubes can channel the migration of charges improving their transport even in solid electrolyte. However, it has to be noticed that the active surface area strongly influences the calculation. The actual active surface area and the projected area may give the diffusion coefficients differing by several orders of magnitude.

Experimental section

TiO2nts were fabricated as reported previously.6,8 The detailed procedure is provided in the supporting information. Briefly, a cleaned Ti foil was electrochemically anodized in a glycerol electrolyte containing 2% wt water and 1.3% wt NH4F. A constant voltage of 60 V was applied to the electrochemical cell using Ti foil as the working electrode and Pt foil as the counter electrode for 3 h. Anatase TiO2nts were obtained by annealing the as-formed TiO2nts at 450 °C under air for 3 h. The half-cells consisted of a TiO2nt layer were assembled against metallic Li foils using two-electrode Swagelok test cells. Two circular sheets (diameter of 10 mm) of separator were placed between the two electrodes. The separator was prepared by soaking the Whatman glass microfiber with an aqueous solution of 0.5 M LiTFSI + 0.5 M poly(ethylene glycol) methyl ether methacrylate (MA-PEG500) with the average molecular weight of 500 g mol−1. The gel electrolyte embedded in the Whatman paper was obtained after drying the separator in the BUCHI vacuum dryer at 60 °C overnight. The galvanostatic experiments were performed at C/5 in the potential window of 1.4–2.6 V vs. Li/Li+. The CV experiments were conducted at various scan rates (0.05–0.8 mV s−1) under a potential between 1.4 and 3.0 V vs. Li/Li+. The CA was studied in a three-electrode Swagelok cell. A TiO2nt electrode was assembled against one Li foil serving as a counter electrode and another Li foil as a reference electrode. Two separators were placed between each electrode. The CA test was performed by applying a constant potential of 1.7 V during 80 s. All the electrochemical measurements were performed using a VMP3 potentiostat–galvanostat (Bio Logic).

Conclusions

We have investigated the Li+ storage mechanism at room temperature in the anatase TiO2nts using a gel polymer electrolyte (LiTFSI dissolved in MA-PEG500). It is found that the Li+ storage is governed by intercalation of Li+ into the bulk with a pseudo-capacitive contribution even at low kinetics. The chemical diffusion coefficient of Li+ in TiO2nts at room temperature is around 2 × 10⁻¹⁶ cm2 s−1 as estimated from the CV and the CA. These values obtained from two different techniques suggest that self-organized titania nanotubes tested in polymer electrolyte can still promote charge diffusion.

Acknowledgements

This work has been carried out thanks to the support of the A*MIDEX project (no. ANR-11-IDEX-0001-02) funded by the “Investissements d’Avenir” French government program, managed by the French National Research Agency (ANR). We also acknowledge ANR JCJC no. 2010 910 01, and the Institut Carnot STAR.

Notes and references

  1. B. L. Ellis, P. Knauth and T. Djenizian, Adv. Mater., 2014, 26, 3368–3397 CrossRef CAS PubMed.
  2. P. G. Bruce and C. A. Vincent, J. Chem. Soc. Faraday Trans., 1993, 89, 3187–3203 RSC.
  3. R. C. Agrawal and G. P. Pandey, J. Phys. D: Appl. Phys., 2008, 41, 223001 CrossRef.
  4. Q. Xiao, X. Wang, W. Li, Z. Li, T. Zhang and H. Zhang, J. Membr. Sci., 2009, 334, 117–122 CrossRef CAS PubMed.
  5. R. Bernhard, A. Latini, S. Panero, B. Scrosati and J. Hassoun, J. Power Sources, 2013, 226, 329–333 CrossRef CAS PubMed.
  6. N. Plylahan, S. Maria, T. N. T. Phan, M. Letiche, H. Martinez, C. Courrèges, P. Knauth and T. Djenizian, Nanoscale Res. Lett., 2014, 9, 544 CrossRef PubMed.
  7. N. Plylahan, M. Letiche, M. K. S. M. K. S. Barr and T. Djenizian, Electrochem. Commun., 2014, 43, 121–124 CrossRef CAS PubMed.
  8. N. Plylahan, M. Letiche, M. Kenza, S. Barr, B. Ellis, T. N. T. Phan, E. Bloch and P. Knauth, J. Power Sources, 2015, 273, 1182–1188 CrossRef CAS PubMed.
  9. N. A. Kyeremateng, F. Dumur, P. Knauth, B. Pecquenard and T. Djenizian, Electrochem. Commun., 2011, 13, 894–897 CrossRef CAS PubMed.
  10. W. Wei, G. Oltean, C.-W. Tai, K. Edström, F. Björefors and L. Nyholm, J. Mater. Chem. A, 2013, 1, 8160 CAS.
  11. A. J. Bard and L. R. Faulkner, Electrochemical Methods, Wiley, New York, 2nd edn, 2001 Search PubMed.
  12. P. L. Taberna, S. Mitra, P. Poizot, P. Simon and J. M. Tarascon, Nat. Mater., 2006, 5, 567 CrossRef CAS PubMed.
  13. K. Zhu, Q. Wang, J. Kim, A. A. Pesaran and A. J. Frank, J. Phys. Chem. C, 2012, 116, 11895–11899 CAS.
  14. H. Lindström, S. Södergren, A. Solbrand, H. Rensmo, J. Hjelm, A. Hagfeldt and S. Lindquist, J. Phys. Chem. B, 1997, 101, 7717–7722 CrossRef.
  15. H. Lindström, S. Södergren, A. Solbrand, H. Rensmo, J. Hjelm, A. Hagfeldt and S. Lindquist, J. Phys. Chem. B, 1997, 101, 7710–7716 CrossRef.
  16. L. Kavan, M. Grätzel, S. E. Gilbert, C. Klemenz and H. J. Scheel, J. Am. Chem. Soc., 1996, 118, 6716–6723 CrossRef CAS.

Footnote

Electronic supplementary information (ESI) available. See DOI: 10.1039/c5ra03759j

This journal is © The Royal Society of Chemistry 2015
Click here to see how this site uses Cookies. View our privacy policy here.