Facile synthesis of γ-Fe2O3 nanoparticles integrated H2Ti3O7 nanotubes structure as a magnetically recyclable dye-removal catalyst

Narayani Harshaa, K. V. Swathi Krishnaa, Neeroli K. Renukab and Satyajit Shukla*a
aFunctional Materials Section (FMS), Materials Science and Technology Division (MSTD), National Institute for Interdisciplinary Science and Technology (NIIST), Council of Scientific and Industrial Research (CSIR), Industrial Estate P.O., Pappanamcode, Thiruvananthapuram 695019, Kerala, India. E-mail: satyajit_shukla@niist.res.in; Fax: +91-471-2491712; Tel: +91-471-2515385
bDepartment of Chemistry, University of Calicut, Malappuram 673635, Kerala, India

Received 2nd March 2015 , Accepted 23rd March 2015

First published on 23rd March 2015


Abstract

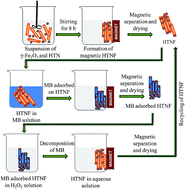
Nanocomposites consisting of γ-Fe2O3 nanoparticles incorporated in hydrogen titanate (H2Ti3O7 or lepidocrocite-type or H2Ti2O4(OH)-type structures) nanotubes (HTNF) have been synthesized through a simple strategy involving the combination of hydrothermal treatment followed by an ion-exchange process both conducted in aqueous media. The resulting nanocomposites reveal high efficiency in dye-adsorption capacity, magnetic separability from an aqueous solution, and recyclability. The unique nanostructures of HTNF composites are composed of γ-Fe2O3 nanoparticles typically attached to the ends of HTN bundles rather than along the surface and exhibit high magnetic separability in an aqueous medium using a moderate external magnetic field. The methylene blue (MB) dye-adsorption characteristics of HTNF nanocomposites have been investigated by varying the amount of γ-Fe2O3 (0–25 wt%) and the initial MB concentration (∼7.5–250 μM) at the initial solution-pH of ∼10. The HTNF nanocomposite with 5 wt% γ-Fe2O3 shows relatively higher MB dye adsorption capacity (99 mg g−1) along with reasonable magnetic separability (2 min) from an aqueous solution. The MB adsorption on the surface of the HTNF nanocomposites follows a pseudo-second-order kinetics model and the equilibrium adsorption isotherm follows both the Langmuir and Dubinin–Kaganer–Radushkevich (DKR) models. The recyclability of the HTNF magnetic nanocomposite in dye-removal application has been demonstrated by decomposing the previously adsorbed MB dye via surface-cleaning treatment conducted in H2O2 solution.

1. Introduction

There is a growing interest in the development of magnetic nanocomposites of various structures and compositions in diverse fields such as biomedical, catalysis, drug delivery, adsorption, and others.1–4 These materials have magnetic properties in addition to the properties of constituents which enables their easy separation under an external magnetic field, thus, overcoming the limitations of conventional separation techniques such as filtration and centrifugation. High specific surface-area and mesoporous nature of certain magnetic nanocomposites allow an effective utilization of these materials in the field of environmental purification due to their effectiveness and recyclability in the process. Two magnetic materials of significant interest in this field are the photocatalysts and adsorbents. The use of magnetic photocatalysts having the core–shell structure has been demonstrated for the degradation of various organic species.5 However, they suffer from two main drawbacks. First, the time required for the processing of thick titania (TiO2) coating (which cannot be obtained through a single-cycle) is very large; and second, the efficiency towards the decomposition of complex aromatic systems is lower. In this respect, the adsorption appears to be the most effective method due to its simplicity in operation, lower cost, and higher efficiency.

Magnetically assisted removal of water pollutant using high surface-area carbon based composites has been proposed with different nanostructures, involving nanocarbon, carbon nanotubes, and graphene.6–8 However, such materials on the industry scale pose major limitations such as higher cost, difficult synthesis route, and lower yield. Moreover, certain functional groups are necessary to be loaded on their surfaces in order to make them hydrophilic. Recently, the hydrothermally processed titanate nanotubes of high specific surface-area have been shown to exhibit high adsorption capacity towards different pollutants mainly the organic-synthetic-dyes and toxic heavy metal-cations.9,10 Their processing involves neither expensive experimental set-up nor excessive chemicals. As a result of their unique surface characteristics, the titanate nanostructures have been reported to be efficient for the removal of most of organic-synthetic-dyes. So far four different methods have been employed to load the magnetic nanoparticles on the titanate nanostructures. The first method involves the hydrothermal reaction involving the magnetic nanoparticles dispersed along with TiO2 in an alkali solution.11 However, in this method, the magnetic nanoparticles may get dissolved during the subsequent acid-washing step. Niu et al. reported an ion-exchange reaction for the adsorption of Fe3+/Fe2+ ions on the surface of titanate nanostructures which were converted to magnetite (Fe3O4) nanoparticles via co-precipitation.10 Liu et al. reported the self-assembly of titanate and magnetic nanoparticles in an acidic aqueous medium.12 Lastly, Thazhe et al. derived the magnetic nanocomposite via the hydrothermal treatment of sol–gel derived core–shell structured magnetic photocatalyst particles.13

Herein, we report the easiest pathway for the synthesis of titanate-based magnetic nanocomposite without the use of any binding species which is the modification of process reported by Liu et al.12 The as prepared magnetic nanocomposite is expected to be an excellent adsorbent because of large number of free adsorption sites on the surface of nanotubes due to the predominant attachment of magnetic nanoparticles to the ends of nanotubes. Although reusable magnetic adsorbent systems have been reported for the removal of metal-cations and organics,14–20 to the best of our knowledge, there is no report available in the literature yet on the effect of addition of magnetic property on the dye-adsorption capacity of the titanate-based magnetic nanocomposites synthesized via the novel ion-exchange mechanism. The advantage of using these nanocomposite materials for the present application involves the dye-removal in the dark condition, their separation from the treated aqueous solution using an external magnetic field with no loss in the amount of catalyst recovered, and their regeneration and reuse for the multiple cycles of dye-adsorption. For the first time, we demonstrate here both a simplest route for the processing of titanate-based magnetic nanocomposite and its recyclability in the dye-removal application involving the surface-cleaning treatment conducted via a novel strategy by using the cationic methylene blue (MB) dye as a substrate.

2. Experimental section

2.1 Synthesis of pure hydrogen titanate nanotubes (HTN) and HTN/maghemite (γ-Fe2O3) (HTNF) magnetic nanocomposites

The HTN were synthesized via the hydrothermal method as described in detail elsewhere.21 The HTNF magnetic nanocomposites having varying fractions (0–25 wt%) of γ-Fe2O3 nanoparticles (Aldrich Chemicals, Bengaluru, India) were synthesized via the self-assembly process without the use of an acid-catalyst.12 In this method, appropriate quantities of γ-Fe2O3 nanoparticles and HTN were dispersed separately in equal quantities of two different aqueous solutions at the neutral solution-pH (∼6.5) using an ultra-sonication bath (Bandelin Sonorex Super with Built-In Heating, Aldrich Labware, Bengaluru, India). The two suspensions were then mixed together to form total 1 g of solid particles suspended in 125 ml aqueous solution at the neutral solution-pH which was stirred vigorously using an overhead stirrer (IKA RW 14, Aldrich Labware, Bengaluru, India) for 8 h at 600 rpm. The brownish product formed was separated using an external magnetic field provided by a small bar magnet and dried in an oven at 80 °C overnight. The different magnetic nanocomposites are designated as HTNF-X where X represents the weight-percentage of γ-Fe2O3 in the magnetic nanocomposite.

2.2 Characterization of pure HTN and HTNF magnetic nanocomposites

The morphology and average size of different samples were determined using the transmission electron microscope (TEM, Tecnai G2, FEI, The Netherlands) operated at 300 kV. (Note: the samples were ultrasonically dispersed in 30 ml acetone for 20 min in which the carbon-coated Cu-grid (Ted Pella, Inc., U.S.A.) of 3 mm diameter was dipped for the TEM sample preparation). The nanocrystalline nature of samples was confirmed via obtaining the selected-area electron diffraction (SAED) patterns. The crystalline phases present were determined using the X-ray diffraction (XRD, PW1710 Phillips, The Netherlands). The broad-scan analysis was typically conducted within the 2θ range of 5–80° using the CuKα (λCu = 1.542 Å) X-radiation. The specific surface-area and pore-size distribution were measured using the Brunauer–Emmett–Teller (BET) surface-area measurement technique (Micrometrics Gemini 2375 Surface Area Analyzer, U.S.A.) via nitrogen (N2) adsorption using the multi-point method after degassing the samples in flowing N2 at 200 °C for 2 h. The magnetic properties of different samples were measured using a vibrating sample magnetometer (VSM) attached to a Physical Property Measurement System (PPMS, Quantum Design, Dynacool, U.S.A.). The pristine samples were subjected to different magnetic field strengths (H) and the induced magnetization (M) was measured at 298 K. The external magnetic field was reversed on saturation and the hysteresis loop was traced. The zeta-potential measurements were performed using the electrophoretic light scattering in the pH range from 2 to 9 using a Zetasizer Nano Series-Zen 3600 (Malvern Instruments, U.K.).

2.3 Dye-adsorption characteristics of pure HTN and HTNF magnetic nanocomposites

The dye-adsorption measurements were carried out using the MB dye via the procedure already described elsewhere.13,21 These measurements were conducted in 125 ml aqueous solutions at the initial solution-pH of ∼10 adjusted using the ammonium hydroxide (NH4OH) solution (25% NH3, Qualigens Fine Chemicals Pvt. Ltd., Mumbai, India) containing ∼7.5–250 μM of MB dye and 0.4 g l−1 of adsorbent. The HTNF magnetic nanocomposites were separated from the aqueous solutions using an external magnetic field provided by a small bar magnet. The normalized concentration of surface-adsorbed MB dye was calculated using the equation of form,
 
image file: c5ra03722k-t1.tif(1)
which is equivalent of form,
 
image file: c5ra03722k-t2.tif(2)
where, C0 (mg l−1) and Ct (mg l−1) correspond to the MB dye concentration at the start and after stirring time t (min) with the corresponding absorbance of A0 and At.

2.4 Surface-cleaning treatment and recycling of HTNF magnetic nanocomposite in the dye-removal application

The HTNF-5 sample was selected for the demonstration of surface-cleaning treatment and recycling in the dye-adsorption experiments. 0.4 g l−1 of HTNF-5 was added to 125 ml aqueous solution of MB dye having the initial concentration of ∼90 μM at the initial solution-pH of ∼10. The dye-adsorption measurement was then conducted using the procedure similar to the one described in the previous section. The HTNF-5 sample with the surface-adsorbed MB dye, after the separation from the aqueous solution using an external magnetic field provided by a small bar magnet and subsequent drying in an oven at 80 °C overnight, was utilized for the second-cycle of dye-adsorption measurement conducted under the similar test-conditions. Total three successive cycles of dye-adsorption measurements were conducted. The HTNF-5 sample, with the MB dye adsorbed on its surface, was utilized for the surface-cleaning treatment. For this purpose, the former was added to 100 ml of 30 wt% H2O2 solution (S.D. Fine-Chem Ltd., Mumbai, India) and stirred continuously using an overhead stirrer for 3 h. The surface-cleaned powder was separated from the aqueous solution using an external magnetic field provided by a small bar magnet, and after drying in an oven at 80 °C overnight, it was recycled for the fourth-cycle of dye-adsorption.

3. Results and discussion

3.1 Morphology, structure, and specific surface-area of pure HTN and HTNF magnetic nanocomposites

Fig. 1a shows the TEM image of pure HTN which are observed to form the bundles of nanotubes having the average length of ∼100 nm and average inner diameter of ∼4 nm. The cross-section of one of the nanotubes is shown as an inset (upper-left corner) in Fig. 1a where the thickness of cross-section is noted to be different on the opposite sides, which suggests that the nanotubes are formed via the roll-up mechanism.22 The HTNF-5 sample presented in Fig. 1b shows that γ-Fe2O3 nanoparticles are firmly attached to the HTN bundles typically at the ends of nanotubes (also see Fig. S1 in the ESI). Moreover, no free γ-Fe2O3 nanoparticles are observed for this sample. The HTNF-10 sample, Fig. 1c, clearly exhibits relatively larger fraction of γ-Fe2O3 nanoparticles attached to the ends of aggregated HTN (also see upper-left corner inset of Fig. 1c) without the presence of free γ-Fe2O3 nanoparticles. In contrast to this, the HTNF-25 sample shows both free (marked as encircled nanoparticles) as well as large number of γ-Fe2O3 nanoparticles attached to the HTN bundles, Fig. 1d. The SAED patterns (lower-right corner insets in Fig. 1) show the continuous ring patterns which suggest the nanocrystalline nature of all samples.
image file: c5ra03722k-f1.tif
Fig. 1 TEM images of pure HTN (a), HTNF-5 (b), HTNF-10 (c), and HTNF-25 (d) samples. The lower-right corner insets show the corresponding SAED patterns.

The site at which γ-Fe2O3 nanoparticles are attached to the HTN strongly indicates the nature of interaction between the two. Liu et al. observed the deposition of γ-Fe2O3 nanoparticles all along the surface of HTN when the two were dispersed in an acidic aqueous solution.12 In contrast to this, as seen in the TEM images, most of the γ-Fe2O3 nanoparticles are attached to the ends of nanotubes where the surface energy is maximum since the ends of nanotubes are the edges of nanosheets from which the nanotubes are evolved. Although such interaction is also possible along the outer surface of titanate nanotubes, it is possibly inhibited due to the bundled nature of nanocomposites. There exists a predominant force of electrostatic interaction among the titanate nanotubes and γ-Fe2O3 nanoparticles in an acidic environment.12 In the case of present nanocomposites, however, there is no extra charge on the surface of HTN since the nanocomposites are synthesized in the neutral solution-pH. (Note: the term “extra” here refers to the charge created by the external addition of acid or base into the system). Under such situation, the chemisorption of OH ions as well as Bronsted acidic nature of titanate surface develop a negative potential which involves the dissociation of H2Ti3O7 as,23

 
H2Ti3O7 ↔ 2H+ + Ti3O72− (3)

The zeta-potential measurements indicate that the point-of-zero charge of γ-Fe2O3 nanoparticles and HTN is 5.0 and 4.7. Considering this, it is obvious that at the neutral solution-pH, they have the negative surface-potential of −10.8 and −22.6 mV and the chemisorbed OH ions are primarily responsible for the negative surface-potential of γ-Fe2O3 nanoparticles. Although, initially the negative surface-potentials of both the solid surfaces would repel each other, the negative surface-charge on the γ-Fe2O3 nanoparticles may get neutralized due to the Bronsted acidic hydrogen titanate which may shift the equilibrium of eqn (3) in the forward direction (see the Table S1 in the ESI for the observed variation in the solution-pH with the addition of different samples to the aqueous solution). This in turn can expose the surface of γ-Fe2O3 nanoparticles for the closest approach of HTN. The attachment of HTN to γ-Fe2O3 nanoparticles predominantly occurs on a highly energetic site such as the ends of nanotubes. In our view, there is a strong possibility of ion-exchange reaction contributing to the actual bond formation of HTN with the surface of γ-Fe2O3 nanoparticles through the intercalation of surface Fe3+ ions typically at the nanotubes openings since the HTN can adsorb the metal-cations from an aqueous solution via the ion-exchange reaction.24 Moreover, the concept of bond formation via the ion-exchange mechanism has been carefully demonstrated in detail by us elsewhere.25 As a result, the bond which actually holds the nanotubes to the surface of γ-Fe2O3 nanoparticles is ion-exchange in nature. This is also evident from the report of Niu et al. where the strong interaction between Fe3O4 nanoparticles and H2Ti3O7 nanotubes has been demonstrated.10 Furthermore, the titanate also behaves as Lewis acid (Ti4+ site) which may favor the nanotubes attachment to the surface of γ-Fe2O3 nanoparticles.26 (Note: in Fig. 1d, the γ-Fe2O3 nanoparticles appear to be attached to the surface of HTN bundles. This is attributed to the two possible reasons. First, the HTN bundle contains large number of nanotubes, and hence, large number of nanotube openings (that is, the ends of nanotubes) all along its surface which can attract the γ-Fe2O3 nanoparticles via the ion-exchange mechanism. Second, since each individual nanotube is formed via the roll-up mechanism, it has a complete edge of nanosheet running along its length which can also attract γ-Fe2O3 nanoparticles via the ion-exchange mechanism (see Fig. S2 in the ESI)).

The XRD patterns of γ-Fe2O3 nanoparticles, HTN, and HTNF samples synthesized with varying weight-fractions of γ-Fe2O3 nanoparticles are presented in Fig. 2. The XRD pattern of HTN is assigned to pure H2Ti3O7 or lepidocrocite-type titanate or H2Ti2O4(OH)-type structure as evident from the 2θ values at 9.5, 25, and 48.1° which are allocated to the (200), (110), and (020) planes respectively.21,27 Also, the diffraction peaks at the 2θ values of 30.2, 35.6, 43.3, 53.7, 57.3, and 62.8° are assigned to (220), (311), (400), (422), (511), and (440) planes of γ-Fe2O3 in the pure form and within the nanocomposite as per the JCPDS card number 39-1346.28 (Note: the XRD intensity is noted to increase sharply at very low 2θ values which possibly suggests the presence of low angle peak (at <5°) which may be attributed to the mesoporous nature of material29). The intensity of peaks corresponding to γ-Fe2O3 phase is observed to increase gradually with its weight-fraction. It is to be noted that, in the present investigation, the HTNF magnetic nanocomposites are synthesized after the formation of HTN via the hydrothermal treatment. One of the advantages of synthesizing the HTNF magnetic nanocomposites through this strategy is the presence of only pure HTN phase in the final nanocomposite. However, if the TiO2 and γ-Fe2O3 nanoparticles are mixed together before the hydrothermal treatment, the final product may also consist of sodium titanate phase.30


image file: c5ra03722k-f2.tif
Fig. 2 XRD patterns of pure HTN (i), HTNF-5 (ii), HTNF-10 (iii), HTNF-25 (iv), and pure γ-Fe2O3 nanoparticles (v) samples.

The N2 adsorption–desorption isotherms of pure HTN and HTNF magnetic nanocomposites are shown in Fig. 3a. The isotherms are of type II while the hysteresis loop is of type H3 which are the characteristics of slit-shaped pores. The BET specific surface-area of 362, 311, 220, 243 m2 g−1 and the pore volume of 0.53, 0.46, 0.34, 0.38 cm3 g−1are respectively observed for the HTN, HTNF-5, HTNF-10, and HTNF-25 samples. Both the specific surface-area and pore volume are, thus, noted to be reduced with the increasing weight-fraction of γ-Fe2O3 nanoparticles (except for the HTNF-25 sample which may be attributed to the repulsive forces created by the magnetic γ-Fe2O3 nanoparticles which can reduce the aggregation of HTN) since the values of these parameters are relatively lower (32 m2 g−1 and 0.00045 cm3 g−1) for the γ-Fe2O3 nanoparticles compared with those of pure HTN. The Barret–Joyner–Halenda (BJH) pore-size distribution curves for the above samples are shown in Fig. 3b. It is observed that a narrow peak in the pore-size distribution curve lies in between ∼2–5 nm region which is attributed to the average inner diameter of pure HTN consistent with the TEM results. The broad distribution of pore-size in higher range corresponds to the non-uniform pore volume present in between the nanotubes within the bundles.


image file: c5ra03722k-f3.tif
Fig. 3 N2 adsorption–desorption isotherms (a) and BJH pore-size distribution curves (b) as obtained for the pure HTN (i), HTNF-5 (ii), HTNF-10 (iii), and HTNF-25 (iv) samples.

3.2 MB dye-adsorption characteristics of pure HTN and HTNF magnetic nanocomposites

The dye adsorption studies using the pure HTN and HTNF magnetic nanocomposites are carried out using the aqueous solutions of MB with the initial dye-concentration varying in the range of ∼7.5–250 μM. The obtained variations in the normalized concentration of MB dye adsorbed as a function of contact time, at the initial solution-pH of ∼10, are presented in Fig. 4 for the different samples. It is noted that the adsorption equilibrium is reached within 10 min. The normalized equilibrium concentration of MB adsorbed on the surface of adsorbent is noted to decrease with the increasing initial MB dye concentration which is due to the dominance of increase in the factor C0 appearing in the denominator of eqn (1). The electrostatic interaction between the negatively charged surface of HTN and cationic MB molecules plays a major role in the adsorption of latter on the surface of former. The negative surface-potential of HTN is further enhanced by adjusting the initial solution-pH to ∼10.31 The amount of MB dye adsorbed per unit weight of HTN and HTNF samples (qe, mg g−1) is calculated using the equation of form,
 
image file: c5ra03722k-t3.tif(4)
where, C0 and Ce (mg l−1) are the MB dye concentrations within the solution at the initial and equilibrium, V (l) the initial volume of MB dye solution, and mHTN (g) the mass of adsorbent used. The obtained variations in qe as a function of initial MB concentration are shown in Fig. 5 for the different samples. The increase in qe with the initial MB dye concentration, within the range of 7.5–150 μM, is due to the gradual consumption of more number of active surface-sites available for the dye-adsorption with an enhanced driving force. The decrease in qe at higher initial MB concentration has been attributed to the strong interaction of cationic MB molecules with the OH ions within the solution which restricts the adsorption of latter on the surface of adsorbent, thus reducing the negative surface-charge developed on the surface of adsorbent under these test-conditions.32 The MB adsorption capacity (qm) is estimated to be 113, 99, 75, and 66 mg g−1 for the HTN, HTNF-5, HTNF-10, and HTNF-25 samples respectively. Within the investigated range of initial MB concentration, the MB dye-adsorption capacity of γ-Fe2O3 nanoparticles at the initial solution-pH of ∼10 is determined to be very small (∼13 mg g−1) (also see Fig. S3 in the ESI) which is attributed to their lower specific surface-area and pore volume.33 Hence, it is noted that the introduction of magnetic property to the non-magnetic HTN results in a decrease in the dye-adsorption capacity of HTNF magnetic nanocomposites which is ascribed to the reduction in both the weight-fraction of HTN and the specific surface-area with the increasing amount of γ-Fe2O3. Among all the HTNF samples which possess the magnetic property, the maximum MB adsorption capacity is shown by the HTNF-5 sample which appears to be the most optimum one.

image file: c5ra03722k-f4.tif
Fig. 4 Variations in the normalized concentration of surface-adsorbed MB as a function of contact time as obtained for the pure HTN (a), HTNF-5 (b), HTNF-10 (c), and HTNF-25 (d) samples. The initial MB dye concentration is varied as 7.5 (i), 60 (ii), 90 (iii), 150 (iv), 200 (v), and 250 μM (vi).

image file: c5ra03722k-f5.tif
Fig. 5 Variation in qe as a function of initial MB dye concentration as obtained for the pure HTN (i), HTNF-5 (ii), HTNF-10 (iii), and HTNF-25 (iv) samples.

The time dependent adsorption of MB dye on the surface of pure HTN and HTNF magnetic nanocomposites is studied using two different kinetics models – Lagergren pseudo-first-order and pseudo-second-order. The linear forms of these kinetics models can be respectively expressed as,32

 
image file: c5ra03722k-t4.tif(5)
 
image file: c5ra03722k-t5.tif(6)
where, k1 (min−1), and k2 (g mg−1 min−1) are the Lagergren pseudo-first-order rate-constant, pseudo-second-order rate-constant, and qt the amount of MB dye adsorbed on the surface per unit mass (mg g−1) of adsorbent at time t. The linear plots with the regression correlation coefficient, 〈r2〉, approximately equal to 1 and the qe values approximately equal to that of experimentally observed values, Table 1, indicate that the MB adsorption on the surface of pure HTN and HTNF magnetic nanocomposites follows the pseudo-second-order kinetics which is in agreement with that reported by Lee et al.34

Table 1 Values of parameters of pseudo-second-order kinetics model as obtained for the different samples
Sample [MB] μM qe (exp.) mg g−1 qe mg g−1 k2 g mg−1 min−1 r2
HTN 7.5 5.84 5.88 0.22 0.99
60 47.2 47.6 0.11 1
90 69.5 71.4 1
150 113 125 0.003 0.99
5HTNF 7.5 6 6.1 1.58 1
60 48 50 0.027 0.99
90 69 71.4 0.039 0.99
150 98.5 100 0.99
10HTNF 7.5 6 6 0.9 1
60 46.5 47.6 −0.04 1
90 68.8 71.4 1
150 75 77 −0.003 0.99
25HTNF 7.5 5.9 5.9 0.864 1
60 45 45.4 0.003 0.99
150 59 62.5 0.003 0.99
250 66 71.4 0.002 0.99


The equilibrium adsorption of MB on the surface of HTN and HTNF samples is further studied using three different adsorption isotherm models – Langmuir, Freundlich, and Dubinin–Kaganer–Radushkevich (DKR). The Langmuir model assumes that all adsorbing sites are energetically equivalent and adsorption is monolayer. For the Freundlich model, the assumption is based on the heterogeneity of adsorbent and is not restricted to the monolayer coverage. The DKR model is generally used to explain the type of interaction (physical or chemical) which exists in between the adsorbent and adsorbate molecules. The expressions for the above three models are as given below.32

 
image file: c5ra03722k-t6.tif(7)
 
image file: c5ra03722k-t7.tif(8)
 
ln[thin space (1/6-em)]qe = ln[thin space (1/6-em)]qmβε2 (9)
where, KL (l mg−1) and KF (mg1−1/n g−1 l1/n) are the Langmuir and Freundlich constants related to the Gibb's free-energy of adsorption and qm, n (g l−1) the Freundlich constant which is related to the adsorption intensity, β a constant related to the adsorption energy, and ε the Polanyi potential which is given by,
 
image file: c5ra03722k-t8.tif(10)
where, R (J mol−1 K−1) is a gas constant and T (K) the absolute temperature. The adsorption energy (E, kJ mol−1) can be calculated using the relationship of form,
 
image file: c5ra03722k-t9.tif(11)

If the adsorption energy calculated from the DKR plot is below 8 kJ mol−1 then the physisorption of MB dye over the surface of pure HTN and HTNF magnetic nanocomposites prevails.32

The values of different parameters estimated after fitting the three equilibrium isotherm models, Fig. 6, are listed in the Table 2. Evidently, the qm values obtained via the Langmuir and DKR models are observed to be in agreement with the experimentally observed values. Moreover, the 〈r2〉 values obtained from the Langmuir and DKR plots are nearly equal to one which suggests that the equilibrium adsorption of MB on the surface of pure HTN and HTNF magnetic nanocomposites follows these two models. It has been demonstrated that in a highly acidic (initial solution-pH ∼ 2.5) and basic (initial solution-pH ∼ 11) solutions, the equilibrium adsorption of MB on the surface of pure HTN follows the Langmuir and DKR models; while, it exhibits a transition from the Langmuir to DKR models within the intermediate range of initial solution-pH.32 In the present investigation, the equilibrium adsorption of MB on the surface of pure HTN and HTNF magnetic nanocomposites follows both the Langmuir and DKR models at the initial solution-pH of ∼10 which is in agreement with the reported trend. Also, the Langmuir isotherm can decide whether the adsorption process is favorable (<1) or unfavorable (>1) using a factor RL which is defined as,

 
image file: c5ra03722k-t10.tif(12)


image file: c5ra03722k-f6.tif
Fig. 6 Langmuir (a), Freundlich (b), and DKR (c) plots as obtained for the HTNF-5 sample.
Table 2 Values of parameters of different equilibrium adsorption isotherm models as obtained for the different samples
Sample qm (exp.) mg g−1 Langmuir Freundlich DKR
qm mg g−1 KL l mg−1 r2 RL ΔG kJ mol−1 n g l−1 KF mg1−1/n g−1 l1/n r2 qm mg g−1 β mol2 J−2 r2 E kJ mol−1
HTN 113 143 2.33 0.97 0.002–0.15 −36.3 1.92 81.6 0.94 129 −6 × 10⁻⁸ 0.98 2.9
5HTNF 98.5 91 3.7 0.99 0.006–0.1 −37.5 2.04 74.2 0.96 88 −6 × 10⁻⁸ 0.99 2.9
10HTNF 75 77 3.2 0.99 0.006–0.11 −2.9 6.5 45 0.97 72.8 10−8 0.99 7.1
25HTNF 66 71.4 1.6 0.99 0.012–0.2 −35 2.6 28.4 0.89 61.6 10−7 0.98 2.2


The RL value for the MB adsorption on the surface of both pure HTN and HTNF magnetic nanocomposites lies in between 0.002–0.2 which indicates that the adsorption process is favorable. Further, the spontaneity of adsorption process can be predicted from the change in Gibb's free energy (ΔG0, J mol−1) which is calculated using the equation,

 
ΔG0 = −RT[thin space (1/6-em)]ln[thin space (1/6-em)]KL (13)

The appreciable negative values of ΔG0 as observed for all samples, Table 2, along with the E values less than 8 kJ mol−1 strongly suggest the spontaneous MB adsorption via the electrostatic attraction on the surface of HTN and HTNF samples which justify the nature of graph as observed in Fig. 5.

3.3 Magnetic characteristics of HTNF nanocomposites

Since the pure HTN is non-magnetic in nature, their separation from an aqueous solution is a difficult process. However, by attaching the superparamagnetic γ-Fe2O3 nanoparticles to the ends of HTN, the latter can be separated from the aqueous solution by applying a moderate external magnetic field. The magnetization curves of HTNF samples as measured at room temperature are presented in Fig. 7. The magnetic hysteresis loops are S-like curves. The saturation magnetization values for the γ-Fe2O3, HTNF-5, HTNF-10, and HTNF-25 samples are 71, 4, 9, and 17 emu g−1 respectively. Extremely small hysteresis loop and lower coercivity (57 Oe, see upper-left corner inset in Fig. 7) are the typical characteristics of superparamagnetic particles.35 The efficiency of magnetic separation of these nanocomposites from an aqueous solution is dependent on the weight-fraction of γ-Fe2O3 present in the nanocomposite. It is noted that HTNF-5 sample is separated within ∼2 min whereas very fast (∼10 s) magnetic separation is possible for the HTNF-10 and HTNF-25 samples. As demonstrated in the previous section, due to the introduction of magnetic property via the attachment of HTN to the γ-Fe2O3 nanoparticles, the HTNF samples exhibit some loss in the dye-adsorption capacity. In comparison with pure HTN, the reduction in MB dye adsorption capacity of magnetic nanocomposites is calculated to be 13, 33, and 42% for HTNF-5, HTNF-10, and HTNF-25 samples respectively. On the basis of both the effectiveness of magnetic separatebility and reduction in MB dye adsorption capacity, the optimum magnetic nanocomposite is found to be HTNF-5.
image file: c5ra03722k-f7.tif
Fig. 7 Magnetization curves as obtained for the pure γ-Fe2O3 nanoparticles (i), HTNF-5 (ii), HTNF-10 (iii), and HTNF-25 (iv) samples. The inset in lower-right corner shows the magnetic separation of HTNF-5 sample from an aqueous solution; while, that in upper-left corner shows the low-field magnetization curve for γ-Fe2O3 nanoparticles.

3.4 Surface-cleaning and recyclability of HTNF magnetic nanocomposite

Finally, the HTNF-5 magnetic nanocomposite is used to demonstrate its recyclability in the dye removal application. For this, the MB dye is first adsorbed on the surface of HTNF-5 sample via three successive dye-adsorption cycles, which is then subjected to the surface-cleaning treatment using 30 wt% H2O2 solution. This is in turn followed by the fourth cycle of dye-adsorption. The obtained variations in the normalized concentration of surface-adsorbed MB as a function of contact time as obtained for the different cycles of dye-adsorption, conducted before and after the surface-cleaning treatment, are presented in Fig. 8. It is noted that, before the surface-cleaning treatment, the amount of dye-adsorbed on the surface of HTNF-5 sample decreases with the increasing number of dye-adsorption cycles. The surface-cleaning treatment conducted after the cycle-3 is successful in decomposing the MB on the surface of HTNF-5 sample. The proposed mechanism of dye-decomposition in the dark using H2O2 as a strong oxidizer involves the generation of superoxide-ions (O2) and/or hydroxyl radicals (OH˙) which attack and decompose the dye adsorbed on the surface of nanotubes.36
 
image file: c5ra03722k-t11.tif(14)
 
image file: c5ra03722k-t12.tif(15)

image file: c5ra03722k-f8.tif
Fig. 8 Variation in the normalized concentration of MB dye adsorbed as a function of contact time as obtained under the different test-conditions for the HTNF-5 sample. The successive dye-adsorption cycles-1 to 3 (i–iii) and cycle-4 (iv) are conducted before and after the surface-cleaning treatment. For each dye-adsorption cycle, the initial MB dye concentration is ∼90 μM. The inset shows change in the color of original magnetic nanocomposite (a) after the completion of both dye-adsorption cycle-3 (b) and the surface-cleaning treatment (c).

As a result, the surface of nanotubes is free of MB dye after the surface-cleaning treatment and can be recycled for the next successive cycle of dye-adsorption. The original amount of dye-adsorption is also restored in the fourth cycle of dye-adsorption, Fig. 8. The inset of Fig. 8 illustrates the variation in the color of HTNF-5 sample as observed at the different stages of recycling process which supports the adsorption and decomposition of MB dye before and after the surface-cleaning treatment.

4. Conclusions

The HTN/γ-Fe2O3 hybrid nanostructures are successfully synthesized with varying γ-Fe2O3 weight-fraction. The γ-Fe2O3 nanoparticles are observed to be invariably attached to the ends of nanotubes possibly via the ion-exchange mechanism. The as-synthesized HTNF samples show high dye-adsorption capacity and effective magnetic separatebility. The introduction of magnetic property is observed to result in the loss of dye-adsorption capacity of HTN depending on the weight-fraction of γ-Fe2O3 nanoparticles. Based on both the effectiveness of magnetic separatebility and reduction in the dye-adsorption capacity, the optimum magnetic nanocomposite is found to be HTNF-5. The MB adsorption on the surface of HTNF nanocomposites follows the pseudo-second-order kinetics model and the equilibrium adsorption isotherm follows both the Langmuir and DKR models at the initial solution-pH of ∼10. By decomposing the previously adsorbed MB dye using the H2O2 solution, the HTNF magnetic nanocomposite can be recycled for the next-cycle of dye-adsorption with the restoration of original higher value of dye-adsorption capacity.

Acknowledgements

Authors thank CSIR, India for funding the projects # OLP216339 and P81113. Authors also thank Mr Peermohammed, Mr Kiran, Mrs Neenulekshmi, and Mr Arun Gopi (CSIR-NIIST, India) for conducting the BET, TEM, PPMS, and zeta-potential analyses respectively.

References

  1. S. A. Corr, Y. P. Rakovich and Y. K. Gun'ko, Nanoscale Res. Lett., 2008, 3, 87 CrossRef CAS.
  2. X. Wang, Y. Cui, Y. Wang, X. Song and J. Yu, Inorg. Chem., 2013, 52, 10708 CrossRef CAS PubMed.
  3. D. Pan, H. Zhang, T. Fan, J. Chen and X. Duan, Chem. Commun., 2011, 47, 908 RSC.
  4. P. Thanikaivelan, N. T. Narayanan, B. K. Pradhan and P. M. Ajayan, Sci. Rep., 2012, 2, 230 Search PubMed.
  5. S. Q. Liu, Environ. Chem. Lett., 2012, 10, 209 CrossRef CAS.
  6. L. Ai, H. Huang, Z. Chen, X. Wei and J. Jiang, Chem. Eng. J., 2010, 156, 243 CrossRef CAS PubMed.
  7. X. Han, L. Zhang and C. Li, RSC Adv., 2014, 4, 30536 RSC.
  8. T. Madrakian, A. Afkhami, M. Ahmadi and H. Bagheri, J. Hazard. Mater., 2011, 196, 109 CrossRef CAS PubMed.
  9. T. Wang, W. Liu, N. Xu and J. Ni, J. Hazard. Mater., 2013, 250-251, 379 CrossRef CAS PubMed.
  10. H. Niu, S. Zhang, X. Zhang and Y. Cai, ACS Appl. Mater. Interfaces, 2010, 2, 1157 CAS.
  11. A. L. Papa, L. Maurizi, D. Vandroux, P. Walker and N. Millot, J. Phys. Chem. C, 2011, 115, 19012 CAS.
  12. F. Liu, Y. Jin, H. Liao, L. Cai, M. Tong and Y. Hou, J. Mater. Chem. A, 2013, 1, 805 CAS.
  13. L. Thazhe, A. Shereef, S. Shukla, C. P. Reshmi, M. R. Varma, K. G. Suresh, K. Patil and K. G. K. Warrier, J. Am. Ceram. Soc., 2010, 93, 3642 CrossRef CAS PubMed.
  14. B. S. Krishna, N. Mahadevaiah, D. S. R. Murty and B. S. J. Prakash, J. Colloid Interface Sci., 2004, 271, 270 CrossRef CAS PubMed.
  15. Y. Zhang, Y. Cheng, N. Chen, Y. Zhou, B. Li, W. Gu, X. Shi and Y. Xian, J. Colloid Interface Sci., 2014, 421, 85 CrossRef CAS PubMed.
  16. X. Liu, Q. Hu, Z. Fang, X. Zhang and B. Zhang, Langmuir, 2008, 25, 3 CrossRef PubMed.
  17. O. V. Kharissova, H. V. Rasika Dias and B. I. Kharisov, RSC Adv., 2015, 5, 6695 RSC.
  18. M. H. Liao, K. Y. Wu and D. H. Chen, Chem. Lett., 2003, 32, 488 CrossRef CAS.
  19. J. L. Gong, B. Wang, G. M. Zeng, C. P. Yang, C. G. Niu, Q. Y. Niu, W. J. Zhou and Y. Liang, J. Hazard. Mater., 2009, 164, 1517 CrossRef CAS PubMed.
  20. J. Li, Y. Hou, X. Chen, X. Ding, Y. Liu, X. Shen and K. Cai, J. Mater. Sci.: Mater. Med., 2014, 25, 1055 CrossRef CAS PubMed.
  21. N. Harsha, K. R. Ranya, K. B. Babitha, S. Shukla, S. Biju, M. L. P. Reddy and K. G. K. Warrier, J. Nanosci. Nanotechnol., 2011, 11, 1175 CrossRef CAS PubMed.
  22. A. Nakahira, T. Kubo and C. Numako, Inorg. Chem., 2010, 49, 5845 CrossRef CAS PubMed.
  23. D. V. Bavykin, J. M. Friedrich, A. A. Lapkin and F. C. Walsh, Chem. Mater., 2006, 18, 1124 CrossRef CAS.
  24. W. Liu, T. Wang, A. G. Borthwick, Y. Wang, X. Yin, X. Li and J. Ni, Sci. Total Environ., 2013, 456–457, 171 CrossRef CAS PubMed.
  25. S. Shukla, H. Padinhattayil, H. Narayani, M. Jose and R. Karunakaran, WIPO Publication number WO/2014/188448, Publication Date: 27-November-2014.
  26. M. Kitano, E. Wada, K. Nakajima, S. Hayashi, S. Miyazaki, H. Kobayashi and M. Hara, Chem. Mater., 2013, 25, 385 CrossRef CAS.
  27. S. Mozia, E. B. Palen, J. Przepiorski, B. Grzmil, T. Tsumura, M. Toyoda, J. G. Damszel and A. W. Morawski, J. Phys. Chem. Solids, 2010, 71, 263 CrossRef CAS PubMed.
  28. A. K. Dutta, S. K. Maji and B. Adhikary, Mater. Res. Bull., 2014, 49, 28 CrossRef CAS PubMed.
  29. L. Li, J. Shi, J. Yan, X. Zhao and H. Chen, Appl. Catal., A, 2004, 263, 213 CrossRef CAS PubMed.
  30. X. Cao, X. Xue, L. Zhu, P. Chen, Y. Song and M. Chen, J. Mater. Chem., 2010, 20, 2322 RSC.
  31. D. V. Bavykin, K. E. Redmond, B. P. Nias, A. N. Kulak and F. C. Walsh, Aust. J. Chem., 2010, 63, 270 CrossRef CAS.
  32. H. Narayani, S. P. Kunniveetil and S. Shukla, Adv. Sci., Eng. Med., 2013, 5, 63 CrossRef CAS PubMed.
  33. K. Xie, X. Wang, Z. Liu, A. Alsaedi, T. Hayat and X. Wang, J. Zhejiang Univ., Sci., A, 2014, 15, 671 CrossRef CAS.
  34. C. K. Lee, K. S. Lin, C. F. Wu, M. D. Lyu and C. C. Lo, J. Hazard. Mater., 2008, 150, 494 CrossRef CAS PubMed.
  35. P. R. Chang, P. Zheng, B. Liu, D. P. Anderson, J. Yu and X. Ma, J. Hazard. Mater., 2011, 186, 2144 CrossRef CAS PubMed.
  36. K. B. Babitha, K. G. K. Warrier and S. Shukla, Adv. Sci., Eng. Med., 2014, 6, 173 CrossRef CAS PubMed.

Footnote

Electronic supplementary information (ESI) available. See DOI: 10.1039/c5ra03722k

This journal is © The Royal Society of Chemistry 2015
Click here to see how this site uses Cookies. View our privacy policy here.