Pooja Dixit‡
,
Ananya Mehta‡,
Geeta Gahlawat‡,
G. S. Prasad and
Anirban Roy Choudhury*
CSIR-Institute of Microbial Technology (IMTECH), Council of Scientific and Industrial Research (CSIR), Sector-39A, Chandigarh-160036, India. E-mail: anirban@imtech.res.in; Fax: +91 172 2695215; Tel: +91 172 6665312
First published on 14th April 2015
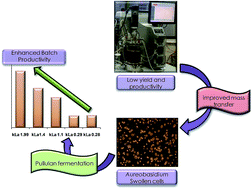
Pullulan is a non-ionic, water-soluble homopolysaccharide produced via fermentation using Aureobasidium pullulans, a black yeast. The unique physicochemical properties of pullulan have made it a potential candidate for a diverse range of applications in various industrial sectors such as food, pharmaceutical, cosmetics, and biomedicine. Low yield and productivity are major challenges for the extensive commercialization of this biopolymer, and they are often found to be associated with poor mass transfer during the fermentative production of pullulan. The present study is an attempt to address this challenge by a unique multivariate approach. The interactive influence of air-flow rates, agitation speed and impeller spacing on volumetric mass transfer coefficient (kLa) was investigated using a statistical design. The design has demonstrated a unique correlation between mass transfer capabilities and process variables, whereas pullulan fermentation kinetics has revealed a dependence of microbial activity on kLa values in a bioprocess. Furthermore, the resultant mass transfer conditions were applied for pullulan production, which enhanced the productivity significantly (1.61 g L−1 h−1). These observations might help in obtaining improved mass transfer conditions for the economic production of pullulan.
The fermentative production of pullulan is associated with the problems of high viscosity and poor mass transfer conditions. Viscous fermentation broths exhibit pseudo-plasticity and viscoelasticity owing to their changing fluid rheology with the passage of fermentation time. The non-Newtonian behavior of viscous fermentation fluids impart detrimental effects on bioreactor performance through perturbed mixing conditions and oxygen mass transfer criteria.4 The inhomogeneity produced in the fermenter due to viscous fluid rheology may affect the yield and productivity of the bioprocess. Improved mass transfer conditions might help in resolving issues such as lower product yield and poor quality products during pullulan production via fermentation.5 Oxygen requirements of bioprocesses in a fermenter are met through the gas–liquid mass transfer phenomenon,6,7 in which oxygen is transferred from ascending bubble streams into aqueous phase and is often characterized by a volumetric mass transfer coefficient (kLa).
Generally, the enhancement of kLa values is achieved by either increasing agitation or aeration values in a fermenter; however, their associated disadvantages of generating new challenges, such as increased process costs, excessive foaming, and high shear rate, limit their application to a certain extent.8 Increasing these variables beyond a critical value decreases both mass transfer capability as well as microbial activity. Earlier, Bandaiphet and Prasertsan (2006) reported reduced biopolymer production from Enterobacter cloacae when fermentation was executed beyond an agitation rate of 600 rpm.9 The higher level of agitation could maintain available dissolved oxygen in the fermenter; however, increasing the agitation speed beyond a particular level may inhibit cell growth and product formation by inducing cell deformation at high shear rates.10 Similarly, Roukas and Mantzouridou (2001) also reported lower pullulan yields with higher levels of aeration, suggesting that the univariate enhancement of either agitation or aeration might not resolve the mass transfer issues of viscous fermentations.11 Moreover, flow pattern and oxygen transfer rates in stirred tank reactors are significantly affected by the spacing between the impellers.12 It may be emphasized that increasing the distance between the impellers beyond a critical level would create an ineffective agitation region between adjacent impellers, resulting in reduced mass transfer.13
To address these challenges, the present study was attempted to create an improved mass transfer environment for carrying out viscous pullulan fermentation. A unique approach was followed for the first time to improve the process of mass transfer capability of fermentation systems. This approach employed a statistical model to understand the interaction of aeration, agitation and impeller spacing on the oxygen mass transfer capabilities of a fermenter using a simulated Newtonian system. Depending upon the multivariate effect of these parameters on oxygen mass transfer, an optimized fermentation operating condition was devised for resolving oxygen limitation during the fermentative production of pullulan. These optimized conditions were further applied in pullulan fermentation to overcome mass transfer issues related to viscous fermentations, resulting in an enhanced productivity of the biopolymer.
Factors | Symbols and units | Coded levels | |||||
---|---|---|---|---|---|---|---|
Min. | Low (−1) | Mid (0) | High (+1) | Max. | Std. dev. | ||
a Note: * volume per volume per minute. | |||||||
Agitation | A (rpm) | 63.64 | 200 | 400.00 | 600.00 | 736 | 169.56 |
Aeration | B (vvm*) | 0.15 | 0.75 | 1.63 | 2.50 | 3.10 | 0.74 |
Impeller position | C (inch) | 0.11 | 1.10 | 2.55 | 4.00 | 4.99 | 1.23 |
For this purpose, agitation and aeration were controlled by providing set points in the fermenter, whereas the spacing between two impellers was changed by varying the position of top impeller. According to previous reports,15,16 the distance between the lower impeller and the bottom of the vessel should be one-third of the vessel's diameter. In the present study, the diameter of the bioreactor vessel used was 6′′, and thus accordingly lower impeller position was fixed at a distance of 2′′ from the bottom of the vessel. A total of 19 experiments (Table 2) were designed using a statistical software package (Stat Ease Inc. Design Expert Ver. 8), which included five centre points, six axial points and eight factorial points with five replicates around the centre point. A multiple regression analysis of the data was carried out to determine the optimal oxygen mass transfer conditions in a fermenter. A second-order polynomial equation was devised to define the predicted response (Y) in terms of independent variables (A–C), expressed as
Y = xo + x1A + x2B + x3C + x11A2 + x22B2 + x33C2 + x12AB + x13AC + x23BC |
Run no. | Factor A agitation (rpm) | Factor B aeration (vvm) | Factor C impeller spacing (inch) | Response: kLa (min−1) |
---|---|---|---|---|
1 | 736.36 | 1.63 | 2.55 | 2.1 |
2 | 400.00 | 1.63 | 2.55 | 1.15 |
3 | 400.00 | 1.63 | 2.55 | 1.3 |
4 | 200.00 | 2.50 | 1.10 | 0.56 |
5 | 600.00 | 0.75 | 4.00 | 0.8 |
6 | 200.00 | 2.50 | 4.00 | 0.73 |
7 | 200.00 | 0.75 | 1.10 | 0.29 |
8 | 600.00 | 2.50 | 4.00 | 1.9 |
9 | 400.00 | 1.63 | 0.11 | 0.28 |
10 | 400.00 | 1.63 | 4.99 | 0.8 |
11 | 400.00 | 0.15 | 2.55 | 0.6 |
12 | 600.00 | 2.50 | 1.10 | 1.7 |
13 | 600.00 | 0.75 | 1.10 | 1.1 |
14 | 200.00 | 0.75 | 4.00 | 0.45 |
15 | 400.00 | 1.63 | 2.55 | 1.4 |
16 | 400.00 | 1.63 | 2.55 | 1.3 |
17 | 63.64 | 1.63 | 2.55 | 0.28 |
18 | 400.00 | 3.10 | 2.55 | 1.4 |
19 | 400.00 | 1.63 | 2.55 | 1.4 |
Batch no. | Run no. | Agitation (rpm) | Aeration (vvm) | Impeller spacing (inch) | kLa value (min−1) |
---|---|---|---|---|---|
1 | Optimized | 600.00 | 2.50 | 2.80 | 1.99 |
2 | 13 | 600.00 | 0.75 | 1.10 | 1.1 |
3 | 15 | 400.00 | 1.63 | 2.55 | 1.4 |
4 | 17 | 63.64 | 1.63 | 2.55 | 0.28 |
5 | 7 | 200.00 | 0.75 | 1.10 | 0.29 |
The model defining second-order polynomial in terms of coded factors is given as follows:
Y = 1.31 + 0.48A + 0.26B + 0.081C + 0.14AB − 0.054AC + 0.064BC − 0.031A2 − 0.098B2 − 0.26C2 |
The statistical significance of the model was confirmed by the Fisher's test for the analysis of variance (ANOVA), which revealed that the second-order polynomial function fitted well with the experimentation data (Table 4). The model F-value was observed to be 29.98, which implied that model was significant and that there is only 0.01% chance to obtain results not foreseen by the regression model. The large P-value for lack of fit (0.1874 > 0.05) showed that ‘lack of fit’ was insignificant relative to pure error.
Source | ANOVA for kLa optimization | ||||
---|---|---|---|---|---|
Sum of squares | df | Mean square | F value | Prob > F | |
Model | 5.36 | 9 | 0.60 | 29.98 | <0.0001 |
A-agitation | 3.12 | 1 | 3.12 | 157.24 | <0.0001 |
B-aeration | 0.95 | 1 | 0.95 | 47.66 | <0.0001 |
C-impeller position | 0.089 | 1 | 0.089 | 4.50 | 0.0630 |
AB | 0.17 | 1 | 0.17 | 8.32 | 0.0180 |
AC | 0.023 | 1 | 0.023 | 1.16 | 0.3088 |
BC | 0.033 | 1 | 0.033 | 1.64 | 0.2327 |
A2 | 0.013 | 1 | 0.013 | 0.64 | 0.4433 |
B2 | 0.13 | 1 | 0.13 | 6.57 | 0.0305 |
C2 | 0.93 | 1 | 0.93 | 46.60 | <0.0001 |
Residual | 0.18 | 9 | 0.020 | ||
Lack of fit | 0.14 | 5 | 0.027 | 2.60 | 0.1874 |
Pure error | 0.042 | 4 | 0.010 | ||
Cor total | 5.54 | 18 |
Previously, Jiang (2010) employed the statistical optimization technique to study the combinatorial effects of temperature, time and initial pH on pullulan production.21 The F-value (14.71) and the P-value for lack of fit (0.259 > 0.05) of the model, as developed by Jiang, was found to be considerably similar with the model developed in the present study. Therefore, it could be suggested that the developed model is suitable for navigation within the design space. This statement was further strengthened by the fact that the R2 (0.9677) value was in reasonable agreement with adjusted R2 (0.9354) in the present report. These high R2 values coupled with high model F-value and insignificant lack of fit indicated that the model predictions can appropriately explain the cumulative, as well as univariate, effects of all the selected variables on the kLa values of the fermenter.22 The model was further validated by executing a batch fermenter run with an aqueous system as per optimized conditions (600 rpm, 2.5 vvm and 2.8′′ impeller spacing) predicted by the model. The actual value of the response, i.e. kLa value (1.92 min−1), was found to be in agreement with the predicted kLa value (1.99 min−1); thus, the model was successfully validated. Parity plots (Fig. 1) also demonstrated good correlation between the actual and predicted values, indicating the aptness of the model.
Fig. 1 Parity plot: showing the relation between actual response and predicted values for kLa estimation. |
This plot indicated that at lower values of impeller speed, the kLa value was small; however, upon increasing the impeller speed, kLa values were also enhanced. Conversely, in the case of impeller position, kLa was found to increase gradually as the spacing between the two impellers was increased; however, a further increase in spacing between the impellers beyond a critical value resulted in the reduction of volumetric mass transfer coefficient values. This inference obtained from the plot can further be justified by comparing the observed responses in Table 2. The data clearly indicated that increasing impeller separation from 0.11′′ to 2.55′′ (run no. 9 and 15) significantly enhanced the kLa in the fermenter (0.28 min−1 to 1.4 min−1), whereas a further separation of impellers from 2.55′′ to 4.99′′ (run no. 15 and 10) created a drop in the kLa value of the fermenter (1.4 min−1 to 0.8 min−1). This observation is in accordance with the previous report of Mishra and Joshi (1994), which suggested that the distance between two impellers has an enormous impact on mass transfer.23 This group reported that if the impellers are placed too far apart, the chances of material being exchanged between the circulation loops is reduced, resulting in a poorer overall mixing and mass transfer. Conversely, if the impellers are moved closer together, the circulation loops from each impeller encroach on each other, allowing for improved fluid interchange.12,13 However, placing the impellers close to each other may lead to inefficient mixing of large volumes of liquid in the upper or lower regions of the vessel. Therefore, although inter-impeller mixing is improved, overall mass transfer is reduced.
Similar observations could also be made while analyzing another response surface plot, which described the dependence of kLa on the distance between two impellers and air flow rate at specific agitation speeds (Fig. 2b). The response surface plot clearly indicated that although kLa increased with an increase in distance between the two impellers, it decreased when the distance between these two impellers were enhanced beyond a critical value, suggesting the importance of impeller positions in the creation of ideal mixing zones within the bioreactor.
Previously, Hudcova et al. (1989) also made similar observations15 and suggested that larger distances between the two impellers would result in the formation of parallel individual mixing zones in the fermenter for each impeller and would negatively affect the oxygen mass transfer rate. Conversely, the response surface plot also suggested that although the kLa values initially increased with the enhancement of aeration rates, enhancement was not that significant at very high aeration rates. These observations could be further confirmed by comparing values from run numbers 7 and 4, yielding kLa values of 0.29 min−1 and 0.56 min−1, respectively, wherein higher aeration rates facilitated improved mass transfer (Table 2). In run numbers 16 and 18, although the air flow rate was almost doubled, the kLa values (1.3 min−1 and 1.4 min−1) were not evidently increased. This could be attributed to the fact that at high aeration rates, the impeller is unable to disperse all the gas impinging on it and may become flooded. Moreover, higher aeration rates reduce the gas bubble retention time, and thus limits oxygen transfer.12 As the oxygen flow rate is decreased, the impeller blades begin to process the gas and bubbles are dispersed towards the walls of the fermenter resulting in impeller loading. Thus, it may be concluded that neither low nor high air flow rates could solve the problems of inefficient mass transfer.
Fig. 2c depicts the effect of aeration and agitation values on kLa at specific impeller positions. The response surface plots have shown incremental gain in kLa values with the simultaneous enhancement of both of these variables. However, it showed a tendency to plateau at higher ranges of aeration and agitation values. Furthermore, a closer examination of the data (Table 2) showed that the increase in agitation value from 63 rpm to 400 rpm (run numbers 17 and 19) caused an increase in the kLa value from 0.28 min−1 to 1.4 min−1, whereas an increase in agitation from 400 rpm to 736 rpm (run numbers 1 and 19) increased the kLa value from 1.4 min−1 to 2.1 min−1, which was not so large as compared to previous runs (run numbers 17 and 19). This plateau trend can be attributed to the saturating effect of high agitation values. However, a slightly curved response plot for aeration values indicated a dominant agitation role on the response.
On comparing run numbers 16, 18 and 1, it was observed that aeration could not increase kLa values in run numbers 18 and 16, whereas high agitation resulted in enhanced kLa values, as shown in run numbers 16 and 1. This observation is in agreement with the previous report of Kim et al. (2002), which demonstrated the effect of agitation speed on pigment fermentation and reported that the kLa values increased gradually from 0.003 to 0.029 sec−1 as the rotational speed was increased from 200 to 700 rpm.24 In a similar study, Moscovici et al. (1996) reported that pullulan concentration increased with an enhancement in agitation rate.25 This favorable effect was attributed to improved oxygen mass transfer and/or changes in the percentage of yeast-like, unicellular cells, which are often considered to be the major producers of pullulan. Thus, agitation plays a prominent role in mass transfer because it contributes both to air bubble distribution as well as the mixing of the system. However, aeration only affects the retention time of oxygen flow with a corresponding increase or decrease in gas velocity in the broth at high or low rates of aeration, respectively.9
Most of the earlier studies aimed at enhancing the mass transfer capability of a fermenter by individually increasing agitation or aeration within a prefixed range.11,26–28 The effects of varying agitation or aeration values are observed on microbial performance, and the best optimal value is selected. However, these observations are generally aliased due to the univariate evaluation of the effects of agitation, aeration, and impeller type on kLa values. Roukas and Mantzouridou (2001) studied the effect of aeration rates only on pullulan production and observed that polysaccharide concentration increased significantly as aeration rates increased to 2 vvm, which then decreased at values higher than 2 vvm.11 Similarly, Göksungur et al. (2005) investigated the effects of aeration, agitation and sugar concentration on pullulan production using response surface methodology.27 However, the polysaccharide yield (17.2 g L−1) and productivity (0.18 g L−1 h−1) were very low even at the optimum levels of process variables (aeration rate, 2.36 vvm; agitation speed, 345.3 rpm; and initial sugar concentration, 51.4 g L−1). In contrast to these findings, Gibbs and Seviour (1996) studied the effects of agitation rate and oxygen saturation on polysaccharide production and found that pullulan yield was drastically reduced at higher agitation rates (≥750 rpm).28 Cell deformation and damage suffered as a result of high shear rates, could be the main reason for the reduction of metabolite production at high agitation rates.10 Gibbs's group further reported that polysaccharide production at high agitation rates could be enhanced by maintaining the partial pressure of oxygen at low levels during the initial phase of fermentation.28 All these reports suggested that increasing either agitation or aeration might not solve mass transfer issues. Moreover, to the best of our knowledge, none of the earlier reports have studied the impact of impeller spacing on mass transfer and pullulan production.
Unlike previous studies, the present report attempted to understand the cumulative effects of fermenter operating variables (such as aeration, agitation, and impeller spacing) on kLa in a fermenter with the help of a model developed in a Newtonian system through the employed statistical design (Table 2). Interestingly, in run numbers 13 and 15 (Table 3), kLa values obtained were almost comparable, although operating variables were far different from each other in both of the runs. In this case, the effect on kLa values, which was produced by a one-third reduction in agitation speed (600 rpm to 400 rpm), almost subsided or was compensated with a 46% increase in aeration values (0.75 vvm to 1.63 vvm) and a 44% increase in impeller separation (1.1′′ to 2.55′′). Similarly, in run numbers 17 and 7, a 70% decrease in agitation along with a nearly 50% elevation of aeration, as well as impeller separation, had achieved similar kLa values in the Newtonian system. The previously described correlation between operating variables and kLa values was not linear, suggesting that kLa values could not be enhanced in a fermenter by increasing only single variables such as agitation, aeration or impeller spacing; rather, a cumulative effect of all possible variables needs to be studied for proper evaluation of the effect on kLa values.
Run no. | Initial kLa values (min−1) | Final biomass concentration (g L−1) | Final EPS concentration (g L−1) | Total substrate consumption (%) |
---|---|---|---|---|
Optimized | 1.99 | 61.9 | 74 | 99 |
13 | 1.4 | 50 | 52 | 97 |
15 | 1.1 | 46 | 40 | 96.1 |
17 | 0.28 | 14 | 16.2 | 93.5 |
7 | 0.29 | 14.7 | 15.8 | 93.9 |
Fermentation processes with equal kLa values (0.28 min−1 and 0.29 min−1) demonstrated similar profiles for biomass, pullulan production and sugar consumption, irrespective of their operating conditions (Fig. 3a to d). Thus, a cumulative contribution of all variables was clearly reflected in the batch kinetics of pullulan fermentation.
A maximum biomass concentration of 61.92 g L−1 was obtained within 46 h of fermentation run when the cultivation was performed at a higher initial kLa value (1.99 min−1), whereas the cellular growth was reduced by nearly 18% and 77% when fermentation was executed at lower initial kLa values (1.4 min−1 and 0.28 min−1, respectively). A comparative growth curve plot for all batches (Fig. 3a) revealed that operation at higher initial kLa values supported the exponential growth rate of the microbe. A similar observation was reported by Himabindu and Gummadi (2015) during the fermentative production of xylitol by Debaryomyces nepalensis.29 The growth curve of cultures grown at an initial kLa value of 1.99 min−1 exhibited a plateau after 30 h of the fermentation run, whereas this plateau was previously observed at the 21st h in batches with initial kLa values of 0.29 min−1 and 0.28 min−1, suggesting an earlier onset of stationary phases at lower initial kLa values. Low oxygen availability cease the culture growth, and thus result in a remarkably low pullulan production.
Concomitant with cell growth, the glucose concentration of fermentation broth decreased prominently with increasing kLa values (Fig. 3b). Almost complete sugar depletion was observed at an initial kLa value of 1.99 min−1, whereas 3.0%, 3.9% and 6.5% of residual sugar were present in the other batches of 1.4 min−1, 1.1 min−1 and 0.28 min−1 kLa, respectively. This trend indicated that the glucose was efficiently utilized in cultures operating at optimum kLa conditions (1.99 min−1), compared with its lower counterparts (1.1 min−1, 1.4 min−1 and 0.28 min−1). Lazaridou et al. (2002) observed a similar trend and reported that the assimilation of sugars increased with oxygen availability during pullulan fermentation,30 which was directly related with oxygen transfer and it simultaneously increased with an increase in biomass and pullulan concentration.
Pullulan production followed a similar pattern of microbial growth, suggesting that pullulan was a growth-associated metabolite30 (Fig. 3c). The maximum pullulan concentration (74 g L−1) was obtained at the 46th h of fermentation executed at a kLa value of 1.99 min−1, wherein the maximum dry cell weight, as well as the lowest residual concentration (1%), was observed at a similar age. The higher initial kLa value (1.99 min−1) facilitated improved microbial growth and pullulan production with a maximum polymer yield and productivity of 0.47 g g−1 of substrate consumed and 1.61 g L−1 h−1, respectively, whereas the batches operated at the initial kLa values of 1.4 min−1, 1.1 min−1 and 0.28 min−1 exhibited lower pullulan concentrations of 52 g L−1, 40 g L−1 and 16.21 g L−1, respectively, along with lower sugar assimilation rates, and in turn led to lower polymer yields (0.33 g g−1, 0.26 g g−1 and 0.11 g g−1, respectively) (Table 5). This observation is in accordance with the previous reports on pullulan fermentation.30,31 Lazaridou et al. (2002) stated that biomass level and polysaccharide concentration increased significantly with oxygen availability and that the highest concentration of polysaccharide (49 g L−1) was obtained in the culture grown at 700 rpm, whereas in cultures grown at 300 and 500 rpm, the maximum concentration of pullulan was 34 g L−1 and 43 g L−1, respectively.30
Similarly, Rho et al. (1988) observed that a high oxygen transfer rate or high kLa favored both cell growth and pullulan synthesis,31 which was indicated by a continuous increase in biomass concentration under the highest simulated oxygen transfer condition, e.g. in the Erlenmeyer flask containing the smallest medium volume. Moreover, this group demonstrated that the pullulan synthesis rate and pullulan yield were directly proportional to the oxygen availability. Broth viscosity also increased as kLa values were increased, which was due to the continuous enhancement in biomass and pullulan concentrations till 46 h at high kLa values (ESI Table S1†). A high initial kLa value (1.99 min−1) facilitated improved mass transfer rate, which ultimately resulted in significantly higher viscosity of 25.95 cP after 46 h due to enhanced pullulan production. However, at lower kLa values (1.1 min−1 and 0.29 min−1), viscosity was reported to be comparatively low, i.e. 16.41 cP and 5.76 cP, respectively, at the 46th h.
Fig. 3d shows the dissolved oxygen (DO) concentration (as the percentage of air saturation) profiles in the broth during the fermentative production of pullulan under different kLa conditions. It was observed that in the case of lower initial kLa values, namely, 0.29 min−1 and 0.28 min−1, the DO concentration falls rapidly to a low level (below 20%) within 5 to 8 h, and then remains constant until the end of fermentation. In case of 1.1 min−1 and 1.4 min−1 kLa, DO concentration dropped to a very low level (9% and 4%, respectively) within 12 h and 10 h, respectively, and then remained constant. Conversely, at a high initial kLa value of 1.99 min−1, the decrease in DO level was more gradual, and it was possible to maintain DO within 20–40% of the range because of improved mass transfer in this case. This observation suggested that oxygen availability throughout the entire fermentation process resulted in improved pullulan production.
Interestingly, the maximum specific growth rates (μmax) of the microbe were also increased from 0.046 h−1 to 0.084 h−1 when initial kLa values were enhanced from 0.28 min−1 to 1.99 min−1, respectively (Fig. 4). Previously, Gibbs and Seviour (1996) reported that the organism's growth rate (μ) was slower at 125 rpm, which may be a reflection of a reduced initial kLa values at low agitation rates.28 The actual oxygen transfer to the cells was reduced at a low agitation rate that caused the large air-bubble size and poor bubble breakup, leading to the formation of viscous, non-stirred zones. Reduced mass transfer to cells could affect the organism's growth and biopolymer yield by blocking nutrient transfer and its consumption by the cells.11 Batch productivity data also supported the importance of high kLa value implication in enhancing pullulan production. Fig. 4 illustrates the comparative account of batch productivity, product yield and μmax at various kLa values. All these findings suggest that metabolite production by A. pullulans becomes enhanced under high oxygen transfer conditions, which is in accordance with previous reports.27,31
Therefore, it may be suggested that enhanced kLa conditions in the fermenter are responsible for the improvement in pullulan fermentation, which is attributed to the improved oxygen mass transfer.
Interestingly, the microscopic analysis of microbial samples grown at the same initial kLa values revealed that both the sets of samples displayed similar cellular morphology despite differences in other operating conditions. Furthermore, cell morphology analysis in pullulan fermentation batches revealed that the optimized pullulan batch (kLa 1.99 min−1) supports the formation of the swollen cell morphology of microbe (Fig. 5a), whereas in the case of pullulan batches with the lowest initial kLa (0.28 min−1), swollen cells were scarce (Fig. 5b). Previously, Campbell et al. (2004) reported that the swollen cellular morphology of A. pullulans were mostly responsible for pullulan production.32 Similar observations have also been reported by other researchers.11,33 These reports are in line with the observations made in the present study, in which conditions yielding to higher kLa values resulted in a greater number of swollen cells with regard to higher pullulan production.
Fig. 5 Comparative morphological analysis of Aureobasidium pullulans grown under various kLa conditions: (a) higher kLa (1.99 min−1); (b) lower kLa (0.28 min−1). |
Reference | Operating conditions | Carbon source | Fermentation time (h) | Pullulan concentration (g L−1) | Product yield (Yp/s) | Productivity (g L−1 h−1) |
---|---|---|---|---|---|---|
Present study | Agitation-600 rpm, aeration-2.5 vvm | Glucose | 46 | 74 | 0.47 | 1.61 |
9 | Agitation-200 rpm, aeration-1.25 vvm | Sucrose | 72 | 4.76 | 0.16 | 0.07 |
28 | Agitation-250 rpm, aeration-0.4 vvm | Glucose | 140 | 11.27 | 0.37 | 0.08 |
30 | Agitation-700 rpm, aeration-0.23 vvm | Beet molasses | 144 | 49 | 0.49 | 0.34 |
11 | Agitation-200 rpm, aeration-2 vvm | Sucrose | 144 | 30 | 0.6 | 0.20 |
27 | Agitation-345.3 rpm, aeration-2.36 vvm | Sucrose | 96 | 17.2 | — | 0.18 |
35 | Agitation-150 rpm, aeration not mentioned | Sucrose | 168 | 22.6 | 0.32 | 0.13 |
36 | Agitation-200 rpm, aeration-1.5 vvm | Sucrose | 168 | 25.8 | 0.35 | 0.15 |
34 | Agitation-800 rpm, aeration-1.3 vvm | Sucrose | 60 | 39 | — | 0.65 |
18 | — | Glucose | 96 | 70.43 | 0.45 | 0.73 |
33 | Aeration-1.93 vvm (airlift bioreactor) | Sucrose | 128 | 38.77 | 0.402 | 0.30 |
Earlier reports suggested that, neither high agitation nor high aeration rates have supported high yield and productivity during pullulan production.11,27,28 Poor mass transfer is one of the major problems that often leads to lower yield and productivity in the viscous fermentation system. However, none of the previous reports investigated the cumulative effect of all three operating variables, particularly agitation, aeration and impeller spacing, on mass transfer with regard to pullulan production. In the present study, it was possible to obtain a remarkably high pullulan concentration, 74 g L−1, within 46 h of fermentation time at 600 rpm. The batch productivity (1.61 g L−1 h−1) obtained in the present study was also significantly higher than that in previously published reports, and the product yield obtained was reasonably good. The aforementioned comparisons suggested that the improvement in pullulan production could be achieved by applying the model developed using a conjoint and multivariate optimization of selected variables.
Footnotes |
† Electronic supplementary information (ESI) available. See DOI: 10.1039/c5ra03715h |
‡ Authors have contributed equally. |
This journal is © The Royal Society of Chemistry 2015 |