Comparative study on confinement effects of graphene and graphene oxide on structure and dynamics of water

Meymanat Zokaie and Masumeh Foroutan*
Department of Physical Chemistry, School of Chemistry, College of Science, University of Tehran, Tehran, Iran. E-mail: foroutan@khayam.ut.ac.ir; Fax: +98 21 66495291; Tel: +98 21 61112896

Received 27th February 2015 , Accepted 23rd April 2015

First published on 24th April 2015


Abstract

In this work, we compared the structural and dynamical properties of water confined between two graphene oxide (GO) sheets with water confined between two graphene sheets through molecular dynamics simulations. Our results showed how the structure and dynamics of the water near the GO surfaces changes under confinement conditions. Different orientations of the water molecules to the GO sheets confirm the heterogeneous nature of the confined water. The density distribution of water near the GO sheets is different from the graphene surfaces due to the presence of hydrophilic functional groups of the GO sheets. Also, the hydrogen bonds between the water molecules are disturbed due to the presence of these groups on the GO surfaces. The results showed that as water molecules in areas which are close to the GO surfaces are isolated, and due to hydrogen bond formation between water molecules and the substituents of the GO, the water molecules have fewer hydrogen bonds with other water molecules around. In the middle region between two GO sheets, it has been seen that each water molecule is surrounded by more water molecules, and there are many more hydrogen bonds, so it is possible to consider a network structure of water in this region. There is a good quantitative agreement between experiments and the above mentioned results. These results were confirmed by the calculated coordination number, radial distribution functions and mean square displacements.

1. Introduction

The properties and features of a substance become different when the sample size is reduced to the nanometer scale. Such different features are due to the interactions of that substance with the surfaces in which the substance is confined inside a small volume. In recent years, structural and dynamical properties of water in real confined systems, like water in rocks, in sandstone, and in biological cells have been studied.1 Despite the simple molecular structure of water, it has unique physical properties, especially in biological systems.2 The behavior of water in confined environments has a range of potential applications in chemistry, biology, electrochemistry,3 and other fields of science. The behaviors of confined water inside nanometer-sized spaces are very different from the bulk. Several experimental techniques are used in order to study properties of confined water such as surface force apparatus,4 differential scanning calorimetry,5 neutron diffraction,6 and nuclear magnetic resonance techniques.7

Recently the structure of water molecules in a hydrophobic nanometer-sized pore has been studied experimentally with X-ray diffraction.8,9 Based on the result obtained, the numbers of nearest-neighbor molecules of the confined water are less than those of the bulk liquid. Confinement leads to sharp peaks that exist in the X-ray diffraction spectra while there are no sharp peaks in spectra of bulk water. These results directly reflect the formation of ice-like structures of water in the hydrophobic nanometer-sized pores. Compared with problems that may exist in the interpretation of experimental results of confined fluids such as microscopic structure and dynamics interpretations, computer simulations are a valuable tool for describing the properties of these fluids. A great number of studies have focused on the simulations of water in confinement environments. Mosaddeghi et al.10 carried out molecular dynamics (MD) simulations to investigate the behavior of confined water between two graphite surfaces. Their results showed that the anisotropic properties of confined water phase depend on the distance between two graphite surfaces. The anisotropy resulted from the nonhomogeneous structure of confined water in the directions parallel and perpendicular to the graphite sheets. Cicero et al.11 have performed MD simulations of the structure and dynamics of confined water in carbon nanotubes and graphene sheets. They observed that the microscopic structure of a layer of water at a distance of 5 Å from the confined surface is independent from the confinement distances. Song et al.12 have investigated the structure and dynamics of water confined between hydrophobic and hydrophilic surfaces. Their results showed that at each of the two hydrophobic surfaces, there is no surface-solvent hydrogen bonding at the interface. On the other hand, at the hydrophilic surfaces, the bond is stronger than it in the bulk solvent. The effects of surface on the properties of confined water between two hydrophilic surfaces of hydroxylated silica and mica have recently been studied.13 Although both of the surfaces are hydrophilic, main difference of these is related to the ionic nature of mica surface owing to the presence of K+ ions. The presence of OH groups on the hydroxylated silica surface increases hydrogen bond network next to the surface, because of the establishment of hydrogen bond between water molecules and OH groups of the surface.

In this work, we have studied confined water between two GO surfaces and at the beginning, some properties of GO and confined water between GO surfaces is mentioned. One of the applications of GO is in humidity sensors, which are of great importance in agricultural, industrial, and human activities. The functional groups containing oxygen of GO surfaces can increase the hydrophilicity of GO and consequently improve the sensitivity of the sensors to water. Furthermore, these groups can make GO electrically insulating, which enables GO to incorporate into capacitive sensors. Bi and co-workers14 have fabricated a microscale capacitive humidity sensor with an ultrahigh sensibility, a fast response time, and recovery time in comparison with typical capacitive sensors.

Due to its high ability to disperse in water, GO is a hydrophilic material; and due to layered structure formation of GO in water, it is convenient to consider that as a model to study confined water between hydrophilic surfaces. GO is a single-layered of graphite oxide which is obtained from the intense oxidation of graphite. This process involves the increase of oxygen-containing groups in the interlayer space. The embedded oxygen decreases van der Waals forces that hold the layers of graphene in graphite together, and therefore increases the distance between the layers. The oxygen–carbon bonds alter hybridization of carbon atoms from sp2 to sp3.15–18 Depending on the oxidation conditions during the preparation process, these GO layers may contain various values of oxygen. Different structures have been reported for the GO. It is because of different details of oxidation process. Based on chemical reasoning of X-ray diffraction and spectroscopy, at least five models of different structures have been presented.19–23 Accepted structural model for the GO is based on the analyses done by Lerf et al.24 These analyses show that the functional groups of the surface of the GO mainly consist of hydroxyl and epoxide groups. There are a small number of carboxyl groups in the sheets edge of the GO. Also, quantum computations have shown that energetically proper GO structure is the aggregation of hydroxyl and epoxy groups together with regions which only have sp2 carbon atoms.25 Recently, dynamics of water in the GO have experimentally been investigated by Colmenero et al.26 which their results will be given in the next sections.

2. Computational methods

In this study, the applied GO is one-layered with a number of 840 carbon atoms, with OH and epoxide functional groups of both sides. All MD simulations have performed with LAMMPS.27 We have used OPLS-AA potential that has been successfully used for simulation of GO.28 Recently, ReaxFF as a realistic reactive method has been used in MD simulation of graphene oxide by Medhekar.29 We didn't use it because of its high computational cost. In our work, the geometry optimization was performed using the hybrid B3LYP functional that has been recently used for GO.30 The Gaussian 03 program was employed with the internally stored 3-21G basis set. The obtained partial charges for oxygen and hydrogen atoms of hydroxyl group are −0.524 and 0.328 and for oxygen atom epoxy group is equal to −0.4. These values are in agreement with partial charges of OPLS-AA reported by Jorgensen.31

A TIP4P/Ice32 model was used for the water molecules. This model reproduces many properties of water properly. For example, the predicted value of density of water is equal to 0.993 g cm−3 at T = 298.15 K and P = 1 atm that is in good agreement with the experimental data. The shake algorithm was used to reduce the high-frequency vibrations related to stretching terms between oxygen and hydrogen atoms. Both van der Waals and electrostatic interactions were considered between water and the GO.30 The van der Waals forces were calculated by using a 10 Å cutoff, and long-range electrostatics interactions were handled using the Ewald summation method. The velocity-Verlet algorithm was used to integrate the dynamical equations of motion with a time step of 1 fs.

Initial configuration of our system consists of two parallel surfaces of GO that are fixed at a distance of 20 Å and along the XY plane. 1364 water molecules filled the space between two surfaces of GO randomly in the area of LZ. A space of 28 Å was placed in the above and below of the nanopore. Initially, the system was equilibrated for 1 ns in the NVT ensemble at T = 298.15 K. Temperature was controlled using a Nose'-Hoover thermostat with a relaxation time of 1.0 ps. The production runs was conducted in the NVE ensemble for 10 ns. With comparison with similar work, it is enough time to extract general structural and dynamical properties of water in the confined space.10 It should be noted that for calculating the density of confined water, effective length was considered along Z axis.10 A similar system, only consist of graphene surfaces, was also run for comparison with GO system. Fig. 1, shows the configuration of the simulated system consists of confined water between two GO surfaces.


image file: c5ra03575a-f1.tif
Fig. 1 Configuration of the simulated system consists of confined water between two GO surfaces. Pink, blue, and white colors correspond to carbon, oxygen, and hydrogen atoms, respectively.

3. Results and discussions

To determine the structure of confined water molecules, the density of water molecules between two confining surfaces was calculated. Also, further analyses were done by calculating the angle of the dipole moment vector of water molecules, the number of hydrogen bonds, the radial distribution functions, and the coordination number. The dynamic behavior of water was also studied by investigating the mean-square displacements of water molecules. At all figures, G and GO refer to graphene and graphene oxide, respectively.

3-1. Density profiles

Fig. 2a presents the density profile of oxygen atoms of water molecule confined between two surfaces of graphene (dashed line) and two surfaces of GO (solid line). In both cases, the density next to the surfaces is more than it in near the center. In the density profile three different bunches of water molecules can be seen. In the region between −2.5 Å to 2.5 Å, in the center to confinement surfaces of the GO, a straightforward line can be seen, and also the amount of density is in agreement with the bulk water density. At the distance of 2.5 Å to 5.4 Å, (also at the distance of −2.5 Å to −5.4 Å) one peak is observed in the midsection of both graphene and GO. The height of this peak in the graphene is more than that for the GO. Also, one peak with maximum height in the region between 5.4 Å to 7.2 Å (and −5.4 Å to −7.2 Å) next to the confining surfaces can be seen. There is no water molecule at the distance of 2.5 Å from graphene and GO surfaces. This is because of the repulsion effects causing by water molecules interactions with the confining surfaces. As it can be seen in the Fig. 2a, layered effects concerning the water confined between two graphene surfaces are more severe than those of GO. Moreover, Fig. 2a shows that the height of peaks in the GO is less than that in the graphene, particularly for the peak next to the surface. This is because in the presence of substituent groups of GO – it will be clarified later – water network cannot form near the confining surfaces. In fact, it can be concluded that substituent groups cause hydrogen bonds of water network to get disrupted. Fig. 2b and c show snapshot images of the water molecules confined between two graphene and GO surfaces, respectively at the end of 10 ns simulation time.
image file: c5ra03575a-f2.tif
Fig. 2 (a) Z-density distribution of oxygen atoms of water molecule confined between two graphene surfaces (dashed line) and two GO surfaces (solid line). Snapshot images of the water molecules confined between two graphene surfaces (b) and two GO surfaces (c) at the end of the simulation time. Green, red, and blue colors correspond to carbon, oxygen, and hydrogen atoms, respectively.

3-2. Orientational ordering of water molecules

In addition to making layered distribution of water molecules between two confining surfaces that has been shown by the density profile of oxygen atoms (see Fig. 2a), the presence of confining surfaces cause “orientational ordering”,33 which has been shown by the diagram of 〈cos(θ)〉, where θ is the angle between dipole moment vector of water molecules and the perpendicular vector to confining surfaces (it has to be noticed that in completely isotropic atmosphere, for example, bulk water, 〈cos(θ)〉 is zero). In Fig. 3, 〈cos(θ)〉 with respect to confining surfaces has been presented. Predictably, in various distances to confining surfaces, the water molecules have varied orientations. The increase of distance from the confining surfaces reduces the orientational ordering, so that in the central region of the confined system, which water molecules behave almost similar to bulk water, there is no particular orientation for water molecules, and 〈cos(θ)〉 is equal to zero.
image file: c5ra03575a-f3.tif
Fig. 3 Orientational ordering, 〈cos(θ)〉, of water molecules as a function of distance from confining surfaces. Inset in figure: cartoon depicting orientation of water molecules at the surface.

3-3. Number of hydrogen bonds

To define a hydrogen bond between two water molecules i and j, the geometric criteria consist of distances and angles were used. (i) The distance of ROO between the oxygen of two water molecules i and j become less than 3.2. (ii) The distance of ROH between the oxygen of water molecule i and the hydrogen of molecules i and j become less than 2.4. (iii) The angle between ROO and ROH, φ, become less than 30°. The values of ROO and ROH have been calculated according to the first minimum in the O–O and H–H radial distribution function of water molecules. This method is a reliable method and has been used in other papers.34,36,38 Fig. 4 shows necessary parameters to determine of number of hydrogen bonds among water molecules. Since pivotal objective in this work is to find out how the hydrogen bonds among water molecules can get affected in the presence of GO confining surfaces as well as graphene surfaces, the number of hydrogen bonds formed between functional groups of the GO sheets and water molecules calculated.
image file: c5ra03575a-f4.tif
Fig. 4 Schematic parameters for the determination of number of hydrogen bonds among water molecules. Red and white colors correspond to oxygen and hydrogen atoms, respectively.

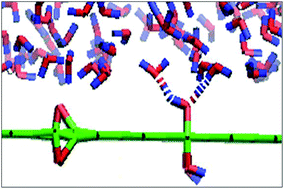
Fig. 5 shows the number of hydrogen bonds between water molecules confined in two GO surfaces and also two graphene surfaces as a function of the distance between two sheets. Also, the number of hydrogen bonds between water molecules and functional groups of GO surface are shown in green color. The number of hydrogen bonds among water molecules in the GO system is equal to 1450. This number is less than the number in the graphene case. The number of hydrogen bonds between water molecules – at varied distances of confining surfaces of GO – proves that the increase of distance from confining surfaces causes more hydrogen bonds among water molecules. Note that although water density reaches its maximum number – even in the nearest distance from the surface (layer 1) – the average number of hydrogen bonds is 151, and this amount is the fewest number in any other regions. This is because there is the confining surface which causes disruption in the network of hydrogen bonds among water molecules. As a consequence, changes in the number of hydrogen bonds are mainly owing to confinement conditions. Similar behavior has been reported for water confined in silica cylindrical nanopore35 and carbon nanotubes,36 the number of hydrogen bonds among water molecules decline in the direction of nanopore radius. This feature of water is independent from the type of interaction which occurs between water molecules and confining surfaces (hydrophobic or hydrophilic surfaces). This has been recorded for some confining surfaces previously.37–41 Snapshot of the formation of hydrogen bond between water molecules and the hydroxyl substituents of GO was given in Fig. 6.


image file: c5ra03575a-f5.tif
Fig. 5 Number of hydrogen bonds of water molecules confined between two GO surfaces and also between two graphene surfaces.

image file: c5ra03575a-f6.tif
Fig. 6 The snapshot of the formation of hydrogen bond between water molecules and the hydroxyl groups of the GO. Red, blue, and green colors correspond to oxygen, hydrogen, and carbon atoms, respectively. Dashed line show the hydrogen bond.

3-4. Radial distribution functions

Radial distribution function (RDF) can give beneficial information concerning the structure of confined water, especially next to the confining surfaces. Fig. 7 shows the oxygen–oxygen (O–O) and oxygen–hydrogen (O–H) RDFs for confined water molecules between two GO surfaces as well as graphene surfaces and bulk water. For bulk water, the O–O RDF has a strong peak at the distance of 2.74 Å, and also the first peak in the O–H RDF is observed at the distance of 1.74 Å. These data are consistent with previous experimental data.42 In both of the confined systems and the bulk system, the first peak of the O–O RDF appears at the distance of 2.7 Å. This shows that intermolecular distance for the nearest neighbor of water does not change under the confinement circumstances. These peaks in the O–O RDF for graphene and GO have less width and are sharper than the bulk water. In addition, the intensity of peak in the area between 3 Å to 4 Å is different from bulk water. This event can be assigned to the disruption of hydrogen bond network.
image file: c5ra03575a-f7.tif
Fig. 7 RDFs of water molecules confined between graphene surfaces as well as the GO surfaces and bulk water. (a) O–O RDFs. (b) O–H RDFs.

In the case of O–H RDF, the width of second peak at 3.1 Å for confined systems and bulk water are nearly the same. The graph of the RDF is unable to produce comprehensive data about the structure of water in various layers. This is due to the different structures of water in the layers at various distances to confining surfaces. So, water molecules between confining surfaces have been categorized into three layers – based on the data of density profile along the Z-axis (see Fig. 2a). The first layer consists of the water molecules which their Z positions are from 5.4 Å to 10 Å. The Z positions of the water molecules at the second layer are from 2.5 Å to 5.4 Å. The third layer, that is called middle layer, is the intermediate zone between two confining surfaces from 2.5 Å to −2.5 Å. We will continue through scrutiny mentioned regions.

3-4-1. First layer. The O–O and O–H RDFs for the nearest layer to confining surfaces can be seen in Fig. 8. The second peak of the O–O RDF for both confined systems compared to the bulk water has decreased and shifted to the right. Unlike the O–O RDF, the main peaks of the O–H RDF have located at similar distances for three systems. The first and the second were appeared at 1.8 Å and 3.2 Å, respectively. As the obtained results shows the confining graphene oxide effects on hydrogen bonding between water molecules specially in regions near to graphene oxide so that the presence of confining surfaces cause “orientational ordering”, Predictably, in various distances to confining surfaces, the water molecules have varied orientations. Therefore there are some differences between the second peak of the O–O RDF for ordered confined systems compared to the bulk water. Similar behavior has been reported in some papers.43–45
image file: c5ra03575a-f8.tif
Fig. 8 RDFs for (a) O–O and (b) O–H of water molecules confined between the surfaces of graphene as well as the GO for the nearest layer to confining surfaces. RDF for O–O of bulk water is given for comparison.
3-4-2. Middle layer. Fig. 9 shows the O–O and O–H RDFs for middle layer of water molecules confined between the surfaces of the GO and graphene. As can be seen in Fig. 9, in this region the effect of surface decrease and water molecules almost behave like bulk water. The maximum point of the second peak in O–O RDF for both confining surfaces is similar to the place of that in bulk water and was located near 4.1 Å.
image file: c5ra03575a-f9.tif
Fig. 9 RDFs for (a) O–O and (b) O–H of water molecules confined between the surfaces of graphene as well as the GO for the middle layer between two confining surfaces. RDF for O–O of bulk water is given for comparison.
3-4-3. Comparison of O–H RDFs in different layers. Fig. 10 shows the RDFs for O–H of water molecules in varied layers from confining surfaces. The intensity of the first peak for three layers shows that in the layer next to the confining surfaces (first layer), the height of the peak is about 2.5. The average of hydrogen bonds in the first layer is fewer than that of it in the center, and the hydrogen bonds that are formed at the further distances from the first layer get more. This can be because of the presence of functional groups in the GO that causes disruption in the formation of hydrogen bonds between water molecules.
image file: c5ra03575a-f10.tif
Fig. 10 RDF for O–H of water molecules for different layers between two confining surfaces of the GO. The third layer is related to the middle area of confined system. The first and second layers are next to the surfaces, respectively.

Fig. 11 shows the RDF between the oxygen atom of water molecules and hydrogen atom of hydroxyl group of the GO. In addition, the RDF of oxygen–hydrogen for the water molecules related to the first layer is presented in Fig. 11 for comparison. It presents that the height and the maximum location of the first peaks and the second peaks are different, which shows the nature of hydrogen bonds between water molecules in the first layer, and hydrogen bonds between water molecules and functional groups of GO are not identical. The maximum of the first peak and the second peak in the RDF between oxygen atoms of water molecules and hydrogen atoms related to hydroxyl group of the GO surface is located at the height of 4.5 and 1.8, respectively. Also, the maximum of the first peak and the second peak in the RDF of oxygen–hydrogen related to the first layer is located at the height of 2.76 and 4.05, respectively.


image file: c5ra03575a-f11.tif
Fig. 11 RDF between oxygen atoms of water molecules and hydrogen atoms related to hydroxyl group of the GO surface (solid line), and the RDF of oxygen–hydrogen for the water molecules related to the first layer (dashed line).

As the Fig. 11 shows in the RDF of oxygen–hydrogen for the water molecules related to the first layer, the second peak is higher than the first peak. This is in agreement with experimental data reported by Soper.46

3-5. Mean square displacement (MSD)

Fig. 12 shows the MSD for water molecules at the temperature of 300 K in three dimensions; parallel to the confining surfaces (MSDII = MSDX + MSDY) and perpendicular to the confining surfaces (MSDZ). The MSD of bulk water at the temperature of 300 K is given for comparison. For the both confined systems, the mean square displacement of water molecules along the Z axis is low. This is because geometric distance for movement in the direction of Z is less than that for movement along the X and Y axes. As Fig. 12 shows, the slope of MSD of bulk water is more than that for confined water. As Fig. 12a shows, the effects of confinement conditions on the mobility of molecules along the Z axis are observable in the MSD. As can be seen, the MSDZ for both systems at a short distance increases dramatically, and then shows a straightforward line at a long time. Given the confinement of the measurement of system along the perpendicular to confining surfaces, it can be resulted that there is no long-range penetration along the perpendicular to the confining surfaces.
image file: c5ra03575a-f12.tif
Fig. 12 MSD of water molecules between two confining surfaces and bulk at 300 K. (a) In the parallel dimension to the confining surfaces. (b) In the perpendicular dimension to the confining surfaces.

The MSDII increases with a less slope but stable slope during the time than the bulk water. The cause of this less slope is that the mobility of water molecules decreases due to the interaction with surfaces, and this decrease is more in the GO surface because of the hydrophilic interactions of water molecules with the groups exist in the surface of the GO. These results are in agreement with those reported by Bonnaud,47 who studied the water confined inside hydroxyl silica nanopore which is considered as a hydrophilic surface. For better comparison, the MSD of water molecules confined between two surfaces of GO at different dimensions has been calculated and presented in Fig. 13. Due to the smaller geometrical distance available for motion in the Z-direction with respect to X and Y-directions, the MSD of water molecules in that direction is smaller. Fig. 14 shows that the mobility of water molecules in the region next to the surface is smaller than it in other regions. It can be because of the specific orientation of molecules and the establishment of hydrogen bond with functional groups of confining surfaces. As the Fig. 14 shows the slope of blue line (layer1) starts to decreases after time >300[thin space (1/6-em)]000 Ps and then to increases after time >350[thin space (1/6-em)]000 Ps. This behavior has been observed and reported for water confined between two graphene sheets in ref. 10.


image file: c5ra03575a-f13.tif
Fig. 13 MSD of water molecules confined between two GO surfaces at different dimensions.

image file: c5ra03575a-f14.tif
Fig. 14 MSD of water molecules confined between two GO surfaces at different layers to the confining surfaces.

3-6. Coordination number of water molecules

We calculated coordination number for confined water molecules between two GO sheets using the RDF of O–O. Also, we obtained the coordination number for bulk water equals to 4.7, which is in a good agreement with experimental data and simulation calculations.48,49 Fig. 15 shows coordination number at different distances from the confining surfaces of GO. Fig. 15 shows that with the increase in the distances from confining surfaces, coordination number increases, and in the central region this number is 3.8 that is more than other regions. This proves that in this midsection between confining surface, there are more molecules around each water molecule. Since the number of hydrogen bonds in this region is more than other regions, the structure of water in this range can be called network water. In the area next to the surface, coordination number reaches 2 that is the lowest value. Water molecules in this area are isolated, and have fewer hydrogen bonds with water molecules around them. Although water molecules between these two regions are less affected by confining surfaces, they have different behavior with bulk.
image file: c5ra03575a-f15.tif
Fig. 15 Coordination number of water molecules as a function of distances between two GO sheets.

It seems that there is a good quantitative agreement between above results and experimental results of Colmenero et al.,26 who have experimentally investigated the dynamics of water in the GO. Their studies show that the stretching band peaks of OH appear in the three regions (i) a peak at about 3200 cm−1 that suggests tetrahedral coordinated hydrogen-bonded of water molecules. In this region, the bulk structure of water is called network water. (ii) a peak at the range of 3600 cm−1 that suggests water molecules with weak hydrogen bond in higher frequencies, and represents small water aggregations or isolated water molecules. (iii) between these two above-mentioned ranges there are water molecules that appear at 3400 cm−1, and reflect the water interactions with its surroundings. It has been indicated that some of the water molecules trap in the space of between functional groups or attached groups to the edges of the GO which leads to more water adsorption and forms three-dimensional clusters.

At first glance, the comparison of Fig. 2a and 15 may seem somewhat confusing. As Fig. 2a shows the value of density near confining sheets is the highest (∼1000) but the coordination number has its lowest value (∼2) according to Fig. 15. It can be explained by Fig. 5. As mentioned before, Fig. 5 shows the number of hydrogen bonds between water molecules confined between two GO sheets and also the number of hydrogen bonds between water molecules and functional groups of GO surfaces. The number of hydrogen bonds among water molecules in the GO system is equal to 1450. Although water density reaches its maximum number in the nearest distance from the surface (layer 1) as Fig. 2a shows, the average number of hydrogen bonds is 151. This is because there is the confining surface which causes disruption in the network of hydrogen bonds among water molecules. As a consequence, changes in the number of hydrogen bonds are mainly owing to confinement conditions. So, the behavior of number of hydrogen bonds in Fig. 5 is in agreement with the behavior of coordination number in Fig. 15.

4. Conclusions

The confined water molecules between GO and graphene surfaces has been studied using MD simulation. Calculated density profiles, orientational ordering of water molecules, number of hydrogen bonds, RDFs and MSDs have been used to describe the structural and dynamical properties of the water confined between GO and graphene sheets. Obtained results confirm the heterogeneous structure of confined water molecules. Water molecules have different orientations at various distances from the confining surfaces. In the nearest layer to the surfaces, water density has a maximum value. However, number of hydrogen bonds among water molecules is fewer than it in any other regions. This is because of the existence of confining surfaces that cause disruption in hydrogen bond network between water molecules. Also the effect of confinement conditions on the mobility of water molecules along the Z-axis of the MSDs is observable. Water molecules next to the confining surfaces are more affected by the surfaces and owing to the formation of the hydrogen bond between water molecules and functional groups of confining surfaces in this region, the number of hydrogen bonds between water molecules decreases. Three factors, including less mobility, fewer hydrogen bonds among water molecules, and low coordination number of water molecules indicate that water molecules are isolated, while at the middle region between two confining surfaces, water molecules behave like bulk water.

References

  1. G. A. Mansoori and S. A. Rice, Chem. Phys., 2014, 156, 73 Search PubMed.
  2. F. Franks, Biochemistry, Biophysics at Low Temperatures, Cambridge University Press, Cambridge, 1985 Search PubMed.
  3. J. K. Brennan, T. J. Bandosz, K. T. Thomson and K. E. Gubbins, Colloids Surf., A, 2001, 539, 187 Search PubMed.
  4. H. K. Christenson, R. G. Horn and J. N. Israelachvili, J. Colloid Interface Sci., 1982, 88, 79 CrossRef CAS.
  5. C. Faivre, D. Bellet and G. Dolino, Eur. Phys. J. B, 1999, 7, 19 CrossRef CAS.
  6. J. C. Dore, M. Dunn, T. Hasebe and J. H. Strange, Colloids Surf., 1989, 36, 199 CrossRef CAS.
  7. D. W. Aksnes and L. Gjerdakbr, J. Mol. Struct., 1999, 475, 27 CrossRef CAS.
  8. T. Iiyama, K. Nishikawa, T. Otowa and K. Kaneko, J. Phys. Chem., 1995, 99, 10075 CrossRef CAS.
  9. T. Iiyama, K. Nishikawa, T. Suzuki and K. Kaneko, Chem. Phys. Lett., 1997, 274, 152 CrossRef CAS.
  10. H. Mosaddeghi, S. Alavi, M. H. Kowsari and B. Najafi, J. Chem. Phys., 2012, 137, 184703 CrossRef PubMed.
  11. G. Cicero, J. C. Grossman, E. Schwegler, F. Gygi and G. Galli, J. Am. Chem. Soc., 2008, 130, 1871 CrossRef CAS PubMed.
  12. S. H. Lee and J. P. Rossky, J. Chem. Phys., 1994, 100, 3334 CrossRef CAS PubMed.
  13. A. Malani, K. G. Ayappa and S. Murad, J. Phys. Chem. B, 2009, 113, 13825 CrossRef CAS PubMed.
  14. B. Hengchang, Y. Kuibo, X. Xiao, J. Jing, W. Shu, S. Litao, T. Mauricio and D. S. Mildred, Sci. Rep., 2013, 3, 2714 Search PubMed.
  15. W. S. Hummers and R. E. Offeman, J. Am. Chem. Soc., 1958, 80, 1339 CrossRef CAS.
  16. B. C. Brodi, Ann. Chem. Phys., 1860, 59, 466 Search PubMed.
  17. W. Scholz and H. P. Z. Boehm, Anorg. Allg. Chem., 1969, 369, 327 CrossRef CAS PubMed.
  18. T. Szabo, A. Szeri and I. Dekany, Carbon, 2005, 43, 87 CrossRef CAS PubMed.
  19. H. Thiele, Z. Anorg. Allg. Chem., 1930, 190, 145 CrossRef CAS PubMed.
  20. U. Hofmann, A. Frenzel and E. Csalan, Liebigs Ann. Chem., 1934, 510, 1 CrossRef CAS PubMed.
  21. A. Clauss, R. Plass, H. P. Boehm and U. Hofmann, Z. Anorg. Allg. Chem., 1957, 291, 205 CrossRef CAS PubMed.
  22. G. Ruess, Monatsh. Chem., 1946, 76, 381 CrossRef.
  23. T. Nakajima, A. Mabuchi and R. Hagiwara, Carbon, 1988, 26, 357 CrossRef CAS.
  24. A. Lerf, H. Y. He, M. Forster and J. Klinowski, J. Phys. Chem. B, 1998, 102, 4477 CrossRef CAS.
  25. J. A. Yan and M. Y. Chou, Phys. Rev. B: Condens. Matter Mater. Phys., 2010, 82, 125403 CrossRef.
  26. S. Cerveny, F. Barroso-Bujans, A. Alegria and J. Colmenero, J. Phys. Chem. C, 2010, 114, 2604 CAS.
  27. S. Plimpton, J. Comput. Phys., 1995, 117, 1 CrossRef CAS.
  28. C. J. Shih, S. Lin, R. Sharma, M. S. Strano and D. Blankschtein, Langmuir, 2011, 28, 235 CrossRef PubMed.
  29. N. V. Medhekar, ACS Nano, 2010, 4, 2300 CrossRef CAS PubMed.
  30. A. D. Deyoung, S. W. Park, N. R. Dhumal, Y. Shim, Y. Jung and H. J. Kim, J. Phys. Chem. C, 2014, 118, 18472 CAS.
  31. W. L. Jorgensen, D. S. Maxwell and J. Tirado-Rives, J. Am. Chem. Soc., 2008, 101, 065502 Search PubMed.
  32. J. L. F. Abascal, E. Sanz, R. García Fernández and C. Vega, J. Chem. Phys., 2005, 122, 234511 CrossRef CAS PubMed.
  33. S. Dewan, V. Carnevale, A. Bankura, A. Eftekhari, G. Fiorin, M. L. Klein and E. Borguet, Langmuir, 2014, 30, 8056 CrossRef CAS PubMed.
  34. P. Gallo, M. A. Ricci and M. Roverea, J. Chem. Phys., 2002, 116, 342 CrossRef CAS PubMed.
  35. C. Hartnig, W. Witschel, E. Spohr, P. Gallo, M. A. Ricci, M. Rovere, J. Mol. Liq., 2000, 85, 127 Search PubMed.
  36. M. C. Gordillo and J. Mart, Chem. Phys. Lett., 2000, 329, 341 CrossRef CAS.
  37. C. Y. Lee, J. A. McCammon and P. J. Rossky, J. Chem. Phys., 1984, 80, 4448 CrossRef CAS PubMed.
  38. S. B. Zhu and G. W. Robinson, J. Chem. Phys., 1991, 94, 1403 CrossRef CAS PubMed.
  39. E. Spohr, J. Chem. Phys., 1997, 106, 388 CrossRef CAS PubMed.
  40. J. X. Fang, W. H. Marlow, J. X. Lu and R. R. Lucchese, J. Chem. Phys., 1997, 107, 5212 CrossRef CAS PubMed.
  41. E. Spohr, C. Hartnig, P. Gallo and M. Rovere, J. Mol. Liq., 1997, 80, 165 CrossRef.
  42. A. K. Soper, ISRN Phys. Chem., 2013, 279463, 67 Search PubMed.
  43. M. Mrchesi, Chem. Phys. Lett., 1983, 97, 224 CrossRef.
  44. M. A. Ricci, F. Bruni, P. Gallo, M. Rovere and A. K. Soper, J. Phys.: Condens. Matter, 2000, 12, 345 CrossRef.
  45. P. Gallo, M. A. Ricci and M. Rovere, J. Chem. Phys., 2002, 116, 342 CrossRef CAS PubMed.
  46. A. K. Soper and C. J. Benmore, Phys. Rev. Lett., 2008, 101, 065502 CrossRef CAS.
  47. P. A. Bonnaud, B. Coasne and R. J. M Pellenq, J. Phys.: Condens. Matter, 2010, 22, 284110 CrossRef CAS PubMed.
  48. A. K. Soper, J. Phys.: Condens. Matter, 2007, 19, 335206 CrossRef CAS PubMed.
  49. A. H. Narten and H. A. Levy, J. Chem. Phys., 1971, 55, 2263 CrossRef CAS PubMed.

This journal is © The Royal Society of Chemistry 2015
Click here to see how this site uses Cookies. View our privacy policy here.