The hydrolysis of phenyl trifluoroacetate in AOT/n-heptane RMs as a sensor of the encapsulated water structure

O. Fernando Silva*a, Rita H. de Rossia and N. Mariano Correa*b
aInstituto de Investigaciones en Físico-Química de Córdoba, INFIQC-CONICET, Facultad de Ciencias Químicas, Departamento de Química Orgánica, Universidad Nacional de Córdoba, Ciudad Universitaria, X5000HUA, Córdoba, Argentina. E-mail: fersilva@fcq.unc.edu.ar
bDepartamento de Química, Universidad Nacional de Río Cuarto, Agencia Postal # 3, X5804ALH, Río Cuarto, Argentina. E-mail: mcorrea@exa.unrc.edu.ar

Received 26th February 2015 , Accepted 8th April 2015

First published on 8th April 2015


Abstract

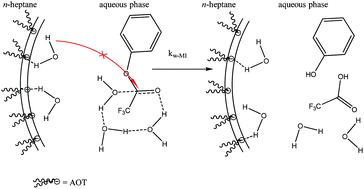
A study was carried out on the hydrolysis of phenyl trifluoroacetate (PTFA) in AOT/n-heptane/water reverse micelles. The results obtained have been interpreted by taking into account the distribution of the PTFA using a kinetic model based on the pseudophase concept and, it is demonstrated that the reaction takes place in the water pool of the reverse micelles. Moreover, it is established that the water molecules involved in the hydration of the interface do not react with PTFA or they do it at much slower rate compared with the water molecules that form the pool. The value of the second order rate constant in the water pool, kw–MI, is of the same order of magnitude as that in pure water but is greater (500 times) than those obtained in water–acetonitrile mixtures with low water content. We performed kinetic solvent isotopic effect (KSIE) and proton inventory experiments (PI) and we concluded that the water is acting as a general-base catalyst and the water sequestered in the water pool is pre-organized favoring the activation process, in contrast to what happened in water–acetonitrile mixtures.

Introduction

Carboxylic esters are among the most important functional groups in organic chemistry and play a central role in biochemistry.1 The mechanism of hydrolysis has been extensively studied under different reaction conditions and in different media. It is known that in the water-catalyzed hydrolysis of esters, the rate constants have a strong dependence on the water concentration; Neuvonen et al.2,3 demonstrated that the hydrolysis of substituted phenyltrifluoroacetate in water–acetonitrile mixtures with low water content shows exceptionally negative entropies of activation that indicates a mechanism in which a substantial increase in structuring of the solvent molecules occurs during the activation process, where the ester is preferentially solvated by acetonitrile and the polar transition state by water.2 On the other hand, Venkatasubban et al. have suggested that the hydrolysis of p-nitrophenyltrifluoroacetate involves a bifunctional catalysis (or general base catalysis) mechanism with three water molecules in the transition state;4 these results are in concordance with other obtained from studies of the neutral hydrolysis for p-methylphenyltrichloroacetate5 and 4-nitrophenylheptafluorobutyrate.6 Recently it has been demonstrated, using theoretical models that the bifunctional catalysis mechanism probably prevails in a low polarity non aqueous solution.7

Reversed micelles (RMs) are spatially ordered macromolecular assembly of surfactants formed in a non-polar solvent, in which the polar head groups of the surfactants point inward and the hydrocarbon chains point toward the non-polar medium.8,9 This systems contain aqueous nanodroplets entrapped in a film of surfactant and dispersed in a low polarity bulk solvent and the enclosed water has physical properties, such as polarity and viscosity, that are different from those of bulk water.10 These nanoscale aggregates are suitable media for processes that involve hydrophobic and hydrophilic reactants in a variety of chemical and biological reactions.8,11,12 The surfactant most frequently used is the anionic sodium 1,4-bis-2-ethylhexylsulfosuccinate (AOT, Fig. 1).13–18


image file: c5ra03532e-f1.tif
Fig. 1 Chemical structures of molecules used in this study.

A unique microenvironment for carrying out a variety of chemical and biochemical reactions is found in the polar cores of RMs which have also been used as model systems for studying various reactions in confinement.11,19–21 Despite their simplicity, they provide an excellent method to study fundamental effects of confinement. Moreover, the unique AOT interfacial properties, such as the “pH”,14,15,18 the ionic strength,9,10,15 micropolarity10 among others make the interfacial water molecules very interesting to be studied as reactant. The extensive use of RMs as nanoreactors for aqueous phase reactions requires precise knowledge of the states of the enclosed water. In this way, García-Río et al. studied the solvolytic behavior of substituted benzoyl chlorides and substituted phenyl chloroformates in AOT RMs.22–24 They have shown that benzoyl chlorides with electron-releasing groups react via a dissociative mechanism giving an acylium intermediate; by contrast, electron-withdrawing groups favor an associative mechanism involving a tetrahedral intermediate, similar to the solvolytic mechanism of substituted phenyl chloroformates, with the water addition step being rate determining. Depending on the water content in the RMs, they showed that the hydration of the anionic headgroups of the surfactants increases the electron density on the hydrogen atoms in the water molecule, with the consequent breakage of the hydrogen bonds of the normal water. This type of interaction causes a reduction on the electrophilic character of the water and, consequently, an increase in its nucleophilic character.

Our group have studied the hydrolysis of substituted phenyltrifluoroacetates and demonstrated that the reaction is concerted and does not involve an intermediate, although the position of the transition state may be closer to the tetrahedral intermediate.25,26 Besides the reaction is general base catalyzed therefore in the absence of added bases, the transition state may contain more than one water molecule therefore we consider that this ester could be a good probe as a sensor for the water structure in confined systems as are the water droplet in RM. We selected phenyltrifluroacetate (PTFA, Fig. 1) as substrate and AOT/n-heptane RMs and from the study under different conditions together with results of kinetic isotopic effect and a proton inventory study we could demonstrate that the reaction is much faster in the water pool than in the interface. Moreover, we show that the water molecules encapsulated inside AOT RMs at W = 1 (W = [H2O]/[surfactant]) are not involved in the basic catalysis that the hydration reaction require, because they are strongly bounded to the AOT molecules at the interface.

Experimental section

General methods

UV-vis spectra were recorded on a spectrophotometer equipped with a temperature controlled cell holder at 25.0 °C. Control experiments of neutral hydrolysis of phenyl trifluoroacetate (Scheme 1) in the reverse micelle media showed that the final spectrum of the phenol of the reaction coincided with another obtained dissolving the expected amount of phenol in a similar reverse micelle solution prepared independently.
image file: c5ra03532e-s1.tif
Scheme 1 Hydrolysis reaction of PTFA.

Materials

The substrate PTFA was prepared by the reaction of phenol with trifluoroacetic anhydride following literature methods.26 The product was distilled under reduced pressure and collected after distillation of the remaining trifluoroacetic anhydride, and trifluoroacetic acid. The IR spectrum matched that of literature.27 The purity was controlled by comparison of the spectrum of a completely hydrolyzed solution with a stock solution of the phenol.

Sodium bis(2-ethylhexyl) sulfosuccinate (>99%) was dried under reduced pressure and was kept under vacuum over P2O5 until it was used. n-Heptane HPLC grade and water was ultrapure. D2O (99.9%) was used for the study of kinetic solvent isotope effects.

Procedures

A 2 × 10⁻⁴ M stock solution of PTFA was prepared by dissolving the necessary amount of PTFA in n-heptane. The AOT solution at the desired concentration was prepared by dissolving the necessary amount of surfactant with the PTFA/n-heptane solution. To start the reaction, the surfactant solution was transferred into a volumetric flask containing a volume of the desired water (the water was previously added with a calibrated microsyringe) and the amount of water present in the system is expressed as the molar ratio between water and the surfactant (W = [H2O]/[surfactant]). Experiments were performed in which the surfactant concentration was varied between 0.1 and 0.5 M while keeping constant W, for W values between 5 and 30. Under this experimental conditions the ratio [H2O]/[PTFA] was always higher than 770. Since at [AOT] = 0.1 M and W = 5 the reactions were too slow (the half-life of the reactions, t1/2, were greater than 9.5 hours) we did not attempt to do measurements below this concentration of AOT.

Kinetics

The hydrolysis reaction of PTFA (Scheme 1) was followed spectrophotometrically by monitoring the increase in the absorbance of phenol at 272 nm (At) versus time and representative absorption spectra are shown in Fig. S1 (ESI). Pseudo-first-order rate constants, kobs, were calculated from linear plots of ln(AAt) vs. time, where A is the final absorbance of the reaction at 272 nm.

The kinetic data always fitted the first-order integrated rate equation satisfactorily (r > 0.999). The standard deviation of the kinetic data, using different samples, was less than 5%.

Results

We expected that the changes in reactivity of the hydrolysis of PTFA should be strongly related to changes in the physical properties of the confined water, which turns out to be dependent on W.11 Thus two types of experiments were carried out in the kinetic study (i) the surfactant concentration was varied maintaining the W parameter constant, hence water properties are not altered. Under these conditions the effect that the RMs have on the substrate distribution and therefore on the reactivity can be analyzed, (ii) the W parameter was varied at constant surfactant concentration in order to study the effect of the water structure on the chemical reactivity.

(i) Effects of AOT concentration

The surfactant concentration was varied between 0.1 and 0.5 M while keeping constant W, for W values between 5 and 30. Fig. 2 shows the influence of the AOT concentration on kobs for W = 10 and 23. It can be seen that kobs increases linearly with the AOT concentration and depend on the water content. Similar behavior was obtained for W = 5, 15, 30, as shown in Fig. S2, (ESI).
image file: c5ra03532e-f2.tif
Fig. 2 Influence of the concentration of AOT on kobs in the hydrolysis of PTFA at W = 10 (open squares) and 23 (fill squares) at 25.0 °C. The data were fitted to a linear equation (r2 = 0.997).

(ii) Effect of W

The effect of changing W on kobs keeping AOT concentrations constant are shown in Fig. 3, for values of [AOT] between 0.1 M and 0.5 M. It is remarkable that the kobs values increase linearly with W but never reach the value measured in water (image file: c5ra03532e-t1.tif = 117 min−1).28
image file: c5ra03532e-f3.tif
Fig. 3 Variation of kobs with respect to W for the hydrolysis of PTFA in water/AOT/n-heptane RMs. [AOT] = 0.1 M (fill square), 0.2 M (open square), 0.3 M (fill circle), 0.4 M (open circle) and 0.5 M (fill triangle). The data were fitted using eqn (7) (r2 = 0.994).

It is worth to mention that for W = 1 there were no changes on kobs with surfactant concentration, and only we could determine a mean value of kobs = (8 ± 5) × 10−4 min−1. It is known that at W < 2, water molecules are strongly bound to the AOT sulfonate group and under these conditions the AOT molecules form compact, polymorphic assemblies with low aggregation numbers and only adding more water but maintaining W < 2 leads to micellization.29

Discussion

The kinetic data for reactions in RMs can only be interpreted in terms of reactivity if the local reactant concentrations and the intrinsic rate constants for the different pseudophases in the RMs media can be obtained from apparent rate constants. We applied a kinetic model based on the pseudophase concept which is generally used in studies of reactivity in micellar solutions.11,20–22,24 The model assumes that RMs consists of three different pseudophases: an aqueous phase (w), a medium essentially consisting of n-heptane (o), and an interface consisting primarily of surfactant (i).

PTFA is stable in n-heptane and AOT/n-heptane RMs (in the absence of water) for a period of some days (phenol was not formed) therefore the hydrolysis reactions must take place in the aqueous pseudophase and/or at the interface, depending on the distribution of the ester. Although PTFA is a hydrophobic substrate it can be dissolved in water,30 thus there is a chance that a small quantity of PTFA in the aqueous pseudophase could react with a rate constant greater than at the interface.

In a first approximation, we can consider that the PTFA is distributed within the three pseudophases of the RMs (Scheme 2), but the hydrolysis process takes place simultaneously at the interface and the aqueous pseudophase.


image file: c5ra03532e-s2.tif
Scheme 2 The pseudophase model for the hydrolysis of PTFA in AOT/n-heptane RMs.

The global reaction rate (r) will be the sum of the rates in both pseudophases

 
r = ki[PTFA]i + kw[PTFA]w (1)
where ki and kw are the pseudo first order rate constants of hydrolysis at the interface and aqueous phase of the RMs respectively.

The distribution equilibria of the ester between the pseudophases can be defined in terms of molar ratio as

 
image file: c5ra03532e-t2.tif(2)
 
image file: c5ra03532e-t3.tif(3)
where subscripts o, i and w refer to the n-heptane, interface and aqueous phase, respectively, and the concentrations are referred to the total volume of the system. Considering that the total concentration of the ester is the sum of the concentrations in the three pseudophases, we can obtain eqn (4) (deduction of equation is shown in the ESI)
 
image file: c5ra03532e-t4.tif(4)

It must be noted that the PTFA partition coefficient, Ko and Kw cannot be obtained experimentally because in the absence of water the UV-vis absorption of the PTFA is hidden by the tail of AOT and in presence of water the ester is susceptible toward hydrolysis (Fig. S1 in ESI).

The value of the partition coefficient between water/n-heptane, Kwo, can be written in terms of Ko and Kw using eqn (5):31

 
Kwo = KoKw (5)

A possible way to estimate de value of Kwo is using the values of log[thin space (1/6-em)]P, where log[thin space (1/6-em)]P = log([solute]octanol/[solute]water) = log(1/Kwateroctanol) and on the assumption that KwoKwateroctanol. The value of log[thin space (1/6-em)]P = 2.76 was calculated theoretically32 and gives Kwo ≅ 0.0017.

Considering the relationship ([AOT]Ko + WKwKo[AOT]) ≪ 1,33 eqn (4) can be simplified into eqn (6)

 
kobs = [AOT](kiKo + kwKwKoW) (6)

Replacing KwKo in eqn (6) by Kwo, eqn (7) is obtained

 
kobs = [AOT](kiKo + kwKwoW) (7)

This equation predicts the existence of a linear relationship between kobs and [AOT] at constant W as well as a linear dependence of kobs with W at constant [AOT], Fig. 2 and 3 show that the results fit to eqn (7).

Table 1 shows the values of the slopes (slopek–AOT) and intercepts obtained from plots of kobs vs. [AOT] (Fig. 2) at different W and it can be seen that in all cases the intercepts are zero within experimental error and the slope increases with values of W.

Table 1 Values of the slope and intercept obtained from plots kobs vs. [AOT] at different W values (Fig. 2) according to eqn (7) for hydrolysis of PTFA in AOT/n-heptane RMs at 25 °C
W Slopek–AOT, 10−3 M−1 min−1 Intercept, 10−3 min−1
5 15.2 −(0.2 ± 0.2)
10 39 −(0.9 ± 0.4)
15 52 (0.1 ± 0.5)
23 94 −(2 ± 2)
30 119 −(2 ± 3)


The eqn (7) predicts a linear relationship between slopek–AOT vs. W (Fig. 4) with an intercept and slope of the straight line given by kiKo and kwKworespectively. In regard to Fig. 4, the intercept obtained is practically zero within experimental error (intercept = −(6 ± 4) × 10−3 min−1) which implies a null value of ki and therefore that there is no detectable hydrolysis coming from the interface. This fact is reinforced by the results obtained at W = 1 where the reaction rate is negligible in comparison with the one coming from the water pool.


image file: c5ra03532e-f4.tif
Fig. 4 Plot of slopek–AOT vs. W for hydrolysis PTFA in AOT/n-heptane RMs at 25 °C using eqn (7) (r2 = 0.991).

This is expected considering that at this W there are no free water molecules to act as base catalyst as the hydrolysis reaction requires. Also, they are water molecules so structured that cannot act as catalyst in the reaction that need the help of other water molecules. It has been observed that the neutral hydrolysis of PTFA in aqueous solution of sodium dodecyl sulfate (SDS), shows a distribution between the two phases (aqueous medium and micelle) but the rate of reaction at the interface is negligible compared with that in water.34 It is remarkable that these results contrast with those obtained previously by other authors for the hydrolysis of benzoyl chlorides22,23,29 and we will discuss this later in the paper.

From the value of the slope of the straight line shown in Fig. 4, namely (4.1 ± 0.1) × 10−3 min−1, and using eqn (7) with Kwo = 0.0017, we estimated the value of kw = (2.47 ± 0.07) min−1.

The values of the slope (slopekW) and intercept obtained from plots of kobs vs. W at different [AOT] (Fig. 3) are summarized in Table S1 (ESI) and it can be observed that in all cases the intercept is practically zero and the slopekW increases with the AOT concentration. The plot of slopeskW vs. [AOT] is linear as shown in Fig. S3 (ESI), with slope (4.5 ± 0.1) × 10−3 min−1. Using eqn (7) and the value of Kwo, we estimated the value of kw[thin space (1/6-em)]= (2.70 ± 0.08) min−1 in close agreement with the value obtained from the data collected at variable AOT concentration (see above).

To obtain the micellar second-order rate constants kw–MI for absolute comparison of reactivity in different media, the water concentration should be known.

Since we cannot calculate which is the molarity of free water (reactant) in the AOT/n-heptane RMs, we calculated a range for [H2O] using the highest and the lowest water amount added during preparation of the RMs, this is 0.5 M (at W = 5, [AOT] = 0.1 M) to 15 M (at W = 30, [AOT] = 0.5 M). Using these values and that obtained for kw, we estimated a range for the kw–MI values within 4.97 min−1 M−1 to 0.16 min−1 M−1 for water concentration of 0.5 M and 15 M respectively. The values are in the order of magnitude of that determined for water (kw–H2O = 2.11 min−1 M−1)26 but are significantly greater than that obtained in water–acetonitrile mixture at [H2O] = 3.89 M (a water concentration similar to those used in the preparation of the RMs),2 namely kw–ACN/H2O = 3.41 × 10⁻³ min−1 M−1. We can affirm that the values for kw–MI are not due to a higher water content in the RMs, hence a possible interpretation for the higher value of kw–MI in AOT RMs in comparison with the value found in water–acetonitrile mixtures, could be that the surfactant acts as a basic catalyst of the nucleophilic addition of water. With regard to properties of the AOT RMs, it has been shown that the charge density on the AOT headgroup increases as the water content of the RMs decreases and this increase in the charge density could be responsible of its capacity to act as a basic catalyst.24 However we have seen that at low water content (W = 1) the reaction is very slow which indicate that the sulfonate group is not acting as general base catalyst.

The studies carried out to evaluate the kinetic solvent isotopic effect (KSIE) in an aqueous medium26 or in water–acetonitrile mixtures4 have shown that the kH2O/kD2O = 2–3, suggesting that water is involved in a general-base-catalyzed pathway, where one water molecule acts as general base, removing a proton from other water molecule (nucleophile) in the transition state. To test whether the reaction of water in the RM are general-base-catalyzed we performed KSIE experiments in AOT/n-heptane RMs at W = 5 and W = 30.

At W = 5 the reaction is 2.24 times slower in D2O than in H2O (kH2O/kD2O = 2.24), and the measured KSIE is similar at W = 30 (kH2O/kD2O = 2.52). Since the values for kH2O/kD2O are practically independent of W and similar to that observed in pure water or water–acetonitrile mixtures, we conclude that the water is acting as a general-base catalyst.

In order to get insights into the transition state (TS) structure upon increasing the water content, we conducted proton inventories experiments (PI)6 at W = 5 and 30. The use of PI to probe the structures of TS is documented4–6,35 so that only a brief account will be given here. The observed rate constant, kn, in the presence of H2O–D2O mixtures is related to the observed rate constant in pure H2O, ko, by eqn (8)

 
image file: c5ra03532e-t5.tif(8)
where (n) is the atom fraction of deuterium in the solvent and (RS) refers to the reagent state. All TS hydrogens (i) and all RS hydrogens (j) that contribute to the isotope effect possess a term in the numerator and denominator, respectively. Each hydrogen site is associated with a fractionation factor, φ, that expresses the preference of deuterium for the site relative to that of bulk solvent. Analysis of the present reaction is simplified by the following: PTFA carry no exchangeable hydrogens; φ of the other reactant, water, is unity by definition. Consequently, the denominator of eqn (8) is unity, and we need consider only the hydrogens of the TS.

If more than a single proton undergo significant changes in bonding in passing from reactant to transition state,35 then the plot of kn/ko versus n will be non linear but bowl shaped. Such a bowl-shaped plot implies a rate-determining transition state where multiple proton transfers are occurring. Fig. 5 is a plot of kn/ko vs n for the hydrolysis of PTFA in RMs AOT at W = 30 (similar behavior was observed at W = 5).


image file: c5ra03532e-f5.tif
Fig. 5 Plots of kn/ko vs. n in AOT RMs at W = 30. The solid line is adjusted to eqn (9) (r2 = 0.988). The broken line is drawn to emphasize the nonlinearity of the solid line.

Thus, the proton inventory data for W = 5 y W = 30 are described by eqn (9), which is based on a three-proton model and is adequate for reactions where the number of protons participating in the rate-limiting step of the reaction is three4–6

 
image file: c5ra03532e-t6.tif(9)

This equation reproduces the data satisfactorily, as can be seen from the fitting of the experimental proton inventory data in Fig. 5, the values of φ calculated are 0.74 ± 0.01 and 0.73 ± 0.01 for W = 5 and 30 respectively. Thus, the transition state structure is independent of the content of water in the RMs and appears to be the same in both cases.

It is worth noting that the average φ for PTFA, φmean = 0.735, is similar to those calculated for the pH-independent hydrolysis in aqueous acetonitrile of 4-nitrophenyl trifluoroacetate (0.697 ± 0.005)4, and 4-methylphenyl trichloroacetate (0.707 ± 0.003)5 for which cyclic TS as represented in Fig. 6 were proposed.


image file: c5ra03532e-f6.tif
Fig. 6 The transition state model for hydrolysis of PTFA in AOT RMs.

As it was mentioned before the reaction is very sensitive to the structure of water. In water–acetonitrile mixtures with low water content, the reaction shows exceptionally negative entropies of activation which indicates a substantial increase in structuring of the solvent molecules during the activation process.2 Hence, the catalysis observed in AOT RMs could be explained considering the reagent state. It seems to us that the water molecules reorganization process that happens on going from the initial state to the transition state during the activation process is favored if the water shows a degree of organization in the reagent state. It is known that in the AOT RMs, water interacts with the surfactant polar head through hydrogen-bond interactions at the interface, the bulk hydrogen bond network is destroyed,36 as a consequence no reaction coming from the RMs interface even at W = 1 is detected. On the other hand, our results indicate that the water in the water pool is ordered as reflected by the higher rate constant compared with that in water–acetonitrile mixtures where the water is disordered.2 Also, we are confident that variables such as pH or the ionic strength have not effect on the reaction because they are dramatically different for the interfacial water and not for the water pool, which resembles the values of the bulk water.14,15 Thus, we show how confinement dramatically affect the water structure and its reactivity in ester hydrolysis.

Conclusion

Applying the pseudophase model it was demonstrated that the hydrolysis of the PTFA takes place only in the water pool and there is no detectable reaction neither in the organic phase or the interface. A range for the second order rate constant in the aqueous nanodroplet, kw–MI, was estimated and it is in the order of magnitude of that determined in pure water but much higher than the values reported in water–acetonitrile with low water content.

Kinetic solvent isotopic effect experiments (KSIE) demonstrate that free water in the water pool is acting as a general-base catalyst and using proton inventories techniques (PI) we have shown that the transition state structure is independent of the water content in AOT RMs.

The results obtained lead us to suggest that the water pool of the AOT RMs is pre-organized in a way that favor the formation of the transition state were water is acting as a nucleophile and a general base catalyst. On the other hand, the interfacial water pool is so involved in the interface solvation that cannot act as reactant for the hydrolysis reaction.

Acknowledgements

Financial support from the Consejo Nacional de Investigaciones Científicas y Técnicas (CONICET), Universidad Nacional de Río Cuarto, Universidad Nacional de Córdoba, and Agencia Nacional de Promoción Científica y Técnica is gratefully acknowledged. OFS, RHR and NMC hold a research position at CONICET.

References

  1. Y. Koshikari, A. Sakakura and K. Ishihara, Org. Lett., 2012, 14, 3194–3197 CrossRef CAS PubMed.
  2. H. Neuvonen, J. Chem. Soc., Perkin Trans. 2, 1986, 1141–1145 RSC.
  3. H. Neuvonen, J. Chem. Soc., Perkin Trans. 2, 1987, 1723–1726 RSC.
  4. K. S. Venkatasubban, M. Bush, E. Ross, M. Schultz and O. Garza, J. Org. Chem., 1998, 63, 6115–6118 CrossRef CAS PubMed.
  5. C. M. L. Frasson, T. A. S. Brandao, C. Zucco and F. Nome, J. Phys. Org. Chem., 2006, 19, 143–147 CrossRef CAS.
  6. O. A. El Seoud and F. Siviero, J. Phys. Org. Chem., 2006, 19, 793–802 CrossRef CAS.
  7. P. L. Da Silva, L. Guimaraes and J. R. Pliego, J. Phys. Chem. B, 2013, 117, 6487–6497 CrossRef PubMed.
  8. T. K. De and A. Maitra, Adv. Colloid Interface Sci., 1995, 59, 95–193 CrossRef CAS.
  9. S. P. Moulik and B. K. Paul, Adv. Colloid Interface Sci., 1998, 78, 99–195 CrossRef CAS.
  10. J. J. Silber, A. Biasutti, E. Abuin and E. Lissi, Adv. Colloid Interface Sci., 1999, 82, 189–252 CrossRef CAS.
  11. M. A. Biasutti, E. B. Abuin, J. J. Silber, N. M. Correa and E. A. Lissi, Adv. Colloid Interface Sci., 2008, 136, 1–24 CrossRef CAS PubMed.
  12. N. E. Levinger, Science, 2002, 298, 1722–1723 CrossRef CAS PubMed.
  13. N. M. Correa, J. J. Silber, R. E. Riter and N. E. Levinger, Chem. Rev., 2012, 112, 4569–4602 CrossRef CAS PubMed.
  14. O. F. Silva, M. Fernández, J. J. Silber, R. H. de Rossi and N. M. Correa, ChemPhysChem, 2012, 13, 124–130 CrossRef CAS PubMed.
  15. B. Baruah, J. M. Roden, M. A. Sedgwick, N. M. Correa, D. C. Crans and N. E. Levinger, J. Am. Chem. Soc., 2006, 128, 12758–12765 CrossRef CAS PubMed.
  16. D. E. Moilanen, N. E. Levinger, D. B. Spry and M. D. Fayer, J. Am. Chem. Soc., 2007, 129, 14311–14318 CrossRef CAS PubMed.
  17. A. M. Dokter, S. Woutersen and H. J. Bakker, Proc. Natl. Acad. Sci. U. S. A., 2006, 103, 15355–15358 CrossRef CAS PubMed.
  18. J. Oshitani, S. Takashina, M. Yoshida and K. Gotoh, J. Chem. Eng. Jpn., 2008, 41, 507–512 CrossRef CAS.
  19. R. D. Falcone, M. A. Biasutti, N. M. Correa, J. J. Silber, E. Lissi and E. Abuin, Langmuir, 2004, 20, 5732–5737 CrossRef CAS PubMed.
  20. N. M. Correa, E. N. Durantini and J. J. Silber, J. Org. Chem., 1999, 64, 5757–5763 CrossRef CAS.
  21. N. M. Correa, E. N. Durantini and J. J. Silber, J. Org. Chem., 2000, 65, 6427–6433 CrossRef CAS PubMed.
  22. C. Cabaleiro-Lago, L. García-Río and P. Hervella, Langmuir, 2007, 23, 9586–9595 CrossRef CAS PubMed.
  23. L. García-Río, P. Hervella and J. R. Leis, Langmuir, 2005, 21, 7672–7679 CrossRef PubMed.
  24. C. Cabaleiro-Lago, L. Garcia-Río, P. Hervés and J. Pérez-Juste, J. Phys. Chem. B, 2005, 109, 22614–22622 CrossRef CAS PubMed.
  25. M. A. Fernández and R. H. de Rossi, J. Org. Chem., 1997, 3263, 7554–7559 CrossRef.
  26. M. A. Fernández and R. H. de Rossi, J. Org. Chem., 1999, 64, 6000–6004 CrossRef.
  27. G. A. Crowder, J. Fluorine Chem., 1971, 219–225 CrossRef CAS.
  28. The rate constant determined in water contains a very small proportion of acetonitrile (usually 3.8% v/v), needed to dissolve PTFA in water. The reactions were carried out in a stopped-flow apparatus with unequal mixing. The value measured was similar to that reported in literature, Table 1 in ref. 26.
  29. L. Garcıa-Rio, J. R. Leis and J. A. Moreira, J. Am. Chem. Soc., 2000, 122, 10325–10334 CrossRef.
  30. The solubility of PTFA in water containing 4% acetonitrile is at least 1.5 × 10⁻⁴ M since this was the concentration used in previous studies in homogeneous systems (ref. 25 and 26).
  31. L. S. Romsted and C. Bravo-díaz, Curr. Opin. Colloid Interface Sci., 2013, 18, 3–14 CrossRef CAS.
  32. On basis theorical calculus log[thin space (1/6-em)]P = 2.76 ± 0.47 obtained from ChemBioDraw 13.0.0.3015.
  33. Since Kwo = KoKw (eqn (5)) and using Kwo ≅ 0017, we can estimate a value for image file: c5ra03532e-t7.tif; and [AOT] and W are lower than 0.5 M and 30 respectively, hence ([AOT]Ko + WKwKo[AOT]) ≪ 1, under all conditions.
  34. From unpublished work carried out in our laboratory on the hydrolysis of PTFA in SDS and Brj-35 micellar systems, it could be concluded that the rate constant at the interface was negligible.
  35. H. Slebocka-Tilk, A. A. Neverov and R. S. Brown, J. Am. Chem. Soc., 2003, 125, 1851–1858 CrossRef CAS PubMed.
  36. F. Moyano, S. S. Quintana, R. D. Falcone, J. J. Silber and N. M. Correa, J. Phys. Chem. B, 2009, 113, 4284–4292 CrossRef CAS PubMed.

Footnote

Electronic supplementary information (ESI) available: The absorption spectrum of a reaction at different times, plot kobs vs. [AOT], the deduction of eqn (4), the values of slope and the intercept obtained from plots of kobs vs. W at different [AOT] and the plot slopekW vs. [AOT]. See DOI: 10.1039/c5ra03532e

This journal is © The Royal Society of Chemistry 2015
Click here to see how this site uses Cookies. View our privacy policy here.