Disposable ionic liquid-coated etched stainless steel fiber for headspace solid-phase microextraction of organophosphorus flame retardants from water samples†
Haiyan Kang,
Yanli Mao,
Xianli Wang,
Yan Zhang,
Junfeng Wu* and
Hongqiang Wang
School of Municipal and Environmental Engineering, Henan University of Urban Construction, Pingdingshan, 467036, China. E-mail: wangxianli1223@163.com; Tel: +86 375 2089079
First published on 27th April 2015
Abstract
A simple and sensitive method for determining organophosphorus flame retardants (PFRs) in water samples was first developed based on headspace solid-phase microextraction (HS-SPME) using an ionic liquid-coated etched stainless steel (IL-ESS) fiber followed by a gas chromatography-flame photometric detector (GC-FPD). The etched stainless steel wire, whose rough and porous structure could not only allow IL to be held properly but also load more IL, was used as the support of the prepared fiber. The experimental results proved that the extraction capacity of the proposed fiber was higher than that of other conventional disposable IL-based coatings and the commercial SPME fibers. Parameters affecting the extraction efficiency were investigated. Under the optimal extraction conditions, the linear range of the proposed method was in the range of 10–5 × 10⁴ ng L−1. The reproducibility of fiber-to-fiber (n = 6) was in the range of 3.9–8.2%. The method detection limits (signal/noise = 3) were in the range of 0.8–9.3 ng L−1. The proposed method was successfully applied to the determination of PFRs in the real water samples with good recoveries (78.2–105.8%) and low relative standard deviations (less than 7.7%). The results demonstrate that the proposed method was very attractive for the analysis of PFRs in water.
1 Introduction
Organophosphorus flame retardants (PFRs) have been widely used for several decades as additives to flame retardants and plasticisers in a variety of products, including plastics, foams, paints, textiles and furniture.1 PFR consumption may greatly increase in the future due to the restriction of some polybrominated diphenyl ethers (PBDEs).2 Because PFRs are used as additives that are not chemically bonded with the materials, PFRs can easily be released from materials to the surrounding environment. PFRs have already been detected various environments3–12 and their concentration in environment will subsequently rise with their growing usage.13 Moreover, toxicological studies have shown that PFRs are toxic.14,15 It has been reported triphenyl phosphate (TPHP) and tri-n-butyl phosphate (TNBP) could be potent inhibitors of the human blood monocyte carboxyl esterase15 and have neurotoxic effects.14 Tri(2-chloroethyl) phosphate (TCEP) is carcinogenic14 and neurotoxic.16,17 Tri(2-chloroisopropyl) phosphate (TCIPP) and tri(dichloropropyl) phosphate (TDCIPP) are also suspected carcinogens.14 The growing usage and toxicity of PFRs have raised concern among authorities,18 and the analysis of PFRs in environmental media is therefore a hot topic for analytical research at present.19–21Until now, a number of pretreatment techniques have attempted to extract PFRs from water, such as liquid–liquid extraction (LLE)2,22 and solid-phase extraction (SPE).20,21 However, the application of LLE and SPE for extracting PFRs from water has to suffer many drawbacks, such as time-consuming,23 labor-intensive and poor recovery of TCEP (31% with RSD of 33%)5 or tri(2-ethylhexyl) phosphate (TEHP) (not detected-51.8%).24,25 Solid-phase microextraction (SPME), introduced by Pawliszyn,26 is recently considered to be an attractive alternative technique to these conventional methods for extracting PFRs due to its simplicity and sensitivity.25 The experimental result of Rodríguez et al.25 proved that SPME was a valuable alternative to SPE for the determination of PFRs in water and commercial polydimethylsiloxane/divinylbenzene (PDMS/DVB) fiber was suitable for extracting PFRs. Although commercial SPME fibers are widely applied, they are expensive and fragile. Additionally, lot-to-lot variations of the fibers often result in relatively poor extraction reproducibility.27 Moreover, they are still not suitable for extracting TEHP with low recovery (26.7%) and unacceptable deviations (64.8%).25
Recently, ionic liquids (ILs) have been widely applied as coatings in SPME,28–43 owing to their fascinating properties including low volatility, good thermal stability and excellent extraction capability for various organic compounds. Gao et al.18 prepared IL-coated SPME fiber by sol–gel technology for extracting PFRs. The extraction capability of the prepared fiber was much higher than commercial SPME fibers. Nevertheless, the mains drawbacks of the IL-coated sol–gel fiber are the tedious preparation procedure and the fragile fused-silica support, which needs special care and attention during the using, handling, and/or storing of the fiber. On the other hand, if the metal wires, which have good mechanical strength, were used as support should make SPME an even easier method for routine analysis.44 Xu et al.45 have etched the bare stainless steel wire by hydrofluoric acid (HF) and applied as an SPME fiber for the extraction of polycyclic aromatic hydrocarbons (PAHs), pyrethroid insecticides46 and polybrominated diphenyl ethers.47 Zhang et al.48 have prepared the stainless steel plunger wire by simply etching in HF to form a microporous structure and was used as the extractant solvent holder. The extractant solvent could be easily held within the pores created by the etching. In addition, the rough and porous structure of the etched wire, which conceivably increased the interfacial area between solvent and aqueous sample, increased the extraction efficiency. However, the report about the application of the etched stainless steel wire as support in the preparation of IL-based SPME fiber was very limited.
In this study, an IL-coated etched stainless steel (IL-ESS) SPME fiber was prepared and first used for headspace SPME (HS-SPME) of PFRs from water samples. The extraction efficiency of the prepared SPME fiber was investigated. The effects of parameters on the extraction efficiency of the proposed fiber for PFRs from water were investigated. Afterwards, the optimized method was applied to the determination of PFRs in real water samples.
2 Experimental
2.1 Reagents and materials
1-Ethyl-3-methylimidazolium hexafluorophosphate, ([C2MIM][PF6]), 1-butyl-3-methylimidazolium hexafluorophosphate ([C4MIM][PF6]), 1-hexyl-3-methylimidazolium hexafluorophosphate ([C6MIM][PF6]) and 1-octyl-3-methylimidazolium hexafluorophosphate ([C8MIM][PF6]) with purity of 99% were purchased from Lanzhou Greenchem ILS, LICP, CAS (Lanzhou, China). Tripropyl phosphate (TPP), TNBP, TCEP, TPHP, TCIPP, TDCIPP and TEHP were obtained from Aldrich (Milwaukee, WI, USA). Some physicochemical properties of the analytes are shown in Table S1.† Individual stock solutions of each compound (1.0 mg mL−1) were prepared in acetone. A mixed standard solution of the analytes (1.0 mg L−1) was also prepared with acetone from the individual standard stock solutions. All of the solutions were sealed and stored at 4 °C in darkness. HPLC-grade methanol and dichloromethane was obtained from Merck (Darmstadt, Germany). Ultrapure deionized water was obtained from a Milli-Q water purification system (Milli-Q system, Millipore, Beldford, MA).2.2 Apparatus
The commercial SPME fibers, including polydimethylsiloxane (PDMS), carboxen/polydimethylsiloxane (CAR/PDMS) and PDMS/DVB, supplied from Supelco (Bellefonte, PA, USA). A heating magnetic stirrer model HJ-3 purchased from Jingfeng Instrument Co. Ltd. (Shanghai, China) was employed for stirring and heating samples during the extraction.2.3 Fiber preparation
The stainless steel wire (75 mm length and 250 μm diameter) was etched mainly according to the study of Yan et al.45 with a little modification. The tip 10 mm segment of a stainless steel wire was immersed into HF for 15 min at 40 °C. Then, the etched part of the stainless steel wire was taken out and washed gently by ultrapure deionized water, and conditioned at 300 °C for 4 h under nitrogen in the gas chromatograph (GC, 7890N, Agilent Technologies, USA) injector port before coating. And the morphology of the ESS wire was observed by using a Hitachi S-3400N II scanning electron microscopy. Because of the high viscosity of the 1-alkyl-3-methylimidazolium hexafluorophosphate ([CnMIM][PF6]), it is inappropriate to use pure IL as coating solution. To make the IL amendable to coating, the coating solution was prepared by mixing 900 μL of [C8MIM][PF6] and 100 μL of dichloromethane. The above-conditioned etched part of the stainless steel wire was dipped vertically into the coating solution and held for 5 min, and then removed and kept in air for another 2 min for the evaporation of dichloromethane. This procedure was repeated three times to obtain relatively thick coating and better repeatability of the coating. Prior to extraction, the obtained fiber was conditioned at 160 °C under helium stream in the GC injection port for 5 min to eliminate residual solvents from the fibers. The above-mentioned preparation procedure was repeated each time before utilizing IL-ESS SPME fiber for headspace extraction. The preparation of IL-coated fused-silica SPME fiber was described in ESI.†2.4 HS-SPME
A 10 mL of working solution (spiked with 5.0 ng mL−1 of the analytes) was placed into a 15 mL brown glass vial with polytetrafluoroethylene-coated septa. After the addition of NaCl and magnetic stirring bar, the vial was tightly sealed with an aluminum cap to prevent sample loss due to evaporation. Then, the septum piercing needle of the SPME device was introduced into the glass vial to allow a 1 cm length of the fiber to be exposed to the headspace over the stirred solution for 40 min at 60 °C for extraction using a constant stir rate of 600 rpm. Afterwards, the fiber was withdrawn into the needle, removed from the sample vial and immediately introduced into the GC injector port for thermal desorption. Each determination was performed in triplicate to assess reproducibility. A 7890N GC (Agilent Technologies, USA), equipped with a split/splitless injector, a HP-5 capillary column (30 m × 0.32 mm i.d., 0.25 μm film thickness) and flame photometric detector (FPD), was employed to separate and detect the analytes. Chromatographic conditions were provided in ESI.†2.5 Determination of enrichment factors
The enhancement factor (EF) was used to evaluate the pre-concentration of the analytes using the prepared fiber. EF was defined as the ratio of the sensitivity of an analyte after SPME extraction to that before extraction (i.e., by direct injection of 1 μL of standard solution) using the chromatographic peak area for quantification.492.6 Water samples
Three water samples, including lake water, sewage treatment plant (STP) effluent and tap water were selected from Pingdingshan city, China, for validating the proposed method. No pretreatment procedure was carried out prior to HS-SPME.2.7 Quality assurance/quality control (QA/QC)
The QA/QC has been conducted as described by Sun et al.50 Briefly, the use of any plastic and rubber material was avoided to minimize possible contamination of the samples during sampling, storage, transport and extraction.19 Only amber-colored glassware was used to minimize the losses of compounds by photodegradation. The laboratory blanks were investigated similarly to Section 2.4 but without the spiking of the target compounds. The results showed that no target compound was observed. GC peak identification was conducted by comparing the retention times to that of the analytes in a standard solution. Meanwhile, a Trace GC Ultra coupled to an ISQ MS (Thermo Scientific, USA) was used for the identification of the target analytes.3 Results and discussion
3.1 Considerations of IL-ESS fiber for SPME of PFRs
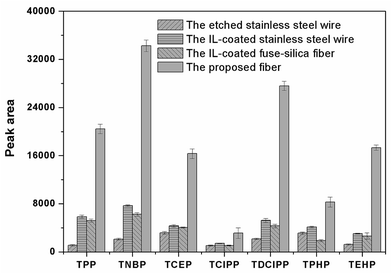
The surface morphology of the stainless steel wire before and after etching was shown in Fig. 1. It shows that the surface of the stainless steel wire was smooth before etching but became rough and porous after etching. The rough and porous structure of the ESS wire and the high viscosity of IL would allow IL to be held properly in the pores. Moreover, the rough and porous structure of the ESS wire can also load more IL, which would result in the high extraction capacity of the prepared coating. To test the above-mentioned discussion, the relevant experiments were performed to investigate the extraction capacity of the prepared fiber. As shown in Fig. 2, the IL-ESS fiber exhibited the higher extraction capacity for PRFs than that of the bare ESS fiber, the IL-coated stainless steel fiber and the IL-coated fuse-silica fiber. The extraction capacity of the proposed fiber was also higher than that of commercial PDMS, CAR/PDMS and PDMS/DVB fiber (Fig. 3). The obtained results supported the above-mentioned hypothesis that the prepared fiber has good extraction capacity.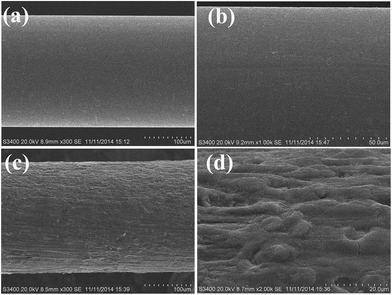 | ||
| Fig. 1 Scanning electron micrographs of the surface of the stainless steel wire before (a and b) and after (c and d) etching. | ||
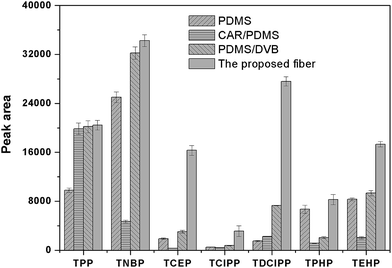 | ||
| Fig. 3 Comparison of the extraction efficiencies for PFRs by the proposed fiber and commercial fibers. Extraction conditions as in Fig. 2. | ||
3.2 Optimization of the coating procedure
Four [CnMIM][PF6] (n = 2, 4, 6, 8) were selected and investigated for the coating, because this kind of IL is high thermal stability and viscosity, good extraction capacity for organic compounds and fairly inexpensive compared with other ILs.51 To investigate the extraction capacity of the different IL-coated fiber, the ESS wire was all dipped into the coating solution for 5 min and repeated for three times, and the obtained fiber was then used to HS-SPME of PFRs. As shown in Fig. 4, the extraction efficiency of the prepared fiber was dramatically improved with the increasing of alkyl chain length. And the extraction capacity of [C8MIM][PF6]-coated ESS fiber was highest among that of the other ILs. It may due to the fact that [C8MIM][PF6] is more hydrophobic than the other ILs because of its longest alkyl chain.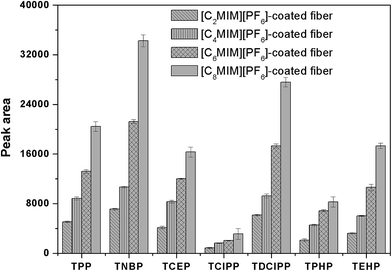 | ||
| Fig. 4 Comparison of the extraction efficiencies for PFRs by the different IL-ESS SPME fiber. Extraction conditions as in Fig. 2. | ||
The coating procedure was optimized to obtain better repeatability and higher sensitivity. It can be seen from Fig. 5, if the coating was kept to be three cycles, the peak areas would increase with the dipping time increasing from 1 to 5 min. But, the longer coating time, such as 7 min and 10 min, did not bring the significant improved extraction efficiency to the obtained fiber. It was also illustrated the extraction capacity of the fiber, that was coated just by one cycle of dipping in the coating solution for 15 min, was significantly decreased. Therefore, the fiber was coated by three cycles and dipped in the coating solution for 5 min in the following studies.
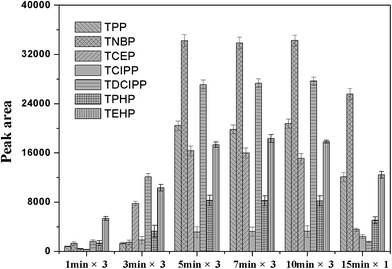 | ||
| Fig. 5 Effect of different coating times and conditions on the PFRs peak area. Extraction conditions as in Fig. 2. | ||
3.3 Optimization of HS-SPME conditions
3.4 Method evaluation
A series of experiment with regard to the linearity, limits of detection (LODs), repeatability and reproducibility was performed to validate the proposed method under the optimized conditions. As illustrated in Table 1, the linear range of the proposed procedure was in the range of 10–1 × 10⁵ ng L−1 (10–5 × 10⁴ ng L−1 for TNBP) with correlation coefficient (R) greater than 0.9964. The LODs for the PFRs, calculated at a signal-to-noise (S/N) ratio of 3, ranged from 0.8 to 9.3 ng L−1. The fiber-to-fiber reproducibility of the method, expressed as relative standard deviations (RSDs), was evaluated by the RSDs of the peak areas of the analytes extracted by six fibers prepared in the same batch and varied from 3.9 to 8.2%.| Compound | Linear range (ng L−1) | R | LOD (ng L−1) | RSD (n = 6, %) | EF |
|---|---|---|---|---|---|
| TPP | 10–1 × 10⁵ | 0.9992 | 0.8 | 6.4 | 12.5 |
| TNBP | 10–5 × 10⁴ | 0.9994 | 0.9 | 5.7 | 18.2 |
| TCEP | 10–1 × 10⁵ | 0.9996 | 4.7 | 7.3 | 21.9 |
| TCIPP | 10–1 × 10⁵ | 0.9995 | 1.8 | 3.9 | 26.3 |
| TDCIPP | 10–1 × 10⁵ | 0.9984 | 6.5 | 8.2 | 30.3 |
| TPHP | 10–1 × 10⁵ | 0.9998 | 5.2 | 5.5 | 45.5 |
| TEHP | 10–1 × 10⁵ | 0.9964 | 9.3 | 7.8 | 42.9 |
The EFs were also investigated to further investigate the extraction behavior of the IL-ESS fiber for the analytes (Table 1). In general, the EFs positively correlated with the hydrophobicity of the analytes. But the EFs of the chlorinated PFRs were higher than the alkylated ones. It may be due to that, in the case of imidazolium-based ILs, the C2–H of imidazolium ring exhibits acidic character and possesses hydrogen bond donor ability,52 which will provide more hydrogen bond interaction with the chlorinated substituents of the chlorinated PFRs than the alkylated ones. In addition, although the hydrophobicity of TEHP was much higher than that of TPHP, their EFs were similar. It may owe to that cationic moieties with an electron-rich aromatic π-system of ILs produce strong interactions with the aromatic substituents53 of TPHP, thus TPHP have stronger interactions with the ILs than TEHP. In summary, the affinity of the IL-ESS fiber to PFRs depended on not only the hydrophobicity but also the chemical structures of the analytes.
To better assess the performance of the proposed method, Table 2 summarized the comparative characteristics of the other previously reported methods for the determination of PFRs in water samples, including LLE,2,22 SPE,20,21 membrane-assisted solvent extraction (MASE),54 dispersive liquid–liquid microextraction (DLLME)55 and SPME.25 The drawbacks of LLE, SPE, PDMS/DVB fiber and IL-coated sol–gel SPME fiber has been discussed in Introduction. MASE and DLLME also have to suffer the low recovery of TCEP (5% or 23%).54,55 The proposed approach could provide comparable accuracy compared with other reported methods. It worth noting that the LODs of the conventional other disposable IL-coated SPME fiber were generally higher than those obtained using commercially SPME fibers because of the relative thin film of the conventional disposable IL-coated SPME fiber.56 While, the LODs of the prepared IL-ESS fiber were lower than those obtained using commercially PDMS/DVB fiber which may due to its high extraction capacity. In addition, the developed methods showed good recoveries to TCEP and TEHP which will be discussed later in the text. Moreover, the ESS wire was used as support, thus the proposed fiber has high mechanical stability. The preparation process of the proposed fiber was very simple, convenient. Thanks to the prepared fiber was disposable, the carryover between the determinations could be avoided.
| Parameters | LLE2 | SPE21 | SPE25 | MASE54 | DLLME55 | SPME25 | SPME18 | SPME (this study) |
|---|---|---|---|---|---|---|---|---|
| Extraction phase | Dichloromethane | SPE material | SPE material | Cyclohexane | Acetone and CH3CCl3, (98![[thin space (1/6-em)]](https://www.rsc.org/images/entities/char_2009.gif) : :![[thin space (1/6-em)]](https://www.rsc.org/images/entities/char_2009.gif) 2) 2) |
PDMS–DVB | IL-based sol–gel | IL-ESS wire |
| Solvent consumption (mL) | 165 | 55 | 17.25 | 1.25 | 1 | — | — | — |
| Determination technique | GC-NPD | GC-MS | GC-NPD | LC-MS/MS | GC-NPD | GC-NPD | GC-FPD | GC-FPD |
| LOD (ng L−1) | 0.8–2.9 | 1.2–2.9 | 5–10 | 3–25 | 10–80 | 15–25 (LOQ) | 0.7–11.6 | 0.8–9.3 |
| Recovery (%) | 81–100 | 62–101 | 24–109 | 5–98 | 23–109 | 26.7–119.2 | 73.2–101.8 | 78.2–105.8 |
| RSD | — | 10–13% | 2.1–16.7% | 2–19% | 2–17% | 5.3–64.8% | 3.3–7.6% | 3.9–7.8% |
3.5 Application to water samples
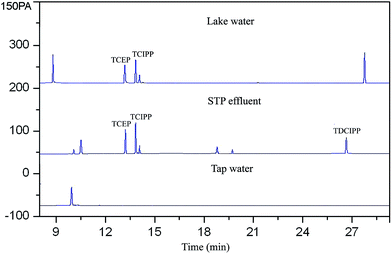
The feasibility of the proposed method for determining PFRs in lake water, STP effluent and tap water was evaluated. The results were shown in Fig. 6 and Table 3. TCEP and TCIPP were detected in lake water and STP effluent studied. TDCIPP was also detected in the STP effluent. The frequent detection of the halogenated trimesters in water samples may due to their high polarity and poor degradability, which may prevent their sorption, biodegradation and removal by the sewage treatment plant.57| Analyte | Lake water | STP effluent | Tap water | ||||||
|---|---|---|---|---|---|---|---|---|---|
| Concentration (ng L−1, ±SDb) | Recovery (%) | RSD (%) | Concentration (ng L−1, ±SD) | Recovery (%) | RSD (%) | Concentration (ng L−1, ±SD) | Recovery (%) | RSD (%) | |
| a Not detected.b Standard deviation. | |||||||||
| TPP | nda | 82.2 | 4.3 | nd | 85.5 | 2.9 | nd | 92.2 | 5.7 |
| TNBP | nd | 94.6 | 2.1 | nd | 91.2 | 4.6 | nd | 88.5 | 2.0 |
| TCEP | 23.4 ± 2.5 | 88.2 | 3.6 | 87.9 ± 3.1 | 85.7 | 5.4 | nd | 89.4 | 3.2 |
| TCIPP | 78.2 ± 5.7 | 86.5 | 5.5 | 118.6 ± 8.9 | 79.0 | 4.2 | nd | 92.6 | 4.6 |
| TDCIPP | nd | 91.2 | 4.0 | 35.2 ± 2.6 | 88.2 | 7.1 | nd | 105.8 | 1.2 |
| TPHP | nd | 78.2 | 2.6 | nd | 83.2 | 4.4 | nd | 87.9 | 2.4 |
| TEHP | nd | 96.2 | 7.7 | nd | 89.5 | 2.8 | nd | 90.4 | 3.1 |
To evaluate the accuracy of the proposed method, recoveries were performed by spiking PFRs standards into the real water samples at a concentration level of 50 ng L−1 and applying the proposed procedure to the samples. It was illustrated that the recoveries ranged from 78.2% to 105.8%, which means that the matrix may have some effect on the proposed method, at least in relation to some of the analytes. However, the RSDs were less than 7.7%, implying the established method was reliable and applicable to the real samples analysis.
4 Conclusions
In this study, a simple and sensitive HS-SPME-GC-FPD method, using IL-ESS SPME fiber, was first proposed for the determination of PFRs in water samples. The preparation procedure of the proposed fiber was very convenient. The prepared IL-ESS fiber have higher extraction capacity, better mechanical stability, lower cost and comparable reproducibility (RSD < 7.8%) compared with the commercially available SPME fibers. Besides, the carryover could be avoided as a new fiber coating is used for every determination. Under the optimal extraction conditions, the linear range of the proposed procedure was in the range of 10–1 × 10⁵ ng L−1 (10–5 × 10⁴ ng L−1 for TNBP). The fiber-to-fiber reproducibility varied from 3.9 to 8.2% and the LODs ranged from 0.8 to 9.3 ng L−1. The proposed method had been successfully applied to the determination of PFRs in the real water samples with good recoveries and RSDs. Based on the results, the proposed fiber has a great potential for widespread use as an effective extraction tool for PFRs.Acknowledgements
The authors acknowledge the financial support from National Natural Science Foundation of China (51108447).References
- H. Carlsson, U. Nilsson, G. Becker and C. Ostman, Environ. Sci. Technol., 1997, 31, 2931–2936 CrossRef CAS.
- A. Marklund, B. Andersson and P. Haglund, Environ. Sci. Technol., 2005, 39, 7423–7429 CrossRef CAS.
- J. Tollbäck, D. Tamburro, C. Crescenzi and H. Carlsson, J. Chromatogr. A, 2006, 1129, 1–8 CrossRef PubMed.
- A. Möller, Z. Xie, A. Caba, R. Sturm and R. Ebinghaus, Environ. Pollut., 2011, 159, 3660–3665 CrossRef PubMed.
- J. A. Andresen, A. Grundmann and K. Bester, Sci. Total Environ., 2004, 332, 155–166 CrossRef CAS PubMed.
- E. Martínez-Carballo, C. González-Barreiro, A. Sitka, S. Scharf and O. Gans, Sci. Total Environ., 2007, 388, 290–299 CrossRef PubMed.
- B. K. Schindler, K. Förster and J. Angerer, J. Chromatogr. B: Anal. Technol. Biomed. Life Sci., 2009, 877, 375–381 CrossRef CAS PubMed.
- M. García-López, I. Rodríguez and R. Cela, J. Chromatogr. A, 2009, 1216, 6986–6993 CrossRef PubMed.
- J. Li, N. Y. Yu, B. B. Zhang, L. Jin, M. Y. Li, M. Y. Hu, X. W. Zhang, S. Wei and H. X. Yu, Water Res., 2014, 54, 53–61 CrossRef PubMed.
- J. Castro-Jimenez, N. Berrojalbiz, M. Pizarro and J. Dachs, Environ. Sci. Technol., 2014, 48, 3203–3209 CrossRef CAS PubMed.
- M. A. Abdallah and A. Covaci, Environ. Sci. Technol., 2014, 48, 4782–4789 CrossRef CAS PubMed.
- F. X. Yang, J. J. Ding, W. Huang, W. Xie and W. P. Liu, Environ. Sci. Technol., 2014, 48, 63–70 CrossRef CAS PubMed.
- A. Bacaloni, F. Cucci, C. Guarino, M. Nazzari, R. Samperi and A. Laganà, Environ. Sci. Technol., 2008, 42, 1898–1903 CrossRef CAS.
- T. Reemtsma, J. B. Quintana, R. Rodil, M. GarcI-López and I. Rodríguez, Trends Anal. Chem., 2008, 27, 727–737 CrossRef CAS PubMed.
- A. M. Saboori, D. M. Lang and D. S. Newcombe, Chem.-Biol. Interact., 1991, 80, 327–338 CrossRef CAS.
- H. A. Tilson, B. Veronesi, R. L. McLamb and H. B. Matthews, Toxicol. Appl. Pharmacol., 1990, 106, 254–269 CrossRef CAS.
- T. Umezu, J. Yonemoto, Y. Soma and T. Suzuki, Toxicol. Appl. Pharmacol., 1998, 148, 109–116 CrossRef CAS PubMed.
- Z. Gao, Y. Deng, W. Yuan, H. He, S. Yang and C. Sun, J. Chromatogr. A, 2014, 1366, 31–37 CrossRef CAS PubMed.
- A. Möller, R. Sturm, Z. Xie, M. Cai, J. He and R. Ebinghaus, Environ. Sci. Technol., 2012, 46, 3127–3134 CrossRef PubMed.
- J. Regnery and W. Püttmann, Water Res., 2010, 44, 4097–4104 CrossRef CAS PubMed.
- U. E. Bollmann, A. Möller, Z. Xie, R. Ebinghaus and J. W. Einax, Water Res., 2012, 46, 531–538 CrossRef CAS PubMed.
- P. E. Stackelberg, J. Gibs, E. T. Furlong, M. T. Meyer, S. D. Zaugg and R. L. Lippincott, Sci. Total Environ., 2007, 377, 255–272 CrossRef CAS PubMed.
- E. Fries and W. Puttmann, J. Environ. Monit., 2001, 3, 621–626 RSC.
- X. Wang, J. Liu and Y. Yin, J. Chromatogr. A, 2011, 1218, 6705–6711 CrossRef CAS PubMed.
- I. Rodriguez, F. Calvo, J. B. Quintana, E. Rubi, R. Rodil and R. Cela, J. Chromatogr. A, 2006, 1108, 158–165 CrossRef CAS PubMed.
- C. L. Arthur and J. Pawliszyn, Anal. Chem., 1990, 62, 2145–2148 CrossRef CAS.
- N. Rastkari, R. Ahmadkhaniha and M. Yunesian, J. Chromatogr. B: Anal. Technol. Biomed. Life Sci., 2009, 877, 1568–1574 CrossRef CAS PubMed.
- K. Huang, G. Wang, B. Huang and C. Liu, Anal. Chim. Acta, 2009, 645, 42–47 CrossRef CAS PubMed.
- L. Guo and H. K. Lee, J. Chromatogr. A, 2012, 1235, 26–33 CrossRef CAS PubMed.
- T. D. Ho, M. D. Joshi, M. A. Silver and J. L. Anderson, J. Chromatogr. A, 2012, 1240, 29–44 CrossRef CAS PubMed.
- J. J. Feng, M. Sun, X. S. Wang, X. Liu and S. X. Jiang, J. Chromatogr. A, 2012, 1245, 32–38 CrossRef CAS PubMed.
- T. T. Ho, C. Y. Chen, Z. G. Li, T. Yang and M. R. Lee, Anal. Chim. Acta, 2012, 712, 72–77 CrossRef CAS PubMed.
- L. Pang and J. F. Liu, J. Chromatogr. A, 2012, 1230, 8–14 CrossRef CAS PubMed.
- J. López-Darias, V. Pino, Y. Meng, J. L. Anderson and A. M. Afonso, J. Chromatogr. A, 2010, 1217, 7189–7197 CrossRef PubMed.
- M. Liu, X. Zhou, Y. Chen, H. Liu, X. Feng, G. Qiu, F. Liu and Z. Zeng, Anal. Chim. Acta, 2010, 683, 96–106 CrossRef CAS PubMed.
- X. Zhou, P. Xie, J. Wang, B. Zhang, M. Liu, H. Liu and X. Feng, J. Chromatogr. A, 2011, 1218, 3571–3580 CrossRef CAS PubMed.
- X. Zhou, X. Shao, J. Shu, M. Liu, H. Liu, X. Feng and F. Liu, Talanta, 2012, 89, 129–135 CrossRef CAS PubMed.
- R. Amini, A. Rouhollahi, M. Adibi and A. Mehdinia, J. Chromatogr. A, 2011, 1218, 130–136 CrossRef CAS PubMed.
- R. Amini, A. Rouhollahi, M. Adibi and A. Mehdinia, Talanta, 2011, 84, 1–6 CrossRef CAS PubMed.
- M. Ebrahimi, Z. Es'Haghi, F. Samadi and M. S. Hosseini, J. Chromatogr. A, 2011, 1218, 8313–8321 CrossRef CAS PubMed.
- A. M. Shearrow, S. Bhansali and A. Malik, J. Chromatogr. A, 2009, 1216, 6349–6355 CrossRef CAS PubMed.
- A. M. Shearrow, G. A. Harris, L. Fang, P. K. Sekhar, L. T. Nguyen, E. B. Turner, S. Bhansali and A. Malik, J. Chromatogr. A, 2009, 1216, 5449–5458 CrossRef CAS PubMed.
- M. D. Joshi and J. L. Anderson, RSC Adv., 2012, 2, 5470 RSC.
- M. Zhang, J. Huang, J. Zeng and C. Zhang, RSC Adv., 2014, 4, 12313 RSC.
- H. Xu, Y. Li, D. Jiang and X. Yan, Anal. Chem., 2009, 81, 4971–4977 CrossRef CAS PubMed.
- C. Jia, X. Zhu, E. Zhao, P. Yu, M. He and L. Chen, Chromatographia, 2010, 72, 1219–1223 CAS.
- X. Chen, C. Cheng, X. Wang and R. Zhao, Anal. Methods, 2012, 4, 2908–2913 RSC.
- H. Zhang, B. W. L. Ng and H. K. Lee, J. Chromatogr. A, 2014, 1326, 20–28 CrossRef CAS PubMed.
- X. Cui, Z. Gu, D. Jiang, Y. Li, H. Wang and X. Yan, Anal. Chem., 2009, 81, 9771–9777 CrossRef CAS PubMed.
- Z. Gao, Y. Deng, X. Hu, S. Yang, C. Sun and H. He, J. Chromatogr. A, 2013, 1300, 141–150 CrossRef CAS PubMed.
- J. H. Zhang, H. X. Gao, B. Peng, S. Q. Li and Z. Q. Zhou, J. Chromatogr. A, 2011, 1218, 6621–6629 CrossRef CAS PubMed.
- A. Aggarwal, N. L. Lancaster, A. R. Sethi and T. Welton, Green Chem., 2002, 4, 517–520 RSC.
- L. Crowhurst, P. R. Mawdsley, J. M. Perez-Arlandis, P. A. Salter and T. Welton, Phys. Chem. Chem. Phys., 2003, 5, 2790–2794 RSC.
- J. B. Quintana and T. Reemtsma, J. Chromatogr. A, 2006, 1124, 22–28 CrossRef CAS PubMed.
- M. García-López, I. Rodríguez and R. Cela, J. Chromatogr. A, 2007, 1166, 9–15 CrossRef PubMed.
- J. Liu, N. Li, G. Jiang, J. Liu, J. K. Jnsson and M. Wen, J. Chromatogr. A, 2005, 1066, 27–32 CrossRef CAS PubMed.
- T. Reemtsma, S. Weiss, J. Mueller, M. Petrovic, S. González, D. Barcelo, F. Ventura and T. P. Knepper, Environ. Sci. Technol., 2006, 40, 5451–5458 CrossRef CAS.
Footnote |
| † Electronic supplementary information (ESI) available. See DOI: 10.1039/c5ra03504j |
| This journal is © The Royal Society of Chemistry 2015 |

