Quaternary semiconductor Cu2ZnSnS4 loaded with MoS2 as a co-catalyst for enhanced photo-catalytic activity†
Gaurangi Gogoia,
Sonia Aroraa,
Natarajan Vinothkumarb,
Mahuya Deb and
Mohammad Qureshi*a
aMaterials Science Laboratory, Department of Chemistry, Indian Institute of Technology Guwahati, India – 781039. E-mail: mq@iitg.ernet.in
bDepartment of Chemical Engineering, Indian Institute of Technology Guwahati, India – 781039
First published on 9th April 2015
Abstract
Quaternary Cu2ZnSnS4 (CZTS) loaded with 1% MoS2 shows excellent photo-catalytic activity for water oxidation, leading to efficient H2 generation (AQY 22.67%), as well as in the degradation of an organic pollutant. The photo-catalysts were characterized using powder X-ray diffraction, field emission scanning electron microscopy, transmission electron microscopy, UV-Vis absorbance and fluorescence spectroscopy. Taking Rhodamine B as a model system, the apparent rate constant for CZTS–MoS2 (i.e. kapp ∼ 0.066 min−1) is nearly two-fold higher in comparison to CZTS (kapp ∼ 0.032 min−1). Various scavenger tests have been performed to establish the role of O2˙− and ˙OH scavengers in the photo-degradation of a pollutant.
Introduction
The growing energy and environmental demands have led to intensive research focused on developing highly efficient, stable and low cost solar absorber materials. Some of the primary goals are to produce highly calorific hydrogen fuel from the abundant water available on the planet and to degrade industrial dyes, which are carcinogenic and cause unwanted mutations in marine life cycles.1 An extensive effort for the development of novel combinations of materials to replace traditional semiconductors such as TiO2,2,3 ZnO,4,5 CdS![[thin space (1/6-em)]](https://www.rsc.org/images/entities/char_2009.gif) 6 etc. is underway. Over the last few decades, several sulphide-based polynary alloy semiconductors have been explored and they proved to be ideal photo-absorbers because of their tunable electronic and optical properties.7–9 Compared to binary materials, polynary alloy semiconductor nano-materials are able to produce new properties as they could inherit properties from their parent binary materials.10 For example, several Cu-chalcopyrite p-type semiconductors, namely Cu(In,Ga)Se2,11 CuGa3S5,12 CuGa3Se5,13,14 CuInS2,15,17 Cu(In,Ga)S2,16 (CuIn)xZn2(1−x)S2
6 etc. is underway. Over the last few decades, several sulphide-based polynary alloy semiconductors have been explored and they proved to be ideal photo-absorbers because of their tunable electronic and optical properties.7–9 Compared to binary materials, polynary alloy semiconductor nano-materials are able to produce new properties as they could inherit properties from their parent binary materials.10 For example, several Cu-chalcopyrite p-type semiconductors, namely Cu(In,Ga)Se2,11 CuGa3S5,12 CuGa3Se5,13,14 CuInS2,15,17 Cu(In,Ga)S2,16 (CuIn)xZn2(1−x)S2![[thin space (1/6-em)]](https://www.rsc.org/images/entities/char_2009.gif) 17 and CuGaSe2,18 owing to their high absorption coefficients, tunable band gap values (1.0–2.4 eV) and suitable band alignment for water reduction, are used for H2 production from water. However, the scarcity and higher cost of In and Ga have led to the search for alternative photo-catalytic systems from earth abundant elements such as copper, zinc etc.19 Cu2ZnSnS4 which is non-toxic and has constituents that are plentiful (Cu: 50 ppm, Zn: 75 ppm, Sn: 2.2 ppm, S: 260 ppm)20 is of interest as Cu2ZnSnS4 (CZTS) has a near-optimum direct band gap energy of 1.4–1.6 eV and a large absorption coefficient (>104 cm−1). Being environmentally friendly and of natural abundance, CZTS is finding its place in replacing high-efficiency materials e.g. Cu(InGa)Se2. Although more emphasis is on fabricating photovoltaic solar cell devices of CZTS,21–24 its photo-catalytic activity for waste water treatment,25 photo-electrochemical devices26 and water oxidation for hydrogen generation are also being explored.27 The photo-catalytic efficiency of semiconductor materials is further enhanced by either coupling them with noble metals e.g. Au, Pt,25 which act as co-catalysts, or making composites with a material having a large specific surface area and good electrical conductivity, namely graphene oxide.28 MoS2, being a layered material with a large surface area,29 is of interest as an alternative co-catalyst to the high cost noble metals. MoS2 has shown high efficiency when coupled with TiO2, CdS etc.30–33 which are studied for their photo-catalytic and solar water oxidation activity. Owing to their outstanding properties, we have studied CZTS and MoS2 as possible candidates to replace noble and other expensive elements in their photo-catalytic activities using CZTS as a photo-catalyst with MoS2 as a co-catalyst. The water oxidation efficiency of CZTS–MoS2 was observed to be nearly 20% higher than CZTS owing to a lesser recombination rate of photo-generated electrons and holes as evident from the photo-luminescence quenching in the CZTS–MoS2 composite. The photo-catalytic degradation of a representative dye viz. Rhodamine B (RhB) was studied to determine the photo-catalytic activity of the CZTS–MoS2 composite; which shows a higher activity compared to CZTS alone as evident from the apparent rate constant for CZTS–MoS2, which is nearly double (0.066 min−1) than that of CZTS (0.032 min−1). Various scavenger tests established that hydroxyl radical (˙OH) plays a major role as the reactive intermediate species participating in dye degradation.
17 and CuGaSe2,18 owing to their high absorption coefficients, tunable band gap values (1.0–2.4 eV) and suitable band alignment for water reduction, are used for H2 production from water. However, the scarcity and higher cost of In and Ga have led to the search for alternative photo-catalytic systems from earth abundant elements such as copper, zinc etc.19 Cu2ZnSnS4 which is non-toxic and has constituents that are plentiful (Cu: 50 ppm, Zn: 75 ppm, Sn: 2.2 ppm, S: 260 ppm)20 is of interest as Cu2ZnSnS4 (CZTS) has a near-optimum direct band gap energy of 1.4–1.6 eV and a large absorption coefficient (>104 cm−1). Being environmentally friendly and of natural abundance, CZTS is finding its place in replacing high-efficiency materials e.g. Cu(InGa)Se2. Although more emphasis is on fabricating photovoltaic solar cell devices of CZTS,21–24 its photo-catalytic activity for waste water treatment,25 photo-electrochemical devices26 and water oxidation for hydrogen generation are also being explored.27 The photo-catalytic efficiency of semiconductor materials is further enhanced by either coupling them with noble metals e.g. Au, Pt,25 which act as co-catalysts, or making composites with a material having a large specific surface area and good electrical conductivity, namely graphene oxide.28 MoS2, being a layered material with a large surface area,29 is of interest as an alternative co-catalyst to the high cost noble metals. MoS2 has shown high efficiency when coupled with TiO2, CdS etc.30–33 which are studied for their photo-catalytic and solar water oxidation activity. Owing to their outstanding properties, we have studied CZTS and MoS2 as possible candidates to replace noble and other expensive elements in their photo-catalytic activities using CZTS as a photo-catalyst with MoS2 as a co-catalyst. The water oxidation efficiency of CZTS–MoS2 was observed to be nearly 20% higher than CZTS owing to a lesser recombination rate of photo-generated electrons and holes as evident from the photo-luminescence quenching in the CZTS–MoS2 composite. The photo-catalytic degradation of a representative dye viz. Rhodamine B (RhB) was studied to determine the photo-catalytic activity of the CZTS–MoS2 composite; which shows a higher activity compared to CZTS alone as evident from the apparent rate constant for CZTS–MoS2, which is nearly double (0.066 min−1) than that of CZTS (0.032 min−1). Various scavenger tests established that hydroxyl radical (˙OH) plays a major role as the reactive intermediate species participating in dye degradation.
Experimental
Synthesis of the Cu2ZnSnS4–MoS2 composite
All reagents were of analytical grade and used without further purification. The synthesis for Cu2ZnSnS4 (CZTS) was adopted from ref. 20. In a typical procedure, copper(II) acetate monohydrate (0.04 M, 0.119 g) (Merck), zinc(II) nitrate hexahydrate (0.02 M, 0.089 g) (Himedia), and tin(II) chloride dihydrate (0.02 M, 0.067 g) (Rankem) were dissolved in 15 mL of a solvent mixture of ethylenediamine (EN) (Merck) and deionized water (volume ratio 1![[thin space (1/6-em)]](https://www.rsc.org/images/entities/char_2009.gif) :
:![[thin space (1/6-em)]](https://www.rsc.org/images/entities/char_2009.gif) 9), wherein EN acts as a chelating agent and stabilizer. 15 mL of a 0.16 M (0.182 g) solution of thiourea, SC(NH2)2 (Merck), was added drop-wise to the above solution. The precursor solution was then transferred into a 50 mL Teflon-lined stainless steel autoclave, sealed and heated at 180 °C for 24 h. Liu et al. have proposed that this process involves the reduction of Cu2+ ions to Cu+ and oxidation of Sn2+ ions to Sn4+ through oxidation–reduction reactions.20 After cooling, the powders were centrifuged, washed several times with deionized water and absolute ethanol and dried at 60 °C overnight.
9), wherein EN acts as a chelating agent and stabilizer. 15 mL of a 0.16 M (0.182 g) solution of thiourea, SC(NH2)2 (Merck), was added drop-wise to the above solution. The precursor solution was then transferred into a 50 mL Teflon-lined stainless steel autoclave, sealed and heated at 180 °C for 24 h. Liu et al. have proposed that this process involves the reduction of Cu2+ ions to Cu+ and oxidation of Sn2+ ions to Sn4+ through oxidation–reduction reactions.20 After cooling, the powders were centrifuged, washed several times with deionized water and absolute ethanol and dried at 60 °C overnight.
MoS2 catalysts were synthesized using a hydrothermal method34 involving ammonium heptamolybdate (0.276 g) (Sigma-Aldrich) and thiourea (0.36 g) (Merck), dissolved in 30 mL of distilled water. A surfactant, cetyltrimethylammonium bromide (CTAB, 0.036 g) (Rankem), was added into the above solution. The resultant mixture was added to a 50 mL Teflon-lined stainless steel autoclave and kept at 180 °C for 24 h. After cooling, the catalyst was separated and washed with distilled water and absolute ethanol several times to remove the residual water and water-soluble impurities. Finally, the resulting product was dried at 50 °C for 8 h.
For the preparation of the CZTS–MoS2 composite, 1 wt% of MoS2 was added into the above precursor solution of CZTS, which was transferred to a Teflon-lined stainless steel autoclave, sealed and heated at 180 °C for 24 h. The resulting powder, after cooling, was washed with water and ethanol several times and dried at 60 °C overnight.
Characterization
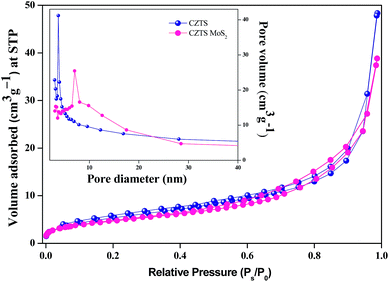
The crystal structures of the as prepared samples were characterized by powder X-ray diffraction (XRD) measurements using a SEIFERT 3003-TT XRD machine operated at 40 kV/30 mA (excitation wavelength CuKα). The scan range was 10–80° with a step size of 0.03° s−1. The morphology and compositional homogeneity of the photo-catalysts were studied using a Zeiss Sigma field emission scanning electron microscope at an operating voltage of 1–5 kV and energy dispersive X-ray spectroscopy (EDX) at an operating voltage of 20 kV, respectively. UV-Visible diffuse reflectance spectra (DRS) of the samples were recorded on a Jasco V-650 spectrophotometer with an integrating sphere of 150 mm in the range of 200 to 800 nm. The absorbance of the RhB solution was measured using a Perkin Elmer Lamda 25 UV-Visible spectrometer. The transmission electron microscopy (TEM) analysis was carried out using a JEOL JEM 2100 microscope at 200 kV operating voltage. The BET surface area was analysed by nitrogen (N2) adsorption at liquid N2 temperature with a Beckman-Coulter SA 3100 nitrogen adsorption apparatus. All the samples were degassed at 150 °C for 2 h prior to the N2 adsorption measurements.Photo-catalytic dye degradation experiments
Photo-catalytic dye degradation experiments for CZTS and the CZTS–MoS2 composite were performed separately in an immersion well photochemical reactor. The double-walled immersion well permits water circulation and houses a MVL2 125W low pressure mercury vapour lamp as the light source to initiate the photo-catalytic reaction (SI). In a typical photo-catalytic degradation experiment, 100 mL of aqueous Rhodamine B dye (RhB) (10−5 M) and 0.05 g of the photo-catalyst sample were loaded into the reactor. The reaction mixture was stirred overnight in the dark at room temperature in order to achieve an adsorption–desorption equilibrium among the photo-catalyst, dye, dissolved oxygen and atmospheric oxygen. During irradiation, the suspension was kept stirring in order to achieve a homogeneous solution. 2 mL of the sample was collected from the photo-reactor every ten minutes for up to one hour. UV-Vis absorption spectra of the collected samples were recorded over the range 200–800 nm after removing the solid catalyst particles by centrifugation. The concentration of the aqueous RhB was determined from the absorbance value monitored at 552 nm.Detection of reactive intermediates
To determine the reactive intermediates involved in dye degradation, photo-catalytic measurements were performed in the presence of scavengers, in the same way as mentioned for the dye degradation experiments. In our experiments, ethylenediaminetetraaceticacid (EDTA, 1 mM) and FeSO4 (1 mM) were employed as hole (h+) and ˙OH scavengers, respectively. The system was purged with nitrogen gas to remove the dissolved oxygen, which can serve as a test for O2˙− scavengers.35–37Photo-catalytic water oxidation to evolve hydrogen
Photo-catalytic water oxidation experiments, to estimate hydrogen evolution, for CZTS and CZTS–MoS2 were performed separately in a 100 mL borosilicate round-bottom flask sealed with a silicone rubber septum and placed in a vessel containing a water inlet and an outlet to maintain the temperature of the photo-reactor. The photo-catalytic reaction was carried out at room temperature and atmospheric pressure. A 500 W tungsten halogen lamp (Halonix, India) was used as a light source to initiate the photo-catalytic reaction. The photo-catalyst sample was placed 15 cm away from the lamp. In a typical photo-catalytic experiment, 0.2 g of the sample was dispersed in 25 mL of water containing Na2SO3 (0.25 mol L−1) and Na2S (0.35 mol L−1) as sacrificial reagents. The solution containing the photo-catalyst was degassed for 30 min and irradiated with UV-Vis light while stirring, to ensure uniform exposure of the suspension throughout the process. The produced gas was analysed by gas chromatography (Nucon 5765), using a thermal conductivity detector (TCD), after passing through moisture and oxygen traps (SI). In the absence of either light or the photo-catalyst, no appreciable amount of hydrogen was detected, suggesting that CZTS and CZTS–MoS2 acted as photo-catalysts in the hydrogen production.The apparent quantum yield (AQY) of the photo-catalyst was measured under the same reaction conditions, and it was calculated using the following equation:38
Results and discussion
Powder X-ray diffraction
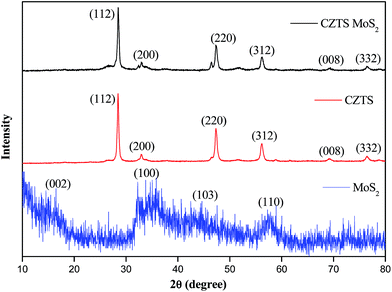
The powder X-ray diffraction patterns of the as-prepared CZTS, MoS2 and the CZTS–MoS2 composite are shown in Fig. 1.The as-prepared CZTS was found to be crystallizing in a tetragonal kesterite phase (JCPDS card no. 26-0575), as identified by reflections at 2θ = 28.5° (112), 33.3° (200), 47.4° (220), 56.1° (312), 69.2° (008) and 76.5° (332). No impurity peaks corresponding to ZnS or Cu2SnS3 phases were observed. The average crystallite size was calculated using a Debye–Scherrer equation from the full width at half maximum (FWHM) of the reflection peak (112) and found to be ∼4 nm for CZTS and ∼3.72 nm for the CZTS–MoS2 composite. There was no significant change observed in the crystallite size, which is attributed to the interactions and adhering of CZTS to the surface of MoS2 sheets.39
The as-prepared MoS2 was weakly crystalline, as seen from the broadening of diffraction peaks. The PXRD pattern matched well with the hexagonal structure (JCPDS card no. 37-1592), with reflections at 2θ = 16.7°, 33.4°, 43.5° and 57.4° corresponding to (002), (100), (103) and (110) hkl planes, respectively.
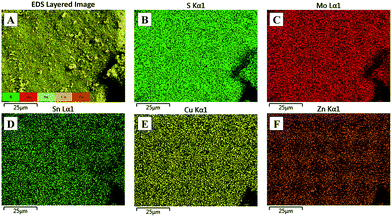
The CZTS–MoS2 composite showed the XRD pattern of CZTS only, while no distinct peaks corresponding to MoS2 were observed. The absence of MoS2 peaks could be attributed to the weak crystalline nature of MoS2 compared to CZTS as well as the low content of MoS2 i.e. ∼1% in the CZTS–MoS2 composite. However, the presence of MoS2 was established using microscopic techniques such as EDX and TEM.
Morphological studies
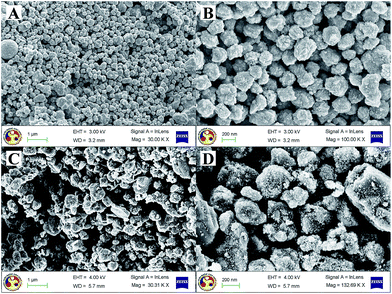
The as-prepared CZTS showed nearly spherical particles of the same size, as seen in Fig. 2A and B. The average particle size was observed to be in the range of ∼200 nm, whereas the composite showed bigger particles of an irregular shape probably due to more CZTS particles getting accumulated into the MoS2 layers. To ascertain the distribution of MoS2, elemental mapping of the composite was performed using energy dispersive X-ray analysis and it was observed that molybdenum and sulphur are homogeneously distributed throughout the sample, as seen in Fig. 3A–F.
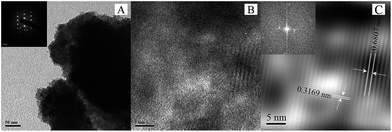
The interaction of CZTS with MoS2 was further evaluated by transmission electron microscopy, as shown in Fig. 4. Fig. 4A shows a nearly spherical composite particle and the inset of Fig. 4A shows the SAED pattern of CZTS–MoS2 corresponding to a tetragonal phase. Fig. 4B and C show the high resolution TEM images, wherein a lattice spacing of ∼0.68 nm corresponding to the MoS2 (100) plane and an inter-planar distance of ∼0.31 nm of the CZTS (112) plane were observed. These observations substantiate successful impregnation of MoS2 on CZTS.
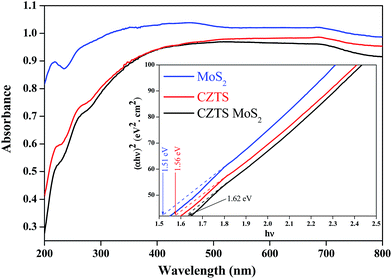
| (αhν)1/n = C × (hν − Eg) |
α = 1/t × ln(It/I0) = 1/t × A × log![[thin space (1/6-em)]](https://www.rsc.org/images/entities/char_2009.gif) e e |
Photo-catalytic water oxidation
A photo-catalytic water oxidation experiment was carried out using CZTS and CZTS–MoS2 as the photo-catalyst, and the amount of hydrogen liberated was estimated using a standard procedure. The H2 evolution rates under visible irradiation are shown in Fig. 7. The CZTS–MoS2 composite showed a greater photo-catalytic activity with a H2 production rate of 264 μmol per 0.2 g per h in comparison to bare CZTS (214 μmol per 0.2 g per h). The calculated AQY of CZTS–MoS2 is 22.67%, which is about 1.23 times higher than that of CZTS, i.e. 18.42%.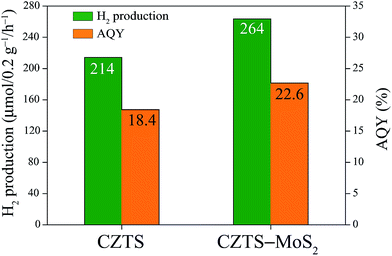 | ||
| Fig. 7 The amount of H2 generated from the Cu2ZnSnS4 and Cu2ZnSnS4–MoS2 catalysts under light irradiation and their respective AQY (%) values. | ||
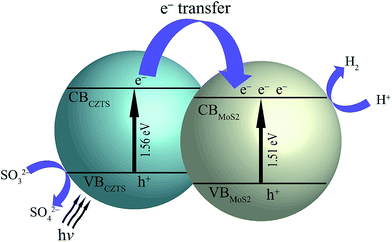
The higher photo-catalytic activity of CZTS–MoS2 is attributed to more active sites in CZTS–MoS2 as well as a higher charge separation. A schematic of a band diagram showing the energy alignments of CZTS–MoS2 which facilitate an efficient transfer of electrons is shown in Scheme 1. Upon light irradiation of CZTS–MoS2, electron–hole pairs are generated in CZTS in the CB and VB respectively. The sacrificial electron donor (Na2SO3) rapidly consumes the oxidative holes in the VB of CZTS, leaving the reductive electrons efficiently separated in the CB. At the same time, the reductive electrons are transferred from the CB of CZTS to the CB of MoS2 because of the close proximity alignment of the conduction bands of the two, thereby leading to the reduction in the rate of electron–hole pair recombination and hence enhanced charge separation. The pool of reductive electrons thus generated in the CB of MoS2 promotes the reduction of H+ ions, thereby producing H2 gas. Thus, the improved photo-catalytic activity of CZTS–MoS2 is attributed to the efficient separation and lesser recombination of photo-generated electron–hole pairs in the composite.
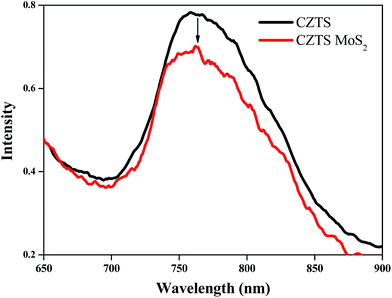
The decrease in the recombination rate of the electrons and holes in the composite is further substantiated by quenching of the fluorescence intensity (∼11%) of the MoS2 loaded CZTS compared to bare CZTS, as seen in Fig. 8.
Reusability of CZTS–MoS2
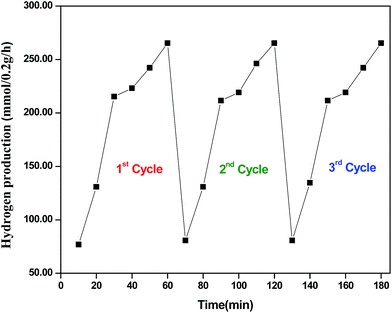
To examine the reusability of the CZTS–MoS2 catalyst, we have carried out three cycles of the photo-catalytic experiment for hydrogen production, with the catalyst. The catalyst retained optimal activity for three cycles, which shows the efficient reusability of the catalyst. The results of the repeated cycles are shown in Fig. 9. In a typical experiment 0.2 g of the sample was dispersed in 25 mL of water containing Na2SO3 (0.25 mol L−1) and Na2S (0.35 mol L−1) as sacrificial reagents. The solution containing the photo-catalyst was degassed for 30 min and irradiated with UV-Vis light while stirring, to ensure uniform exposure of the suspension throughout the process. The produced gas was analysed by gas chromatography (Nucon 5765), using a thermal conductivity detector (TCD), after passing through moisture and oxygen traps. After irradiation for one hour, the solution was removed and the same experiment was repeated with fresh solution, without any processing of the catalyst, and the amount of gas evolved per 10 minutes was measured. Similarly, the experiment was repeated for a third cycle.Photo-catalytic dye degradation analysis
The photo-catalytic dye degradation experiments were performed by suspending 0.05 g of catalyst in a 100 mL solution of Rhodamine B (RhB) (10−5 M) as a reference dye. The solution was stirred overnight in the dark to achieve an adsorption–desorption equilibrium, followed by irradiation to start the photo-catalytic dye degradation. The photo-degradation of RhB was followed by measuring its concentration at an absorbance value of 552 nm. The absorbance spectra of RhB were collected at regular intervals (10 min up to 1 hour) of the degradation experiments, as shown in Fig. 10a (catalyst used is CZTS) and Fig. 10b (catalyst used is CZTS–MoS2). The concentration (C/C0) versus time was plotted as shown in Fig. 11. From Fig. 10, it was clearly observed that RhB is degraded much faster by CZTS–MoS2 than CZTS alone. ∼97% degradation of RhB was achieved in the case of CZTS–MoS2, in about 40 minutes, whereas this was only ∼70% for bare CZTS.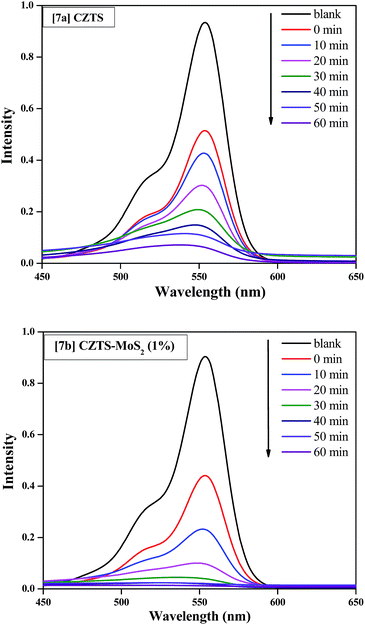 | ||
| Fig. 10 (a) UV-Vis absorption spectra of RhB degradation with the Cu2ZnSnS4 catalyst; (b) UV-Vis absorption spectra of RhB degradation with the Cu2ZnSnS4–MoS2 catalyst. | ||
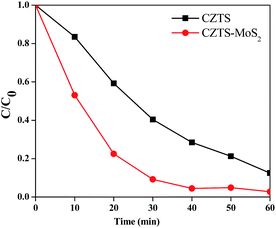 | ||
| Fig. 11 C/C0 versus irradiation time curves for photo-degradation of RhB by Cu2ZnSnS4 and Cu2ZnSnS4–MoS2. The degradation is much faster in the case of Cu2ZnSnS4–MoS2. | ||
Fig. 12 shows the first order linear transform, ln(C/C0) = −kappt, corresponding to the photo-degradation of RhB by CZTS. Here, kapp is the apparent first order reaction rate constant, which represents the rate of the reaction. The CZTS–MoS2 composite shows higher activity compared to CZTS alone, as the apparent rate constant for CZTS–MoS2 is almost twice (0.066 min−1) that of CZTS (0.032 min−1).
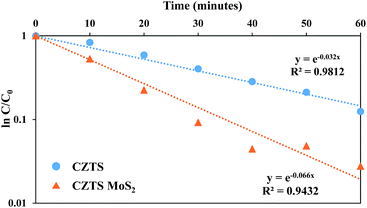 | ||
| Fig. 12 The evolution of the apparent rate constant in the presence of Cu2ZnSnS4 and Cu2ZnSnS4–MoS2. | ||
Photo-catalytic dye degradation mechanism
The photo-catalytic degradation of a dye generally takes place by the following mechanism.35,36 When a catalyst is exposed to UV-Vis irradiation, electrons are promoted from the valence band to the conduction band producing an electron–hole pair. The e− and h+ can migrate to the catalyst surface, where they can undergo a redox reaction with other species present on the surface. This prevents recombination of the e− and h+ generated in the first step. h+ (vb) can react easily with surface bound H2O to produce ˙OH radicals, whereas e− (cb) can react with O2 to produce a superoxide radical anion of oxygen, O2˙−. ˙OH radicals can combine to form H2O2. The H2O2 can further react with O2˙− to produce ˙OH, which is responsible for the degradation of the organic dye.| Catalyst + hν → e−cb + h+vb | (1) |
| e−cb + O2 → O2˙− | (2) |
| h+vb + H2O → ˙OH + H+ | (3) |
| ˙OH + ˙OH → H2O2 | (4) |
| H2O2 + O2˙− → ˙OH + OH− + O2 | (5) |
| Dye + ˙OH → CO2 + H2O | (6) |
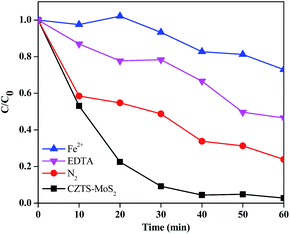
It can be seen that hydroxyl radical (˙OH) and superoxide anion radical (O2˙−) are mainly responsible for the degradation of the dye. Therefore in order to study the mechanism of dye degradation, various scavenger tests were performed wherein radical or hole trapping agents were added into the dye catalyst system and the rate of degradation was observed (Fig. 13 and 14).
A Fe2+ salt was used as a ˙OH trapping agent. Fe2+ undergoes the following reaction with ˙OH present in the solution.
| ˙OH + Fe2+ → OH− + Fe3+ |
This reaction has a very high rate constant (k = 3.5 × 10⁸ M−1 s−1). In the presence of Fe2+, ˙OH is converted to OH−, decreasing the ˙OH concentration in the solution and leading to a decreased rate of dye degradation. SO42− ions also cause a decrease in the percentage degradation as they react with ˙OH as follows:
| SO42− + ˙OH → SO42− + OH− |
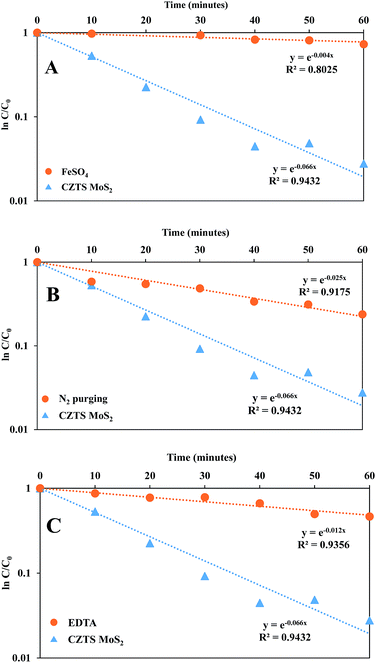
The reason for choosing FeSO4 over other iron salts is that both cation and anion (Fe2+ and SO42−) can act as ˙OH scavengers. The apparent rate constant (kapp) for RhB degradation in the presence of FeSO4 was less (0.004 min−1) than that without the metal ion, as can be seen in Fig. 14A.
Another intermediate that plays an important role in the degradation process is the superoxide radical anion (O2˙−), which is formed by the reduction of dissolved molecular oxygen in water. In order to prove its role, a degradation experiment was carried out under continuous N2 purging, which was used to replace the dissolved oxygen from the system. The apparent rate constant (kapp) for degradation in deoxygenated water was less (0.025 min−1) than that in normal oxygenated water (0.066 min−1), as can be seen in Fig. 14B, proving the importance of dissolved oxygen in generating superoxide radicals, which enhances the kinetics of degradation.
Furthermore, a degradation experiment was performed in the presence of EDTA, which acts as a hole scavenger. The plot for the apparent rate constant (kapp) for degradation showed a lower rate constant (0.012 min−1) in presence of EDTA as compared to the rate constant in the absence of EDTA (0.066 min−1) (Fig. 14C).
Although, each scavenger has its role to play in controlling the kinetics of dye degradation, it was observed that ˙OH plays a more prominent role, as evident from the kinetic data. Hence we propose that hydroxyl radicals could be the determining species in controlling the kinetics of dye degradation.
Conclusion
In conclusion, quaternary Cu2ZnSnS4 and its composite with a layered material viz. MoS2 were prepared by a facile hydrothermal method. The enhanced photo-catalytic ability of the composite was evaluated through its appreciable water splitting ability to evolve hydrogen, with an AQY value of 22.67%, and better efficiency in the degradation of RhB as a reference pollutant compared to bare CZTS. The faster photo-degradation of RhB by CZTS–MoS2 in comparison to CZTS was substantiated by kinetic studies. The various scavenger tests showed the major role of hydroxyl radicals in the photo-degradation of RhB.Acknowledgements
MQ thank CSIR Grant no. CSIR/01 (2704)/12/EMR-II India for a financial grant. Sonia Arora thanks DST India for a Women Scientist fellowship (WOS-A) Grant no. SR/WOS – A/CS-33/2013 (G): C/503/IFD/2014–15. Infrastructure and instrumentation help from IIT Guwahati, CIF – IIT Guwahati are highly appreciated.References
- Z. X. Chang, W. H. Zhou, D. X. Kou, Z. J. Zhoua and S. X. Wu, Chem. Commun., 2014, 50, 12726 RSC; A. O. Ibhadon and P. Fitzpatrick, Catalysts, 2013, 3, 189–218 CrossRef CAS PubMed; W. Y. Teoh, J. A. Scott and R. Amal, J. Phys. Chem. Lett., 2012, 3, 629–639 CrossRef.
- A. Fujishima and K. Honda, Nature, 1972, 37, 238 Search PubMed.
- A. L. Linsebigler, G. Lu and J. T. Yates, Chem. Rev., 1995, 95, 735 CrossRef CAS.
- W. C. Lee, Y. Fang, R. Kler, G. E. Canciani, T. C. Draper, Z. T. Y. Al-Abdullah, S. M. Alfadul, C. C. Perry, H. He and Q. Chen, Mater. Chem. Phys., 2015, 149–150, 12 CrossRef CAS PubMed.
- X. Zhang, J. Qin, Y. Xue, P. Yu, B. Zhang, L. Wang and R. Liu, Sci. Rep., 2014, 4, 4596 Search PubMed.
- Z. Khan, T. R. Chetia, A. K. Vardhaman, D. Barpuzary, C. V. Sastri and M. Qureshi, RSC Adv., 2012, 2, 12122 RSC.
- A. L. Linsebigler, G. Lu and J. T. Yates Jr, Chem. Rev., 1995, 95, 735 CrossRef CAS; A. Kudo and Y. Miseki, Chem. Soc. Rev., 2009, 38, 253 RSC.
- A. Shavel, J. Arbiol and A. Cabot, J. Am. Chem. Soc., 2010, 132, 4514 CrossRef CAS PubMed.
- S. Yang, Q. Yue, F. Wua, N. Huo, Z. Chen, J. Yang and J. Li, J. Alloys Compd., 2014, 597, 91 CrossRef CAS PubMed.
- P. Hu, S. S. Pramana, S. Cao, C. K. Ngaw, J. Lin, S. C. J. Loo and T. T. Y. Tan, Adv. Mater., 2013, 25, 2567 CrossRef CAS PubMed.
- D. Yokoyama, T. Minegishi, K. Maeda, M. Katayama, J. Kubota, A. Yamada, M. Konagai and K. Domen, Electrochem. Commun., 2010, 12, 851 CrossRef CAS PubMed.
- M. Tabata, K. Maeda, T. Ishihara, T. Minegishi, T. Takata and K. Domen, J. Phys. Chem. C, 2010, 114, 11215 CAS.
- J. Kim, T. Minegishi, J. Kobota and K. Domen, Energy Environ. Sci., 2012, 5, 6368 CAS.
- H. Kumagai, T. Minegishi, Y. Moriya, J. Kubota and K. Domen, J. Phys. Chem. C, 2014, 118, 16386 CAS.
- Gunawan, W. Septina, S. Ikeda, T. Harada, T. Minegishi, K. Domen and M. Matsumura, Chem. Commun., 2014, 50, 8941 RSC.
- S. Ikeda, M. Nonogaki, W. Septina, G. Gunawan, T. Harada and M. Matsumura, Catal. Sci. Technol., 2013, 3, 1849 CAS.
- I. Tsuji, H. Kato, H. Kobayashi and A. Kudo, J. Phys. Chem. B, 2005, 109, 7323 CrossRef CAS PubMed.
- M. Moriya, T. Minegishi, H. Kumagai, M. Katayama, J. Kubota and K. Domen, J. Am. Chem. Soc., 2013, 135, 3733 CrossRef CAS PubMed.
- J. Wang, P. Zhang, X. Song and L. Gao, RSC Adv., 2014, 4, 27805 RSC.
- W. C. Liu, B. L. Guo, X. S. Wu, F. M. Zhang, C. L. Mak and K. H. Wong, J. Mater. Chem. A, 2013, 1, 3182 CAS.
- T. R. Knutson, P. J. Hanson, E. S. Aydil and R. L. Penn, Chem. Commun., 2014, 50, 5902 RSC.
- J. W. Cho, A. Ismail, S. J. Park, W. Kim, S. Yoon and B. K. Min, ACS Appl. Mater. Interfaces, 2013, 5, 416 Search PubMed.
- S. K. Saha, A. Guchhait and A. J. Pal, Phys. Chem. Chem. Phys., 2012, 14, 8090 RSC.
- B. Shin, O. Gunawan, Y. Zhu, N. A. Bojarczuk, S. J. Chey and S. Guha, Prog. Photovoltaics, 2013, 21, 72 CAS.
- X. Yu, A. Shavel, X. An, Z. Luo, M. Ibanez and A. Cabot, J. Am. Chem. Soc., 2014, 136, 9236 CrossRef CAS PubMed.
- S. C. Riha, S. J. Fredrick, J. B. Sambur, Y. Liu, A. L. Prieto and B. A. Parkinson, ACS Appl. Mater. Interfaces, 2011, 3, 58 CAS.
- E. Ha, L. Y. S. Lee, J. Wang, F. Li, K.-Y. Wong and S. C. E. Tsang, Adv. Mater., 2014, 26, 3496 CrossRef CAS PubMed.
- D. Chen, Y. Zhao, Y. Chen, B. Wang, H. Chen, J. Zhou and Z. Liang, ACS Appl. Mater. Interfaces, 2015, 7, 3224–3230 Search PubMed; L. Bai, J. N. Ding, N. Y. Yuan, H. W. Hu, Y. Li and X. Fang, Mater. Lett., 2013, 112, 219 CrossRef CAS PubMed.
- S. Yang, J. Kang, Q. Yue and K. Yao, J. Phys. Chem. C, 2014, 118, 9203 CAS.
- T. Jia, A. Kolpin, C. Ma, R. C. T. Chan, W. M. Kwok and S. C. E. Tsang, Chem. Commun., 2014, 50, 1185 RSC.
- Y. L. Min, G. Q. He, Q. J. Xu and Y. C. Chen, J. Mater. Chem. A, 2014, 2, 2578 CAS.
- M. Shen, Z. Yan, L. Yang, P. Du, J. Zhang and B. Xiang, Chem. Commun., 2014, 50, 15447 RSC.
- Y. Zhu, Q. Ling, Y. Liu, H. Wang and Y. Zhu, Phys. Chem. Chem. Phys., 2015, 17, 933 RSC.
- W. Wang, K. Zhang, Z. Qiao, L. Li, P. Liu and Y. Yang, Ind. Eng. Chem. Res., 2014, 53, 10301 CrossRef CAS.
- Z. Khan, T. R. Chetia and M. Qureshi, Nanoscale, 2012, 4, 3543 RSC.
- M. A. Rauf and S. S. Ashraf, Chem. Eng. J., 2009, 151, 10 CrossRef CAS PubMed.
- G. Naresh and T. K. Mandal, ACS Appl. Mater. Interfaces, 2014, 6, 21000 CAS.
- R. Sasikal, V. Sudarsan, C. Sudakar, R. Naik, T. Sakuntala and S. R. Bharadwaj, J. Phys. Chem. C, 2012, 116, 150 Search PubMed.
- J. Li, K. Yu, Y. Tan, H. Fu, Q. Zhang, W. Cong, C. Song, H. Yin and Z. Zhu, Dalton Trans., 2014, 13136 RSC; Y. Zhu, Q. Ling, Y. Liu, H. Wang and Y. Zhu, Phys. Chem. Chem. Phys., 2015, 17, 933 RSC.
- K. S. W. Sing, D. H. Everett, R. A. W. Haul, L. Moscou, R. A. Pierotti, J. Rouquerol and T. Siemieniewska, Pure Appl. Chem., 1985, 57, 603 CrossRef CAS.
Footnote |
| † Electronic supplementary information (ESI) available: Details of the experimental setup for photo-catalytic hydrogen generation, the dye degradation setup, and the power spectrum distribution for the 500 W tungsten halogen lamp are given. See DOI: 10.1039/c5ra03401a |
| This journal is © The Royal Society of Chemistry 2015 |


