Encrustation of cobalt doped copper ferrite nanoparticles on solid scaffold CNTs and their comparison with corresponding ferrite nanoparticles: a study of structural, optical, magnetic and photo catalytic properties

Charanjit Singha, S. Bansalb, Vinod Kumarc, K. B. Tikood and Sonal Singhal*a
aDepartment of Chemistry, Panjab University, Chandigarh, India-160014. E-mail: sonal1174@gmail.com
bDepartment of Science and Technology, New Delhi, India
cICON Analytical Equipment (P) Ltd., Mumbai-400018, India
dDepartment of Pharmacology and Toxicology, National Institute of Pharmaceutical Education and Research (NIPER), S.A.S Nagar, Mohali, Punjab, India-160062

Received 23rd February 2015 , Accepted 20th April 2015

First published on 20th April 2015


Abstract

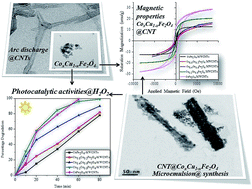
Cobalt doped copper ferrite nanoparticles and their nanocomposites with carbon nanotubes (CNTs) were synthesized by microemulsion method where sodium dodecyl sulphate was used as soft templating agent to control the particle size and shape. Powder X-ray diffraction technique confirmed the formation of cobalt doped copper ferrite nanoparticles and their corresponding nanocomposites. A significant decrease in the lattice parameter was observed using Le-bail refinement method which confirmed the doping of cobalt ion in to the copper ferrite lattice. Appearance of peak at around 25.9° indicated that CNTs remain unaffected during synthesis procedure. High Resolution Transmission Electron Microscopy (HR-TEM) was used to estimate the particle size, shape and uniformity of all the synthesized samples. Particle size was observed to be around 4–5 nm. A fine layer of ferrite nanoparticles on the surface of CNTs was also confirmed. Optical studies of the entire samples showed wide coverage of visible light spectrum from 675–1050 nm. Magnetic studies of the all samples were carried out using vibrating sample magnetometer and a significant increase in the saturation magnetization and coercivity values with cobalt ion doping was observed. This increase could be attributed to the higher magnetic moment of Co2+ ions (3 μB) as compared to Cu2+ ion (1 μB) at B-sub lattice. Comparative photocatalytic activity was also elevated and it was found that ferrite–CNTs nanocomposites show higher catalytic activities for the degradation of Rhodamine B dye in comparison with the ferrite nanoparticles.


1. Introduction

Research groups have explored the vital use of nano ferrites in numerous advanced techniques due to their unique physical and chemical properties.1–3 The nano dimensions of iron oxide materials completely change their domain of operation in the field of magnetism, optics, catalysis and wave absorbers.4–6 Particles of ferrite in nano range show an extraordinary behavior in comparison to their bulk counterparts. However, strong urge of ferrite nanoparticles to agglomerate has been considered as a major problem which deprives their application in the field of nanofluids, drug delivery and heterogeneous catalysts.7,8

Particle aggregation, nano-range stability with defined shape and size uniformity has been vitally reliant on synthetic strategy. Reverse micelle synthesis has an asset over other synthetic protocols in aspects of narrow size distribution, stability, confined particle dimensions and controlled shape of ferrite nanoparticles. Further, nanoferrite have been encrusted over the various solid scaffold matrices such as silica, carbon nanotubes, zeolites and polymer materials so as to improve their applicability and enhance their nano range stability.9–12

So, substitution of suitable transition metal ion into the lattice of spinel ferrite, its synthesis methodology and attachment with apposite solid scaffold matrix brings revolutionary change in the properties of heterojunction composites.

It is interesting to study the substitution of cobalt ion at the octahedral site of the copper ferrite spinel structure through micro-emulsion synthesis. Further, cobalt doped copper ferrite nanoparticles13–15 can be ensheathed on the reflective curved surface of CNTs which give rise to synergistic effect. Thus, so produced synergistic effect, amazingly change their behavior in the desired direction providing complete stabilization to nanoparticles on solid support medium.16,17 Such heterojunction nanocomposites behave as a single entity which retains the properties of both adjoining materials. Also, the issue of stability of tiny nano magnets of metal doped ferrites has been resolved by providing a suitable platform for growth.

Various research groups have encrusted the ferrite nanoparticles on the surface of CNTs and graphene. Zhou et al.18 attached the cobalt ferrite nanoparticles of around 20–30 nm size on the surface of CNTs by one pot polyol method. Huge lumps of ferrite nanoparticles were grown on the surface of tubes. Unal et al.19 reported the loading of super paramagnetic cobalt ferrite nanoparticles on the surface of carboxyl functionalized CNTs using co-precipitation method. The surface oxidized CNTs provided a strong adhesion between the nanotubes and the homogeneous cobalt nanoferrite. Value of saturation magnetization was 11.5 emu g−1. Jiang et al.20 decorated the cobalt ferrite nanoparticles on the surface of CNTs using polymer wrapping technique. Poly sulfostyrene with negatively charge polyelectrolyte was first grafted on the surface of carbon nanotube, which then absorbed the ferrite nanoparticles efficiently on the tube surface. Saturation magnetization value of as obtained ferrite–CNT nanocomposite was 29.6 emu g−1 with negligible coercivity which pointing towards their super paramagnetic behavior.

Similar synthesis techniques were employed to axially decorate mixed spinel ferrite nanoparticles on the tubular surface of carbon. Chen et al.21 synthesized the zinc doped cobalt ferrite–CNT nanocomposite with solvothermal method. However, aggregation of ferrite nanoparticles in the form of lumps of around 100 nm was observed from the Transmission Electron Microscope (TEM) images.

Considering the above mentioned problems of agglomeration, irregular size distribution and inadequate attachment of ferrite nanoparticles on solid matrix, this paper reports the synthesis of stoichiometric doping of cobalt ion in the surface exposed octahedral sites of copper nanoferrite sub-lattice and their encrustation on CNTs using low cost microemulsion technique. Comparative structural, optical, magnetic and photo-catalytic properties of nanoferrite and their MWCNTs (multiwalled carbon nanotubes) nanocomposites have been scrutinized. All the samples were thoroughly investigated using Powder X-ray Diffraction, EDX (Energy Dispersive X-ray Spectroscopy), WDXRF (Wavelength Dispersive X-ray Florescence Spectroscopy). Nanoferrite tethered on reflective MWCNTs surface was analyzed using HR-TEM (High Resolution Transmission Electron Microscopy) and Raman spectroscopy. A comparative photocatalytic behavior of the pure cobalt doped copper ferrite and their nanocomposite with CNTs was evaluated for the RhB dye degradation.

2. Experimental

2.1. Materials

Cobalt chloride hexahydrate (CoCl2·6H2O, 97%), copper chloride tetrahydrate (CuCl2·4H2O, 98%), ferric chloride (FeCl3, 99.5%), sodium dodecyl sulfate (SDS, 90%), sodium hydroxide (NaOH, 98%), sulphuric acid (H2SO4, 98%), hydrogen peroxide (H2O2, 30% w/v) and Rhodamine B (99.7%) were purchased from Loba Chemicals, Chandigarh, India and were used without further purification. Absolute ethanol (C2H5OH, 99.9%), 1-butanol (C4H10O, 99.7%) and n-hexane (C6H14, 99.7%) were purchased from Fisher Scientific, Chandigarh, India. Graphite rods (5 mm × 150 mm) were purchased from Popular Science Apparatus Workshops Pvt. Ltd. Ambala, India. Deionized water was obtained using an ultrafiltration system (Milli-Q, Milipore) with the measured conductivity of 35 mho cm−1 at 25 °C.

2.2. Physical measurements

The powder X-ray Diffractometer (XRD) D8 advanced, from Bruker, of scan type locked coupled, scan angle 20–80° range, scan step 0: 02°, scan speed 3° min−1, maximum power 40 kV/40 mA, Cu tube, T/T horizontal was used to analyze the phase purity of the synthesized samples. The scan time for each sample was about 20 minutes and the wavelength of Cu-Kα target was 1.5406 Å. DIFFRAC-plus TOPAS, version 2.1 technical reference software was used to calculate the dimensional changes in the lattice parameter. The Fourier-Transform Infrared (FT-IR) spectra for all the samples were recorded by FT-IR instrument (PERKIN ELMER) using KBr pellets in the range 4000–400 cm−1. High Resolution Transmission Electron Microscope (HR-TEM) images were recorded using FEI Technai G2 F20 operated at 200 keV with magnification of 6 × 10⁶ times and resolution of 0.2 Å. Optical properties were analyzed using the UV-Vis spectrophotometer (Analytikjena SPECORD-205). The magnetic properties were measured at room temperature by a Vibrating Sample Magnetometer (VSM) (155, PAR) up to a magnetic field of ±10 kOe. Photo catalysis was performed using visible light irradiation setup. Visible light irradiation set up consisted of 160 W mercury lamp having light intensity of 96[thin space (1/6-em)]000 lux. Photo-irradiated set-up is kept in perpendicular direction having a distance of 6 inches between the light source and target surface (dye solution).

2.3. Preparation of cobalt doped copper ferrite nanoparticles

Cobalt doped copper ferrite nanoparticles were prepared using microemulsion technique. In this method, two micro emulsion systems were prepared using water[thin space (1/6-em)]:[thin space (1/6-em)]sodium dodecyl sulphate[thin space (1/6-em)]:[thin space (1/6-em)]hexane[thin space (1/6-em)]:[thin space (1/6-em)]1-butanol (89.82[thin space (1/6-em)]:[thin space (1/6-em)]3.03[thin space (1/6-em)]:[thin space (1/6-em)]1.637[thin space (1/6-em)]:[thin space (1/6-em)]5.568, w/w) in appropriate weight ratio.22 These two microemulsion systems were stirred for 15 min until the solution became transparent which confirmed the formation of stable emulsion. Metals salts in stoichiometric proportion were dissolved in microemulsion system 1 and 20 ml of 5 M sodium hydroxide as a precipitating agent was dissolved in the microemulsion system 2. These two emulsions systems were then slowly mixed and kept on vigorous stirring for 1 hour with magnetic stirrer at room temperature. Brown colored precipitates were formed which indicated the formation of metal hydroxide. These precipitates were further filtered and washed using deionized water and ethanol. As obtained sample were then air dried and then kept in muffle furnace at 400 °C for 5 hours for the annealing which formed the stable ferrite nanoparticles.

2.4. Preparation of cobalt doped copper ferrite–MWCNTs nanocomposites

For the synthesis of cobalt doped copper ferrite–MWCNTs nanocomposites, firstly MWCNTs were prepared using arc discharge method23 which were further washed using deionized water and ethanol and then air dried. Amorphous carbon was removed by keeping the dried sample in furnace at a temperature of 400 °C for 30 min with a ramp rate of 10 °C min−1. CNTs were further purified and functionalized by refluxing in 8 M nitric acid. As obtained carbon nanotubes had negative charged carboxyl and hydroxyl functional groups on the surface. Further, 200 mg of functionalized CNTs were dispersed in the microemulsion system 1 along with the metal salt solution. 5 M NaOH (40 ml) was dissolved in the microemulsion system 2. These two systems were mixed and magnetically stirred for 1 hour at room temperature. Precipitates of metal hydroxide tethered on the CNTs surface were washed with deionized water and ethanol and filtered using 0.22 micron filter membrane. Thus as obtained samples were air dried overnight and then annealed at 400 °C for 5 hours. Yield of the nanocomposites so obtained is 1.25 g.24

2.5. Photocatalytic activity

Catalytic activities of cobalt doped copper ferrite and their corresponding nanocomposites were evaluated for the degradation of Rhodamine B (RhB) dye as standard pollutant. Firstly, 50 μM of RhB dye (100 ml) solution was prepared and the pH of this solution was adjusted to 2.5. This solution was kept in dark for 30 min so as to achieve the adsorption–desorption equilibrium. In order to generate the photo-fenton reagent, 100 μL of H2O2 (30% w/v) and 50 mg of the nanoferrite catalyst was added to the dye solution prior to irradiation. The solution was then kept under visible light lamp with continuous magnetic stirring. To study the time dependent degradation of dye, 2 ml of the aliquots were withdrawn from the solution at regular intervals of time. The catalyst was removed from the sample using syringe filter membrane and then UV-Visible spectra were recorded for all the aliquots to study the degradation.

3. Results and discussion

3.1. Fourier transform infra-red (FT-IR) and Raman spectroscopy

FT-IR spectroscopy confirmed the formation of M–O bond in ferrite nanoparticles. The FT-IR spectra for the entire ferrite composition are shown in Fig. S1 (ESI). Appearance of sharp band at 550 cm−1 was due to the presence M–O bond corresponding to the metal ion present in the tetrahedral sites. The band due to the M–O bond corresponding to the metal ion present in the octahedral sites could not be observed. This could be due to the reason that sometimes the band corresponding to octahedral site stretching appear below 400 cm−1. The attachment of ferrite nanoparticle with CNTs was also confirmed. Functionalization of CNTs with carboxyl group was confirmed by the appearance of band at 1745 cm−1 which is the characteristic peak for the carboxylic group, which appeared in the FT-IR spectra of nitric acid treated CNTs.24 The appearance of band at same position around ∼550–600 cm−1 was observed in the ferrite–CNTs nanocomposite heterojunction as shown in Fig. S2 (ESI) which matches well with the literature reported values.25 Raman spectra of Cu0.4Co0.6Fe2O4–MWCNTs nanocomposite is shown in Fig. S3 (ESI). Appearance of the D-band and G-band around 1348 and 1578 cm−1 with an emergence of shoulder peak around 1621 cm−1 confirms the presence of highly pure CNTs. Presence of Cu0.4Co0.6Fe2O4 is confirmed from Raman scattering peaks around 478, 539 and 655 cm−1. High frequency peaks (650–700 cm−1) corresponds to the tetrahedral mode of vibration of mixed spinel structure of ferrite whereas low frequency vibration (450–650 cm−1) relates to the octahedral site of the ferrite structure.

3.2. Powder X-ray diffraction (XRD) characterization

Phase formation of cobalt doped copper ferrite nanoparticles and their nanocomposites were thoroughly investigated using Powder X-ray Diffraction technique. Fig. 1 shows the diffraction pattern of cobalt doped copper ferrite nanoparticles annealed at 400 °C.
image file: c5ra03330f-f1.tif
Fig. 1 XRD pattern of cobalt doped cobalt doped cobalt ferrite (CoxCu1−xFe2O4) where (a) x = 0.0, (b) x = 0.2, (c) x = 0.6, (d) x = 0.8 and (e) x = 1.0.

The diffraction peaks correspond to (2 2 0), (3 1 1), (4 0 0), (4 4 0) and (5 1 1) lattice planes of cobalt doped copper ferrite which exhibited face centered cubic crystal structure26 with Fd[3 with combining macron]m space group and XRD results are in good agreement with JCPDS-00-001-1121. Similarly, nanocomposites of cobalt doped copper ferrite with CNTs indexed the same lattice planes as that for ferrite nanoparticles with an additional peak corresponding to (002) plane of hexagonal shape CNTs. Appearance of (002) plane in the nanocomposites clearly indicated that CNTs remain unaffected during the microemulsion treatment followed by annealing at 400 °C. A very small peak corresponding to CuO was also observed for the case of pure copper ferrite nanoparticles and CNTs nanocomposites. With the Co2+ ion doping into the copper ferrite, lattice peak corresponding to CuO disappeared as shown in Fig. 2.


image file: c5ra03330f-f2.tif
Fig. 2 Powder XRD pattern of CoxCu1−xFe2O4–MWCNTs where (a) x = 0.0, (b) x = 0.2, (c) x = 0.6, (d) x = 0.8 and (e) x = 1.0.

In order to calculate the crystallite size for the ferrite nanoparticles and their corresponding CNTs nanocomposites, scherrer's formula was applied.27

d = /β[thin space (1/6-em)]cos[thin space (1/6-em)]θB
where d is the average crystallite size, K is the shape factor approximated to 0.9, β is the line broadening at half the maximum intensity (at full width half of maximum intensity, FWHM), λ is the X-ray wave length. Crystallite size was calculate using the most broad and intense peak at 35.4° in both the cases. Broadness in the peak was due to smaller average crystallite size. Table 1 lists average crystallite size and the lattice parameter value for ferrite nanoparticles and their CNTs nanocomposites.

Table 1 Crystallite size of CoxCu1−xFe2O4 with different concentration of Co2+ ions
Nanoferrite samples Lattice parameter a (Å) Average crystallite size (nm)
CuFe2O4 8.397 11.3
Co0.2Cu0.8Fe2O4 8.393 8.1
Co0.6Cu0.4Fe2O4 8.385 9.6
Co0.8Cu0.2Fe2O4 8.383 6.1
CoFe2O4 8.382 5.4
CuFe2O4–MWCNTs 8.395 9.1
Co0.2Cu0.8Fe2O4–MWCNTs 8.391 7.8
Co0.6Cu0.4Fe2O4–MWCNTs 8.387 6.7
Co0.8Cu0.2Fe2O4–MWCNTs 8.379 7.1
CoFe2O4–MWCNTs 8.38 5.9


Calculation of lattice parameters for ferrite nanoparticle is an important study which significantly confirms the suitable metal ion doping in the lattice of spinel ferrite nanoparticles. Le-bail refinement method was used to calculate shifting in the lattice parameter of cobalt doped copper ferrite nanoparticles. A small shifting in the lattice parameter for cobalt doped copper ferrite nanoparticles and their CNTs nanocomposites was observed as shown in the Fig. 2(a) and (b). Lattice parameter decrease with the cobalt ion doping in the copper ferrite nanoparticles which is due to the smaller ionic radii of the Co2+ ion (0.65 Å) as compared to the Cu2+ ion (0.73 Å).26

3.3. HR-TEM, EDX and WDXRF characterization

The shape and morphology of the entire ferrite composition and CNTs encrusted with the ferrite nanoparticles were studied using HR-TEM analysis. Before analysis, synthesized MWCNTs (2 mg) were well dispersed in ethanol (20 ml) using high frequency sonication for 20 minutes. A drop of as prepared sample was put on the copper grid. Grid was allowed to air dried for 10 minutes and similarly ferrite–MWCNTs sample was agitated ultrasonically in ethanol for 20 minutes to avoid aggregation of the samples. The shape and morphology of the functionalized CNTs is shown in Fig. 3(a).
image file: c5ra03330f-f3.tif
Fig. 3 HR-TEM images (a) purified and functionalized MWCNTs and inset showing the SAED pattern with (002) lattice plane (b–d) showing the size and shape of cobalt doped copper ferrite at different resolution.

Large numbers of CNTs were perfectly entangled in the form of bundles along with some individual tubes. The size of these bundles was observed to be around 150 nm whereas the size of the individual nanotube was around 20 to 30 nm. Round shaped fullerene were also seen in the TEM image which was produced as a byproduct in a very trace amounts. Scattered Area Electron Diffraction (SAED) pattern of CNTs showed the (002) lattice plane which matches well with the data corresponding to the planes provided by powder XRD. Fig. 3(b)–(d) shows the nanoparticles of cobalt doped copper ferrite at different resolution depicting the morphology and shape of ferrite nanoparticles. Ferrite nanoparticles were observed to be of around 4–5 nm size with a spherical shape. Fig. 3(b) shows the ferrite nanoparticles at low resolution and some amount of aggregation can be seen in the image. Anyhow, when the instrument was operated at high resolution of around 2 to 5 nm, different boundary walls of ferrite nanoparticles were clearly observed. Thus, microemulsion method plays a crucial role in the nanoparticles dispersity due to the presence of nano water pools in emulsion where the metal salts and precipitating agent reacts in the constrained boundaries.28 The deposition of these synthesized nanoparticles on the surface of carbon scaffold matrix i.e. nanotubes is shown in Fig. 4.


image file: c5ra03330f-f4.tif
Fig. 4 HRTEM images (a and b) CoxCu1−xFe2O4–MWCNTs nanocomposites at low resolution with inset showing the SAED pattern (c) ferrite–CNTs nanocomposites at high resolution (d) CoxCu1−xFe2O4–MWCNTs nanocomposites showing fringe width (e) profile of frame showing the different interplaner distance of ferrite–CNTs.

TEM images of the ferrite–CNTs nanocomposites showed an interesting result that a fine layer of ferrite nanoparticles are completely covered the surface of CNTs. Although, some ferrite nanoparticles were not attached on the surface of tubes and can be seen on the grid as well. This could be due to smaller amount of CNTs used or strong sonication of the nanocomposite sample. Lumps of ferrite nanoparticles as reported by Chen et al.21 are not present in the nanocomposite samples as can be seen in the images which clearly indicated fine encrustation of ferrite nanoparticles on the tube surface. SAED pattern of cobalt doped copper ferrite–MWCNTs nanocomposites showed the good crystallinity with three concentric rings corresponding to the (311) and (440) plane of ferrite nanoparticles and (002) plane of the CNTs. Interlayer spacing in the ferrite nanoparticles can be calculated using the profile of frame. The distance between the two consecutive peaks represent the interlayer spacing which came out to be 0.21, 0.25 and 0.29 nm for the ferrite nanoparticles whereas for the CNTs, the values of the interlayer distance was around 0.33 nm as shown in Fig. 4(e).

EDX spectrum, shown in Fig. S4 (ESI), indicated that the obtained samples were composed of Cu, Co, Fe and O elements. However, a very small peak of sulfur (0.7%) appeared in ferrite–CNTs nanocomposites which could be due to the incomplete removal of surfactant. WDXRF spectrum of the Cu0.4Co0.6Fe2O4–MWCNTs nanocomposite is shown in Fig. 5. It is clear from that entire elemental composition exists in the definite stoichiometry. Iron, cobalt an copper having higher kα1 are found in the 2[thin space (1/6-em)]:[thin space (1/6-em)]0.6[thin space (1/6-em)]:[thin space (1/6-em)]0.4 ratio (47.0%[thin space (1/6-em)]:[thin space (1/6-em)]14.3%[thin space (1/6-em)]:[thin space (1/6-em)]10.2%) in the sample. However, carbon and oxygen is not appeared in the spectra due to lower kα1 energy values which are confirmed by the Raman spectroscopy and EDX analysis.


image file: c5ra03330f-f5.tif
Fig. 5 Typical WDXRF spectra for the Cu0.4Co0.6Fe2O4–MWCNTs nanocomposite showing the elemental composition.

3.4. Diffused UV-Visible reflectance spectra CoxCu1−xFe2O4 nanoparticles

Optical properties of MWCNTs, cobalt doped copper ferrite nanoparticles and their corresponding CNTs nanocomposites were analyzed by diffused UV-Visible reflectance spectroscopy. Band edge absorption for all the samples was calculated using this technique which assigns a range for absorption of suitable wavelength from the solar spectrum. Diffused UV-Visible spectra of MWCNTs depicted in Fig. S5 (ESI) and it is clear that CNTs have negligible absorption in the visible region. Fig. 6(a) shows the band edge absorption spectra of cobalt doped copper ferrite nanoparticles for different values of Co2+ ions as a dopant. The absorbance results demonstrated that Cu–Co ferrite nanoparticles had significant absorbance in 825–1050 nm wavelength range of the visible region which was important for photo catalytic reaction. Band edge absorption onset for copper ferrite was at 825 nm and with the Co2+ ion doping the edge absorption value sequentially increased. Absorption edge values found for CoxCu1−xFe2O4 nanoparticles were 856, 902, 960 and 1050 nm for x = 0.2, 0.6, 0.8 and 1.0 respectively. Deposition of cobalt doped copper ferrite nanoparticles on the CNTs surface exhibited the solar spectrum absorption in the range of 680–995 nm as shown in Fig. 6(b). This was due to synergistic effect of CNTs with the ferrite nanoparticles which decrease their band edge absorption.
image file: c5ra03330f-f6.tif
Fig. 6 Diffused UV-Visible spectra of (a) cobalt doped copper ferrite nanoparticles and (b) cobalt doped copper ferrite–MWCNTs nanocomposites.

3.5. Band gap of CoxCu1−xFe2O4 nanoparticles

The band gap energy values were estimated by a plot of (αhv)2 vs. photon energy (). The optical absorption coefficient near the band edge follows the equation:29
αhν = A(Eg)1/2
where α, h, ν, Eg, and A are the absorption coefficient, Plank's constant, light frequency, band gap, and proportionality constant, respectively. The calculation of the band gap energy involves the extrapolation of the linear part of the curve obtained by plotting (αhν)2 vs. () to cut the energy axis. The estimated band gap values for CoxCu1−xFe2O4 nanoparticles were found to be 1.4, 1.44, 1.37, 1.29 and 1.2 eV for x = 0.0, 0.2, 0.6, 0.8 and 1.0 respectively. A significant change in the band gap values indicated the large range for the visible region absorption. Similarly, nanocomposites of CNTs with CoxCu1−xFe2O4 nanoparticles had band gap value of around 1.82 eV for the copper ferrite–CNTs nanocomposite and this value decreased with increase in the cobalt ion doping in the material. Values of the band gap for cobalt doped copper ferrite–CNTs with x = 0.2, 0.6, 0.8 and 1.0 were estimated to be around 1.76, 1.70, 1.42 and 1.25 eV respectively. Increase in the band gap value of nanocomposites as compared to nanoparticles indicated the formation of energy levels or interface defects due to synergistic effect of ferrite with carbon tubes which decreased the electron hole recombination and values of band gap significantly increased.30

3.6. A comparative magnetic properties of CoxCu1−xFe2O4 nanoparticles and CoxCu1−xFe2O4–MWCNTs nanocomposites

Hysteresis loops for all the samples were recorded at 298 K using VSM by applying the external magnetic field between ±10 kOe and are shown in Fig. 7.
image file: c5ra03330f-f7.tif
Fig. 7 Magnetic hysteresis loops of (a) CoxCu1−xFe2O4 nanoparticles and (b) CoxCu1−xFe2O4–MWCNTs nanocomposites.

It was observed that the saturation magnetization increased with increase in Co2+ ion concentration (Table 2). This behavior of saturation magnetization can easily be explained on the basis of Neel's two sub-lattice model. According to this model, the magnetic moment per formula unit in Bohr magneton nNB(χ) is expressed:31

nNB(χ) = MB(χ) − MA(χ)
where MB and MA are magnetization of B and A sub-lattices, respectively.

Table 2 Saturation magnetization, coercivity and remanance of CoxCu1−xFe2O4 nanoparticles and CoxCu1−xFe2O4/MWCNTs nanocomposites
Nanoferrite samples Saturation magnetization Ms (emu g−1) Coercivity Hc (Oe) Remanance Mr (emu g−1)
CuFe2O4 17.3 9 0.2
CuFe2O4–MWCNTs 12.9 40 0.7
Co0.2Cu0.8Fe2O4 19.2 160 1.5
Co0.2Cu0.8Fe2O4–MWCNTs 15.4 120 0.8
Co0.6Cu0.4Fe2O4 24.5 100 0.9
Co0.6Cu0.4Fe2O4–MWCNTs 16.5 75 0.6
Co0.8Cu0.2Fe2O4 26.2 375 4.9
Co0.8Cu0.2Fe2O4–MWCNTs 20.6 300 8.7
CoFe2O4 33.9 500 9.7
CoFe2O4–MWCNTs 29.2 525 12.5


The increase in the saturation magnetization was attributed to the higher magnetic moment of Co2+ ion (3 μB) as compared to its substituted counterpart Cu2+ ion (1 μB). Hence, magnetic moment at B-sub lattice sequentially increased with increase in the cobalt doping which lead to the overall increase in the magnetic moment of the sample with Co2+ ion doping.26 The values of saturation magnetization, coercivity and remanance are given in Table 2.

With increase in cobalt ion doping in the copper ferrite, values of coercivity also increased monotonically. Value of coercivity was found to be 8 Oe for copper ferrite and with the cobalt ion doping, coercivity value increased significantly and reached around 510 Oe for pure cobalt ferrite. Similar trends in the saturation magnetization values were observed for the CNTs ferrite nanocomposites as shown in Fig. 7(b). However, saturation magnetization values for the nanocomposites were found to be smaller as compared to their corresponding nanoparticle counterpart. This decrease in the values of saturation magnetization could be due to the non-magnetic CNTs present in the nanocomposite sample.

3.7. Photo catalytic activity

The photo-catalytic activity of copper ferrite and the influence of stoichiometric doping of cobalt ion and introduction of solid scaffold CNTs matrix in CoxCu1−xFe2O4 nano-particles were evaluated for the degradation of Rhodamine B (RhB) solution. The photo-irradiated setup for the photocatalysis of RhB solution is shown in Fig. S6 (ESI). The UV-visible spectra of RhB solution showed characteristic peaks at a wavelength of 556 nm. It was found that copper ferrite completely degraded the RhB dye in 120 min. On addition of cobalt ion to copper ferrite lattice, the degradation rate slowly increased from x = 0.0 to 0.8 and on complete substitution of cobalt ion into the copper ferrite lattice, sharp decrease in the initial reaction rate was observed. However, the rate of reaction for the cobalt ferrite increases sharply after 40 minutes. Co0.8Cu0.2Fe2O4 sample was found to have the highest rate of reaction and degrade the dye in 100 minutes. The percentage photocatalytic degradation was calculated by applying following equation32
image file: c5ra03330f-t1.tif
where Ao is the initial RhB concentration and At is the concentration of RhB at time t. Fig. 8(a) shows the percentage degradation of the dye with time for the nano-ferrites.

image file: c5ra03330f-f8.tif
Fig. 8 Degradation percentage of 50 μM Rhodamine B dye (pH = 2.5) over the time using 50 mg of (a) cobalt doped copper ferrite nanoparticles (b) cobalt doped copper ferrite–MWCNTs nanocomposites using 100 μL of H2O2.

Degradation rate for the nanocomposites were also studied which show significant increase in the rate of reaction. Co0.8Cu0.2Fe2O4–MWCNTs completely degrade the RhB dye in 60 min. An energy level diagram is depicted in the Fig. 9 which elaborates the effectiveness of cobalt doped copper ferrite–MWCNTs nanocomposites. Effect of CNTs for the photocatalytic activity was observed in all the nanocomposite samples. However, it was distinctively seen for cobalt ferrite. A significant change in the rate of the reaction was observed when cobalt ferrite nanoparticles were encrusted on the CNTs surface. Form the obtained results, it can be concluded that presence of CNTs significantly enhances the catalytic properties. This could be due to synergistic effect of CNTs with ferrite nanoparticles33 which can be explained from Fig. 9. It is clear from energy level diagram that irradiation of CNTs yield photo-generated electrons which transferred to the copper ferrite nanoparticles. CuFe2O4 nanoparticles having band gap of 1.4 eV and electrons from the valence band of the copper ferrite excited to conduction band. After doping with the cobalt ion in the copper ferrite spinel lattice, band gap of the cobalt doped copper ferrite nanocomposite reduced (1.2 eV) and this facilitates the easy transportation of electron form higher conduction band of copper ferrite to the lower conduction band of cobalt doped copper ferrite. So, this process restricts the electron hole recombination rate and subsequently facilitates the decomposition of H2O2 which produce the hydroxyl radical and decolorize the dye molecule.34


image file: c5ra03330f-f9.tif
Fig. 9 Energy level diagram showing the mechanistic aspect for the degradation of RhB dye.

3.8. Recyclability

Recyclability of the Co0.8Cu0.2Fe2O4–MWCNTs nanocomposite sample is important due to its future applicability in the degradation of organic pollutant present in various water sources. Such nanocomposites are easily separable from reaction mixture using an external magnet due to their excellent magnetic properties. So, on the completion of reaction process, an external magnet is used to drive the magnetic nanocomposite form the reaction beaker. So obtained nanocomposite sample is washed 3 times with distilled water and kept in oven at 100 °C for 5 hours. Recovered catalyst is again dispersed in RhB solution. Fig. S7 (ESI) showing no significant loss in the activity of nanocomposite sample even after five consecutive cycles.

4. Conclusion

Cobalt doped copper ferrite nanoparticles were successfully synthesized by microemulsion method and their deposition on the surface of carbon nanotubes was also accomplished and thoroughly studied using HR-TEM technique. Formation and doping of cobalt ion into the copper ferrite lattice and their corresponding nanocomposites was confirmed by powder XRD. Optical studies of the entire samples revealed that ferrite nanoparticles absorbed the visible light in the range of 825–1050 nm. However, ferrite–CNTs nanocomposites absorb the visible light in the region of 680–995 nm. Magnetic studies revealed that with cobalt ion doping, value of saturation magnetization and coercivity increased and reached a maximum value of 33.5 emu g−1 whereas the values for ferrite–CNTs nanocomposite were smaller. Photocatalytic properties of all the samples were also studied and Co0.8Cu0.2Fe2O4–MWCNTs nanocomposite sample was found to be the most catalytically active amongst all the samples.

Acknowledgements

The authors are grateful to Department of Science and Technology (DST) and Council of Scientific and Industrial Research (CSIR) for providing the necessary financial support.

References

  1. A. H. Lu, E. L. Salabas and F. Schuth, Angew. Chem., Int. Ed., 2007, 46, 1222–1244 CrossRef CAS PubMed.
  2. S. Shylesh, V. Schunemann and W. R. Thiel, Angew. Chem., Int. Ed., 2010, 49, 3428–3459 CrossRef CAS PubMed.
  3. M. Zhu and G. Diao, Nanoscale, 2011, 3, 2748 RSC.
  4. P. Xiong, Y. Fu, L. Wang and X. Wang, J. Chem. Eng., 2012, 195–196, 149–157 CrossRef CAS PubMed.
  5. C. A. Demarchi, A. Debrassi, F. C. Buzzi, R. Correa, V. C. Filho, C. A. Rodrigues, N. Nedelko, P. Demchenko, A. S. Waniewsk, P. Duzewski and J. M. Grenechec, Soft Matter, 2014, 10, 3441–3450 RSC.
  6. A. M. Gama, M. C. Rezende and C. C. Dantas, J. Magn. Magn. Mater., 2011, 323, 2782–2785 CrossRef CAS PubMed.
  7. T. T. Baby and S. Ramaprabhu, J. Mater. Chem., 2011, 21, 9702 RSC.
  8. R. K. Singh, K. D. Patel, J. J. Kim, T. H. Kim, J. H. Kim, U. S. Shin, E. J. Lee, J. C. Knowles and H. W. Kim, ACS Appl. Mater. Interfaces, 2014, 6, 2201 CAS.
  9. K. Nadeema, F. Zeb, M. Azeem Abid, M. Mumta and M. Anis ur Rehman, J. Non-Cryst. Solids, 2014, 400, 45 CrossRef PubMed.
  10. L. Khanna and N. K. Verma, Biocompatibility and superparamagnetism in novel silica/CaFe2O4 nanocomposite, Mater. Lett., 2014, 128, 376 CrossRef CAS PubMed.
  11. D. Y. Park and S. T. Myung, ACS Appl. Mater. Interfaces, 2014, 6, 11749 CAS.
  12. Z. Li, Y. Shen, Y. Guan, Y. Hu, Y. Lin and C. W. Nan, J. Mater. Chem. A, 2014, 2, 1967 CAS.
  13. D. Carta, M. F. Casula, A. Falqui, D. Loche, G. Mountjoy, C. Sangregorio and A. Corrias, J. Phys. Chem. C, 2009, 113, 8606 CAS.
  14. C. Pereira, A. Pereira, C. Fernandes, M. Rocha, R. Mendes, M. P. Fernandez-Garcia, A. Guedes, P. B. Tavares, J. M. Greneche, J. P. Araujo and C. Freire, Chem. Mater., 2012, 24, 1496 CrossRef CAS.
  15. S. Briceno, H. D. Castillo, V. Sagredo, W. B. Escamillaa and P. Silvaa, Appl. Surf. Sci., 2012, 263, 100 CrossRef CAS PubMed.
  16. P. Xiong, Y. Fu, L. Wang and X. Wang, J. Chem. Eng., 2012, 195–196, 149 CrossRef CAS PubMed.
  17. Y. Fua, H. Chen, X. Sun and X. Wang, Appl. Catal., B, 2012, 111–112, 280 CrossRef PubMed.
  18. L. Zhou, L. Jia, P. C. Ma, Y. Shao, H. Zhang, W. Gao and Y. Li, J. Hazard. Mater., 2014, 265, 104 CrossRef CAS PubMed.
  19. B. Unal, M. Senel, A. Baykal and H. Sozeri, Curr. Appl. Phys., 2013, 13, 1404 CrossRef PubMed.
  20. W. Jiang, Y. Liu, F. Li, J. Chu and K. Chen, J. Mater. Sci. Eng. B, 2010, 166, 132 CrossRef CAS PubMed.
  21. Y. Chen, X. Wang, Q. Zhang, Y. Li and H. Wang, J. Alloys Compd., 2011, 509, 4053 CrossRef CAS PubMed.
  22. S. T. Hussain, S. R. Gilani, S. D. Ali and H. S. Bhatti, J. Alloys Compd., 2012, 544, 99 CrossRef CAS PubMed.
  23. S. Singhal, C. Singh, P. Singla and K. Dharamvir, Solid State Phenom., 2013, 201, 197 CrossRef.
  24. C. Singh, S. Bansal and S. Singhal, Phys. B, 2014, 444, 70 CrossRef CAS PubMed.
  25. R. Sharma and S. Singhal, Phys. B, 2013, 414, 83 CrossRef CAS PubMed.
  26. A. Azam, J. Alloys Compd., 2012, 540, 145 CrossRef CAS PubMed.
  27. A. Goyal, S. Bansal and S. Singhal, Int. J. Hydrogen Energy, 2014, 39, 4895 CrossRef CAS PubMed.
  28. S. Kumar, V. Singh, S. Aggarwal and U. K. Mandal, J. Mater. Sci. Eng. B, 2010, 166, 76 CrossRef CAS PubMed.
  29. S. M. Chavan, M. K. Babrekar, S. S. More and K. M. Jadhav, J. Alloys Compd., 2010, 507, 21 CrossRef CAS PubMed.
  30. X. Li, Y. Hou, Q. Zhao and L. Wang, J. Colloid Interface Sci., 2011, 358, 102 CrossRef CAS PubMed.
  31. S. Bhukal, T. Namgyal, S. Mor, S. Bansal and S. Singhal, J. Mol. Struct., 2012, 1012, 162 CrossRef CAS PubMed.
  32. M. M. Rashad, R. M. Mohamed, M. A. Ibrahim, L. F. M. Ismail and E. A. Abdel-Aal, Adv. Powder Technol., 2012, 23, 315 CrossRef CAS PubMed.
  33. C. H. Chen, Y. H. Liang and W. D. Zhang, J. Alloys Compd., 2010, 501, 168 CrossRef CAS PubMed.
  34. E. Casbeer, V. K. Sharma and X. Z. Li, Sep. Purif. Technol., 2012, 87, 1 CrossRef CAS PubMed.

Footnote

Electronic supplementary information (ESI) available: See DOI: 10.1039/c5ra03330f

This journal is © The Royal Society of Chemistry 2015
Click here to see how this site uses Cookies. View our privacy policy here.