Physical and chemical studies of tungsten carbide catalysts: effects of Ni promotion and sulphonated carbon†
Cristiane B. Rodella*a,
Dean H. Barretta,
Silvia F. Moyab,
Santiago J. A. Figueroaa,
Maria T. B. Pimentab,
Antonio Aprígio S. Curvelobc and
Victor Teixeira da Silvad
aBrazilian Synchrotron Light Laboratory (LNLS)/Brazilian Center for Research in Energy and Materials (CNPEM), C. P. 6192, 13083-970, Campinas, SP, Brazil. E-mail: cristiane.rodella@lnls.br
bBrazilian Bioethanol Science and Technology Laboratory (CTBE)/Brazilian Center for Research in Energy and Materials (CNPEM), C. P. 6192, 13083-970, Campinas, SP, Brazil
cInstitute of Chemistry of São Carlos (IQSC)/University of São Paulo (USP)/C.P. 780, CEP 13560-970, São Carlos, SP, Brazil
dUniversidade Federal do Rio de Janeiro/COPPE/Chemical Engineering Program/NUCAT, P.O. Box 68502, Rio de Janeiro, RJ 21945-970, Brazil
First published on 24th February 2015
Abstract
Ni promoted tungsten carbides have been shown to be an effective catalyst for cellulose conversion reaction. With the use of both in situ and ex situ techniques an investigation into the physical and chemical aspects of the Ni-promoted tungsten carbide catalyst supported on activated carbon either in pure form or functionalized with sulfuric acid was conducted. In situ XRD analysis performed during the carburization process showed that non-promoted samples formed a mixture of nanosized W2C, WC1−x and WC carbide phases. In the case of Ni promoted catalysts, in situ XRD, XANES, XPS and TEM analysis revealed that Ni aids in lowering the carburization temperature by 50 °C but also assisted in the deposition of polymeric carbon onto the catalyst surface which reduced cellulose conversion. However, the results indicate beneficial effects caused by the high carbon coverage by stopping the W2C to WC carbide phase transition. Thus, carburization of Ni promoted samples produced only W2C phase, which is stable up to 800 °C. The functionalization of activated-carbon with –SO3H not only increases the hydrolysis of cellulose but also lead to a greater dispersion of Ni over the catalyst. The resulting improvement in the interaction between Ni/W/C increases the cellulose transformation in a one-pot synthesis towards the production of ethylene glycol.
1. Introduction
The catalytic conversion of residual lignocellulosic biomass is one of the most promising, yet challenging methods for the production of renewable biofuels and chemicals.1–8 Recent studies have shown that tungsten carbide catalysts have great potential to selectively convert cellulose into ethylene glycol (EG) in one-pot reaction.8–15 This has revealed new possibilities for the sustainable and profitable production of this valued intermediate used in the production of polymers and antifreezes.16Instrumental restrictions currently do not allow the study of the gas–liquid–solid–solid reaction under high H2 pressure under operando conditions which results in difficulty identifying the nature of the active phase. Nevertheless, indirect studies indicates that there are strong correlations between the catalytic performance and the nature of the support,9–11,17–19 the tungsten phase (W2C, WC, W or WO2)10–14,18–21 and the promoter.9–21 However, the interaction between promoter/tungsten carbide/support during the carburization process is a point that has not been deeply explored.
Generally, tungsten carbides are obtained by the temperature-programmed carburization (TPC) of a tungsten trioxide (WO3) using a carburizing agent (e.g. CH4/H2 gas mixtures). Typically, the tungsten oxide is heated up to 650–950 °C under a controlled flow of the carburizing agent with low heating rates (ca. 1–10 °C min−1).22–30 Tungsten carbide formation proceeds via several steps from WO3 → WxOy → WO2 → W → W2C → WC, where WxOy represents a sub-stoichiometric tungsten oxide.28–30 After the reduction of WO3/WO2 to metallic W the carburization process begins when CH4 is absorbed onto the surface of metallic W, here it dissociates to form CHx species and/or C atoms. The carbon species diffuse into the bulk of the solid to initially form the W2C phase. WC formation occurs via the slow diffusion of more carbon into the W2C structure until a 1![[thin space (1/6-em)]](https://www.rsc.org/images/entities/char_2009.gif) :
:![[thin space (1/6-em)]](https://www.rsc.org/images/entities/char_2009.gif) 1 stoichiometry is reached. The CH4/H2 ratio is an important parameter to control as it relates to the deposition of pyrolytic carbon onto the surface of the tungsten carbide.24,25,27,29 Carbide phase formation can be affected by several experimental parameters such as the C/H ratio, heating rate and the addition of promoters.22–30
1 stoichiometry is reached. The CH4/H2 ratio is an important parameter to control as it relates to the deposition of pyrolytic carbon onto the surface of the tungsten carbide.24,25,27,29 Carbide phase formation can be affected by several experimental parameters such as the C/H ratio, heating rate and the addition of promoters.22–30
Despite being intensively studied since the mid 1980's, there are still many scientific and technical challenges concerning the preparation of supported tungsten carbide, notably those related to the control and optimization of the particle size and dispersion.
Although much effort has been made to understand the catalytic reaction pathways in the cellulose conversion with tungsten carbides catalyst,9–19 less attention has been paid to the structural, electronic and surface properties of this complex multifunctional catalyst from the preparation to the reaction steps. In addition, there is a lack of structural investigations correlating physical and chemical properties of the Ni-promoted tungsten carbides to their catalytic performance. This information may bring forth a better understanding of the physical and chemical parameters of Ni-promoted tungsten carbide catalysts that are important for cellulose conversion and selectivity.
Herein we report studies on the influence of the support, activated carbon compared to sulfonated activated carbon, and Ni-promotion on the structural and surface properties of the catalysts during and after the carburization process as well as post catalytic reaction. The studies were conducted using in situ X-ray diffraction (XRD), in situ X-ray absorption near edge structures (XANES), X-ray photoelectron spectroscopy (XPS), transmission electron microscopy (TEM) and N2 physisorption. Samples supported on activated carbon and non-promoted samples were also studied for comparison. The structural and surface characteristics were correlated with catalytic results from cellulose conversion.
2. Experimental section
2.1 Support and sample preparation
The sulfonated activated carbon was obtained by adding 7 g of activated-carbon (Merck) into 150 mL of concentrated H2SO4 (95–98%) (Merck) under nitrogen flow (40 mL min−1) and magnetic stirring at 80 °C for 10 h. After cooling to room temperature the sample was washed repeatedly with distilled water at 80 °C until pH = 7 was reached. The sulfonated activated carbon (C-SO3H) as well as the commercial activated-carbon were dried in a furnace at 120 °C overnight.The tungsten carbides supported on carbon and promoted using nickel were prepared with 30 wt% WxC (x = 1 or 2) and 2 wt% Ni loadings using incipient wetness impregnation method. Firstly, an aqueous solution of ammonium tungstate pentahydrate ((NH4)10W12O41·5H2O, Alfa Aesar) was incorporated into the supports (activated or sulfonated carbon (C-SO3H)). The total pore volume of the activated and sulfonated activated-carbon, determined by N2 physisorption, were 0.700 and 0.705 cm3 g−1 respectively, as shown in Table S1.† After impregnation the samples were dried in a furnace at 120 °C overnight. The Ni-promoted samples were obtained by impregnating an aqueous solution of nickel nitrate (Ni(NO3)2·6H2O, Fluka) into the W/C sample and dried again under the same conditions.
2.2 Temperature-programmed carburization (TPC)
The carburization process was carried out in a tubular quartz reactor using the TPC methodology and a flow of a 4% (v/v) H2/1% (v/v) CH4 gas mixture (100 mL min−1). The temperature was increased at 8 °C min−1 from room temperature to 750 °C for Ni-promoted samples or up to 800 °C for non-promoted ones and held isothermally for 1 h. The samples were then cooled under He flow of 50 mL min−1 and passivated under a 1% (v/v) O2/He flow (50 mL min−1) overnight before exposure to the atmosphere. The gas phase composition at the exhaust of the reactor was continuously monitored using a quadrupole mass spectrometer (Pfeifer GDS 320). The samples were coded as WxC/C and Ni–WxC/C (promoted with 2 wt% Ni) when activated-carbon was used as a support or WxC/C-SO3H and Ni–WxC/C-SO3H when sulfonated carbon was used as a support.2.3 In situ XRD
The in situ X-ray diffraction (XRD) analyses were obtained at the XRD1 and XRD2 beamlines at the Brazilian Synchrotron Light Laboratory (LNLS). A wavelength of 1.5498 Å at 8.17 keV was used. Powder samples were placed in an in house produced furnace (Arara) installed into a Huber goniometer operating in Bragg–Brentano geometry (θ − 2θ). The XRD patterns were obtained by a Mythen – 1K detector (Dectris) installed 1 m from the furnace. The TPC was performed using 4% (v/v) H2/1% (v/v) CH4, balance in He with a total flow of 100 mL min−1 and heating rate of 8 °C min−1 from room temperature up to 890 °C. In this configuration an XRD pattern (2θ = 30 to 52°) was obtained every minute with a scan-step of 0.05°. Identification of crystalline phases was obtained by comparison to the JCPDS files. The full width at half maximum (FWHM) of the peaks was determined using a pseudo-Voigt function with the crystalline sizes for tungsten carbide phases estimated using the Scherrer equation.2.4 In situ XANES and EXAFS
The in situ X-ray absorption near edge spectroscopy (XANES) measurements at the Ni K-edge (8.33 keV) were performed at the DXAS at the LNLS. DXAS is a dispersive beamline equipped with a curved Si (111) focusing monochromator operating in Bragg mode and the X-ray range varies from 4 to 14 keV focusing the beam at the sample position. The detection system is comprised of a 1152 × 1242 (500 × 900) pixel CCD solid-state detector. The samples were analyzed in a plug-flow capillary reactor and placed between quartz wool in a quartz capillary of 1 mm internal diameter. The carburization process of samples was performed using a 4% (v/v) H2/1% (v/v) CH4, balance in He with a total flow of 15 mL min−1 and a heating rate of the 8 °C min−1 up to 800 or 890 °C. The monochromator was calibrated with a Ni foil. Athena software packages were used to extract the XANES signal from the measured absorption spectra using standard proceedings. XANES spectra of the reference materials Ni0, NiO and Ni4W alloy were recorded at room temperature.2.5 XPS analysis
X-ray photoelectron spectroscopy (XPS) analyses of the passivated samples were performed with a hemispherical spectrometer from SPECS (model PHOIBOS150 HSA3500) in operation at the LNLS. The XPS uses a monochromatic Al Kα source (hν = 1486.6 eV) with a nine-channel electron multiplier detector. The monochromatic Al Kα source was operated at 10 kV and 10 mA and the spectra were obtained with an analyzer pass energy of 20 eV. The powdered samples were supported on copper double-sided tape and fixed on the XPS sample holder. The spectra were analyzed using Casa XPS software, version 2.2.99. The binding energies were referenced to the C 1s line at 284.5 eV from the adventitious carbon. The curve-fittings used in the deconvolution for W 4f, S 2p, Ni 2p, O 1s and C 1s levels were Gaussian line shapes using the Shirley function in the background simulation. The quantitative evaluation of each peak was calculated by dividing the integrated areas under the peak by the atomic sensitivity factors considering 1.0 the sensitivity factor of C 1s (binding energy of the 284.5 eV).2.6 TEM
Transmission electron microscopy (TEM) investigation of the samples in passivated form was undertaken using a JEM 3010 located at LME-LNNano, Campinas, Brazil, operating at 300 kV with a point to point resolution of 0.17 nm. The passivated samples were prepared by dispersing the powders in isopropyl alcohol and dropping the suspension onto an amorphous carbon coated copper grid.2.7 Cellulose conversion
Cellulose conversion reactions were performed using a stainless steel batch reactor (300 mL, Parr Instruments) at 4.3 MPa of H2 and at 220 °C. Firstly, 150 mL of an aqueous suspension of 1 g (dry basis) of cellulose (Avicel microcrystalline Merck) was loaded into the reactor and mixed with 0.300 g of catalyst. The reactor was sealed and purged five times with N2 at 1.4 MPa followed by a H2 purge under the same conditions. The temperature was then increased. Once the reaction temperature was reached the H2 pressure and agitation were increased to 5.8 MPa and 1000 rpm, respectively. After the predetermined reaction time was reached (30, 45, 60 or 90 minutes), the reactor was cooled to room temperature and the gas phase was transferred to a stainless steel pressure vessel (200 mL). It is noteworthy that each one of the points in the kinetic curve of a particular catalyst was obtained by setting up the experiment and performing the reaction until the predetermined time was attained. Therefore, each kinetic curve was done by repeating the experiment several times. The gas collected at the end of each one of the experiments was then analyzed is a gas chromatograph (GC, model 7890A) using a HP-Plot/Q capillary column (30 m × 0.530 mm × 40 μm) and a TCD detector. The liquid phase was centrifuged to remove the catalyst as well as any other residual solids and analyzed using a GC equipped with a DB-1 capillary column (50 m × 0.320 mm × 1.20 μm) and a FID detector to identify and quantify alcohols, glycols, acetol and glycerol. Carbohydrates and organic acids present in the liquid phase were analyzed by HPLC (Waters 1525) equipped with an Aminex HPX-87H – Bio-rad capillary column and an Acclaim 120 C18 Dionex respectively and a refractive index (RI) detector.Cellulose conversion was determined by mass balance, i.e., the difference between the weight of cellulose before and after the catalytic reaction. The product yield (PY) was determined according to the equation:
3. Results and discussion
3.1 In situ XRD
The structural transformation that occurs during the carburization process of both Ni-promoted and non-promoted tungsten carbide catalysts supported on sulfonated carbon was obtained using in situ XRD analysis and shown in Fig. 1 and 2.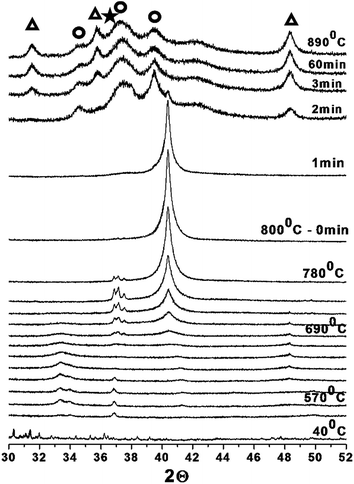 | ||
Fig. 1 In situ X-ray diffraction patterns obtained during the carburization of the WxC/C-SO3H sample:  WC; WC;  W2C and W2C and  WC1−x. WC1−x. | ||
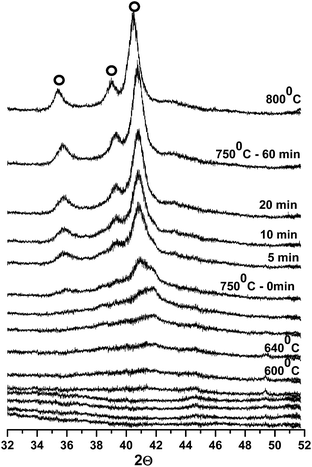 | ||
Fig. 2 In situ X-ray diffraction patterns obtained during the carburization of the Ni–WxC/C-SO3H sample:  W2C. W2C. | ||
The crystalline phase evolution of the non-promoted sample is shown in Fig. 1 and follows the sequence WO3 → WxOy → WO2 → W, which is in agreement with the literature.28
In this sequence, there is a progressive reduction of the tungsten oxide to form well-crystallized metallic tungsten at 800 °C. After two minutes at 800 °C there is an abrupt carburization of the metallic tungsten when the W2C and WC1−x carbide phases are formed simultaneously. After this rapid transition from metallic W to W2C and WC1−x, the WC phase is formed. Then, the carburization process, the non-promoted sample is composed by a mixture of three carbide phases, W2C, WC1−x, and WC, which are stable up to 890 °C. The sample showed broad diffraction peaks which are associated with an amorphous structure and/or small crystallites.
Fig. 2 shows the carburization of the Ni-promoted sample occurs in a very different manner. The in situ XRD analysis reveals that the reduction of tungsten oxide to metallic tungsten and tungsten carbide formation occurs simultaneously and at lower temperature (750 °C), when compared to the non-promoted sample (Fig. 1). Another important effect of the nickel promoter on tungsten carbide formation was the stabilization of the pure W2C phase (Fig. 2). This metastable carbide phase was shown to be stable throughout the temperature range of carburization and the isothermal treatment for 1 h at 800 °C.
In situ XRD measurements were also collected for samples supported on activated-carbon and are shown in the ESI Fig. S3 and S4.† The structural transformation during the carburization process exhibited similar trends to those observed for samples supported on sulfonated carbon (Fig. 1). For comparison, the XRD patterns of all of the carburized samples are shown in Fig. 3.
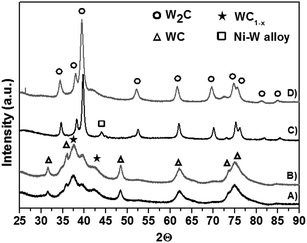 | ||
| Fig. 3 XRD patterns of the tungsten carbide samples after carburization: (A) WxC/C; (B) WxC/C-SO3H; (C) Ni–WxC/C and (D) Ni–WxC/C-SO3H. | ||
It is noteworthy that the XRD pattern showing the Ni-promoted catalyst supported on activated-carbon (Fig. 3) exhibits a peak at 2θ = 44.1°, which is attributed to a Ni4W alloy.31 This is in agreement with the XANES results that will be discussed in the following section.
3.2 In situ XANES
In situ XANES analysis at the Ni K-edge were performed during the carburization process of the Ni-promoted tungsten carbide samples to investigate the structural modification of the promoter. The normalized XANES spectra at the Ni K-edge of the samples supported on activated-carbon and sulfonated carbon are shown in Fig. 4A and B, respectively.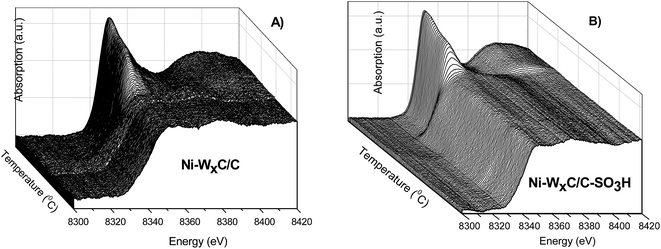 | ||
| Fig. 4 In situ XANES of the Ni K-edge obtained during the carburization process of (A) Ni–WxC/C and (B) Ni–WxC/C-SO3H. The temperature increases from back to front of the images. | ||
Prior to carburization the XANES spectra exhibit the same low-intensity pre-edge (1s → 3d transition) and high-intensity main edge (1s → 4s) transition that are typical of Ni2+ in an octahedral geometry from the Ni(NO3)2·6H2O precursor compound.32 Although the carburization process happens under a reducing atmosphere of 4% (v/v) H2/1% (v/v) CH4 and at high temperature (750 °C), the Ni has a short-range structure different from that of Ni0 (Fig. 5).
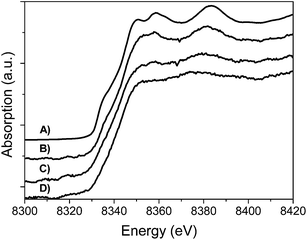 | ||
| Fig. 5 XANES of the Ni K-edge after the carburization process of Ni–WxC/C (C) and Ni–WxC/C-SO3H (D). XANES spectra of Ni0 foil (A) and Ni4W alloy (B) were also collected for comparison. | ||
Indeed, the comparison between the XANES profile of Ni in the catalysts after the carburization process and the sample of Ni–W alloy show similarities, especially for the Ni promoted catalyst supported on activated carbon (Fig. 5).
Fig. 6a and b shows the integrated area of the XANES spectra (Fig. 6) plotted as a function of temperature. It is noticeable that Ni valence and symmetry change slower during the carburization process in the Ni–WxC/C than in the Ni–WxC/C-SO3H.
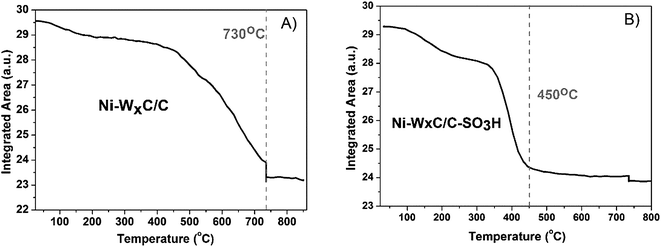 | ||
| Fig. 6 Integrated area of the in situ XANES spectra of the Ni K-edge obtained during the carburization process of samples: (A) Ni–WxC/C and (B) Ni–WxC/C-SO3H. | ||
3.3 XPS
XPS spectra were collected to investigate the effect of the carburization process on the sulfonate groups present on the surface of the support. In addition XPS aided in the characterization of tungsten and nickel species as well as determining the surface W![[thin space (1/6-em)]](https://www.rsc.org/images/entities/char_2009.gif) :
:![[thin space (1/6-em)]](https://www.rsc.org/images/entities/char_2009.gif) C ratio.
C ratio.
The XPS spectra (Fig. 7) of the S 2p signal originating from the sulfonated samples after carburization shows the S 2p core-level spectra are characterized by two components, an S 2p1/2 and S 2p3/2 which appear due to the spin-orbital splitting.
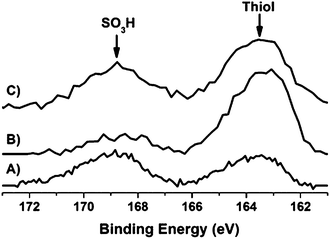 | ||
| Fig. 7 XPS spectra of the S 2p level of the sulfonated samples: (A) C-SO3H; (B) WxC/C-SO3H and (C) Ni–WxC/C-SO3H. | ||
The separation between the doublets is around 1.18 eV with an area ratio of 1![[thin space (1/6-em)]](https://www.rsc.org/images/entities/char_2009.gif) :
:![[thin space (1/6-em)]](https://www.rsc.org/images/entities/char_2009.gif) 2.33 XPS also reveals two species of sulfur present on the surface of the catalysts. The S 2p3/2 peaks are positioned at 168.5 eV and 163.2 eV which are associated with the sulfonic group (SO3H) and thiol species (C–SH), respectively.33–38 Both species remain on the surface after carburization and catalytic reaction (Fig. S5†). However, after the reaction step the XPS signal is weaker than the sample pre-reaction which may be caused by functional groups leaching during the catalytic reaction, cellulose remaining mixed with the catalysts and small loses during carburization at high temperatures.
2.33 XPS also reveals two species of sulfur present on the surface of the catalysts. The S 2p3/2 peaks are positioned at 168.5 eV and 163.2 eV which are associated with the sulfonic group (SO3H) and thiol species (C–SH), respectively.33–38 Both species remain on the surface after carburization and catalytic reaction (Fig. S5†). However, after the reaction step the XPS signal is weaker than the sample pre-reaction which may be caused by functional groups leaching during the catalytic reaction, cellulose remaining mixed with the catalysts and small loses during carburization at high temperatures.
The W 4f core-level spectra are characterized by two components, W 4f7/2 and W 4f5/2, which appear due to spin-orbital splitting. The separation between the doublets is around 2.18 eV with an area ratio of 4![[thin space (1/6-em)]](https://www.rsc.org/images/entities/char_2009.gif) :
:![[thin space (1/6-em)]](https://www.rsc.org/images/entities/char_2009.gif) 3.33 The W 5p3/2 peak is close to the W 4f core-level and is set at 5.5 eV above the W 4f7/2. The characteristic binding energy of the W 4f7/2 for W0, WC, W4+, W5+ and W6+ is 31.2, 31.6, 32.9, 34.7–35 and 35.8–36.1 eV, respectively.29,30,39
3.33 The W 5p3/2 peak is close to the W 4f core-level and is set at 5.5 eV above the W 4f7/2. The characteristic binding energy of the W 4f7/2 for W0, WC, W4+, W5+ and W6+ is 31.2, 31.6, 32.9, 34.7–35 and 35.8–36.1 eV, respectively.29,30,39
The W 4f core-level spectrum of all samples shows the surface tungsten oxide specie of WO3 which are expected due to the passivation performed after carburization (Fig. 8 and 9). However, the samples supported on sulfonated carbon also show pronounced peaks and a thinner oxide layer covering the carbide phase in comparison with non-sulfonated samples. One exploratory explanation to this phenomenon could be the electron charge transfer between sulphonic groups and tungsten on the surface of the samples. Donation of electrons from the SO3H groups to the carbide phase may be occurring, which it turn results in higher oxidation resistance.
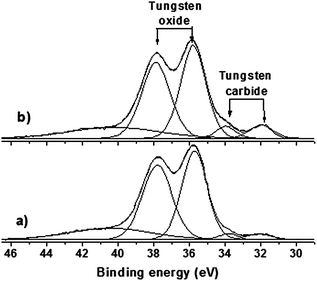 | ||
| Fig. 8 W 4f XPS spectra of tungsten carbides supported on commercial carbon after carburization and passivation: (a) WxC/C and (b) Ni–WxC/C. | ||
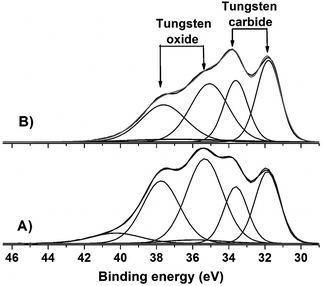 | ||
| Fig. 9 W 4f XPS spectra of tungsten carbides supported on C-SO3H after carburization and passivation: (A) WxC/C-SO3H and (B) Ni–WxC/C-SO3H. | ||
Moreover, the peak characteristic of WO3 show a larger full width at half maximum with the binding energy shifted lower by 0.3 eV when compared to the other samples. This is likely due to the formation of small quantities of WO2 species. The same tungsten species, oxides and carbides, are also identified on the surface after the catalytic reaction (Fig. S6†).
Along with tungsten, carbon and oxygen are also present on the surface. Ni was not detected for the Ni–WxC/C and Ni–WxC/C-SO3H samples (Fig. S8†) after the carburization. Interestingly, the signal related to Ni 2p level appears after the catalytic reaction (Fig. S7†). The weak the signal can be related to the low Ni loading and/or cellulose deposition on the surface. Ni 2p3/2 peaks of the Ni0, NiS, NiO, Ni(OH)2, NiWO4 and NiSO4 are located at about 852.6, 853.1, 853.7, 856.2, 857.4 and 857.8 eV, respectively.40,41 Although the XPS spectra for Ni 2p level does not allow Ni specie attributions, it is clear by the energy shift (Fig. S7†) that the samples contain different Ni species on the surface after the catalytic reaction. While the catalyst supported on functionalized carbon showed Ni0 (852.7 eV) character, the sample supported on commercial carbon is closer to that of NiWO4 (857.1 eV).
The relative surface concentration was determined considering only the presence of W and C on the surface of the carburized samples. For samples after the catalytic reaction, only C could be quantified because W and Ni surface loadings are lower than the detection limit of the XPS. According to quantitative XPS analysis (Table 1), the relative surface concentration of W and C was almost uniform when compared to the non-promoted samples. However, a significant decrease in the concentration of W on the surface is observed in both of the Ni-promoted tungsten carbides.
| Catalyst | W/C ratio |
|---|---|
| WxC/C | 0.018 |
| WxC/C-SO3H | 0.016 |
| Ni–WxC/C | 0.011 |
| Ni–WxC/C-SO3H | 0.009 |
3.4 TEM
TEM micrographs of the catalysts are shown in Fig. 10 and 11 whereby tungsten carbide particles are seen to be dispersed over the carbon support.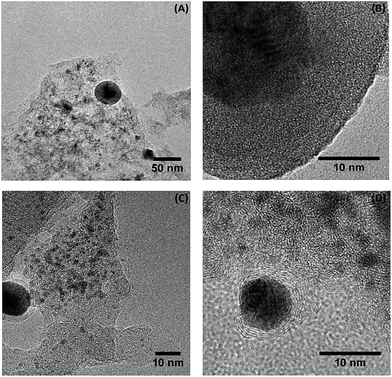 | ||
| Fig. 10 TEM images of the tungsten carbides catalysts supported on sulfonated carbon, (A) and (B) WxC/C-SOH3 and (C) and (D) Ni–WxC/C-SO3H. | ||
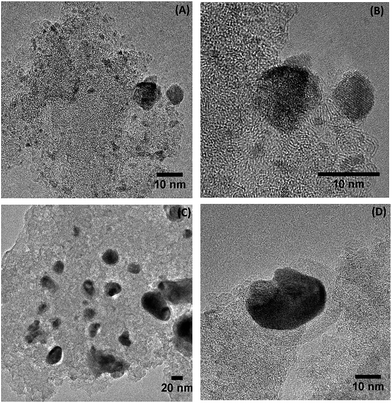 | ||
| Fig. 11 Comparison of non-promoted and promoted tungsten carbides catalysts supported on activated-carbon (A) and (B) WxC/C, (C) and (D) Ni–WxC. | ||
The homogeneity of the dispersion varies depending on the type of support used as well as the presence of the Ni promoter. There are extensive regions with small particles (<20 nm) that are well dispersed as well as other regions containing larger agglomerated particles with a small number of particles in excess of 50 nm. At higher magnification (Fig. 10B) the tungsten carbide particles are composed of truncated crystalline planes in the non-promoted samples. This may be related to the distinct carbide phases forming one particle in accordance with the XRD results (Fig. 1) that showed nanosized mixtures of carbide phases.
At higher magnification (Fig. 10B) the tungsten carbide particles are composed of truncated crystalline planes in the non-promoted samples. This may be related to the distinct carbide phases forming one particle in accordance with the XRD results (Fig. 1) that showed nanosized mixtures of carbide phases.
The magnified TEM image showed in Fig. 10B exhibits in gray-scale a tungsten carbide particle (dark gray) deposited on the surface of the amorphous carbon support (light gray). On the other hand, in Fig. 10D, more clearly in the Fig. 10D and 11D, the tungsten carbide particle (dark gray) is surrounded by a layered-carbon that was produced during the carburization process. This indicates carbon deposition on the surface of the active phase of the Ni-promoted catalyst. These results are in agreement with XPS analysis (Table 1) where a decrease in the W concentration at the surface of the Ni-promoted samples was observed. Overall it appears that during carburization the ideal combination is to have both Ni and SO3H groups present as the groups act in a synergic manner to aid in the formation of small, better dispersed W2C particles.
3.5 Cellulose conversion
The catalysts supported on functionalized carbon achieved higher cellulose conversion compared with the composition-equivalent catalyst supported on activated-carbon (Fig. 12).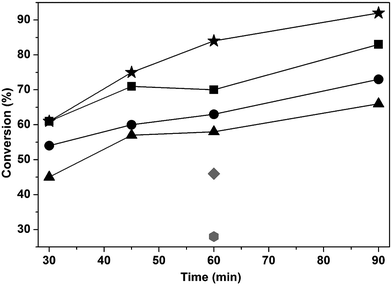 | ||
Fig. 12 Cellulose conversion of the tungsten carbide catalysts and activated-carbon as a function of reaction time:  WxC/C; WxC/C;  WxC/C-SO3H; WxC/C-SO3H;  Ni–WxC/C; Ni–WxC/C;  Ni–WxC/C-SO3H; Ni–WxC/C-SO3H;  C-SO3H and C-SO3H and  C. C. | ||
In blank experiments using sulfonated and pure carbon cellulose conversions of 46% and 28% were attained after 1 h of reaction, respectively. These results were expected due to the increase of acidic sites on the surface of the sulfonated carbon which favors cellulose hydrolyses.35–38
Cellulose conversions between 45 and 61% were found after 0.5 h of reaction and 80–94% after 90 min of reaction with tungsten carbide catalysts at 220 °C at 4.2 MPa of H2. The addition of Ni as a promoter resulted in a decrease in cellulose conversion when compared to the non-promoted catalysts.
The product distributions obtained by acid-catalyzed reactions in a one-pot synthesis under hydrogen pressure are very complex. A large variety of reactions may occur simultaneously such as cellulose hydrolysis to form sugars (mono, di and oligosaccharides); hydrogenation and/or hydrogenolysis of saccharides to sugar alcohols (polyols or polyhydric alcohols), light alcohols, glycols, CO2 formation and degradation products from monosaccharide dehydration (acetic acid, furan, 5-hydroxymethylfurfural, levulinic acid, furan-2-carboxylic acid and acid formic).4–21 However, tungsten-based catalysts are effective in converting cellulose to produce high yields of ethylene glycol (EG).7–21
Despite the well-reported efficiency of sulfonated carbon towards the hydrolysis of cellulose to glucose, this compound was identified in very small concentrations (0.3 to 0.2%). This likely occurred as glucose was transformed into other products by the tungsten active phase.36–38 Indeed, higher glucose yields were attained in the reaction using sulfonated carbon and activated-carbon with yields of 4.0 and 2.5%, respectively. These results suggest that the glucose was readily transformed by subsequent reactions over the tungsten carbide catalyst in the presence of hydrogen.8–21 Moreover, the formation of organic acids was also investigated to verify if glucose was transformed through a dehydration process.8
Fig. 13A shows that small amounts of organic acids were formed in the reactions where the sulfonated support was used, thus leading to higher organic acid yields likely due to the acid properties that favor the dehydration process.8
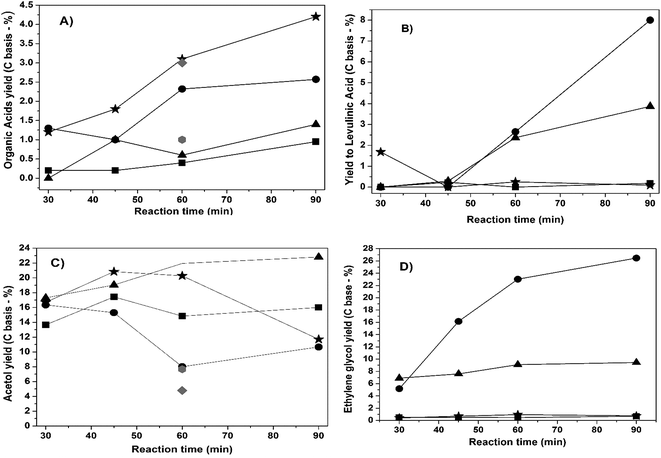 | ||
Fig. 13 Cellulose yield of (A) organic acids (glucuronic, acetic and formic) (B) levulinic acid, (C) acetol (D) and ethylene glycol:  WxC/C; WxC/C;  WxC/C-SO3H; WxC/C-SO3H;  Ni–WxC/C; Ni–WxC/C;  Ni–WxC/C-SO3H; Ni–WxC/C-SO3H;  C-SO3H and C-SO3H and  C. C. | ||
Levulinic acid yield was also investigated (Fig. 13B) and its formation is noticeable in the Ni-promoted samples for reaction times exceeding 60 min and especially for the Ni-promoted catalyst supported on sulfonated carbon after 90 min of reaction. The consensus in the literature is that under acidic conditions glucose isomerizes to form fructose, which is in turn dehydrated to 5-HMF. The 5-HMF can lead to levulinic and formic acid through the hydration of the furan ring.43
A considerable yield of acetol was obtained in the cellulose conversion reaction over tungsten carbide catalysts (Fig. 13C). However, the formation of polyols was not significant (less than 1%), particularly the yield of 1,2-PEG which can be obtained from acetol hydrogenation.11,14
The non-promoted sample supported on sulfonated carbon produced 1% EG while the sample supported on activated-carbon produced only 0.5%. On the other hand, the EG yield from the Ni–WxC/C catalyst was 15% after 1 h of reaction with the catalyst supported on sulfonated carbon exhibiting the highest EG yield of 26%. This result is in agreement with reports from the literature9,11 where a higher EG yield was obtained for the cellulose reaction using the W2C carbide phase combined with a Ni promoter was present compared to catalysts containing the WC phase.
4. Discussion
The carburization process involves two consecutive steps: reduction of tungsten oxides to metallic W and the dissolution of C into the metal lattice.20–30 In the case of the carburization methodology applied here, the first step is based on gas–solid interactions whereby a CH4/H2 gas mixture reacts with the tungsten oxide species deposited on the surface of the carbon. According to studies by Giraudon et al.29 there is a competitive mechanism between H2 and CH4 to reduce oxidic species. Hydrogen is responsible for WO3 reduction to WO2 and CH4 leads the reduction of WO2 to W0 resulting in CO production. The tungsten oxide reduction sequence WO3 → WO2 → W was characterized by in situ XRD analysis of the non-promoted samples (Fig. 1 and S3†). In combination with the structural transformation of the tungsten, the mass spectrometer profiles presented in the Fig. S10 and S11 (ESI†) show that there is a pronounced consumption of CH4 and H2 starting at ca. 450 °C for non-promoted samples (Fig. S10A and S11A†) and at ca. 350 °C for Ni-promoted samples (Fig. S10B and S11B†). This result suggest that Ni was able to decrease the reduction temperature of tungsten oxides species to metallic W and speed up the carburization process. These results are in agreement with the structural evolution of the Ni-promoted samples characterized by in situ XRD analysis (Fig. 2 and S4†) showing that the tungsten oxide reduction and carburization of the metallic tungsten occurs concurrently.Regarding the second step, the carburization can be carried out using different carbon sources: solid carbon (activated carbon support) and gaseous carbon (CH4).27–30
In the first process, namely carbothermal hydrogen reduction (CHR),9–11,27 the solid carbon from the catalyst support interacts with H2 to form CHx or C* species, which diffuse into the metallic tungsten structure to form the carbidic phase. The CHR is normally used with a flow of pure hydrogen as the reducing agent.9–12,28 The carbon is transferred from the microporous activated carbon to the metal structure. This causes a decrease in properties such as surface area, porosity and the average pore size of the catalyst, as reported by Liang et at.28 Moreover, this textural reordering may contribute to particle encapsulation or to the sintering and low dispersion of the tungsten carbides and nickel.9,11
On the other hand, with the gaseous carbon source interaction, which was applied in this work, the formation of CHx species or C atoms originates from the reaction between H2 and the support or by the thermal decomposition of CH4, respectively. In either case, both species are deposited onto the W surface which then diffuse through the surface thus forming the carbide. Besides the textural rearrangements discussed, the carbon gas source is preferred over the solid carbon source due to transport limitations to the reaction boundary.27 However, the drawback of both processes is the deposition of amorphous or graphitic carbon on the surface of the catalyst.20–30
The carburization process of the non-promoted sample is similar to the mechanism proposed by Giraudon et al.29 whereby, following the reduction step the carburization takes place when CH4 dissociates into CHx species and/or C atoms (C*) on the surface of metallic W. The carbon species then diffuse into the W bulk to form the W2C phase. Following this, first the WC1−x![[thin space (1/6-em)]](https://www.rsc.org/images/entities/char_2009.gif) 42,44,45 is formed and finally the WC phase due to the continuous diffusion of carbon into the W2C structure until all the interstitial sites are occupied forming WC. The profile of the mass spectrometer analysis during the carburization showed in Fig. S10 ESI† corroborates with in situ XRD results revealing broad peaks of hydrogen and methane consumption associated with H2O release from ca. 450 °C to 800 °C due to the progressive reduction of the tungsten oxide into metallic tungsten followed by the carburization to form tungsten carbides phases. Moreover, the carbothermal hydrogen reduction proposed by Liang et al.28 cannot be excluded from the carburization process applied here. However, it may be proposed that this reaction is likely taking place to a lesser extent due to the lower temperatures employed in this study, thus preserving the textural properties of the support as showed by the BET surface area and porous volume obtained by N2 physisorption isotherms (Fig. S2†).
42,44,45 is formed and finally the WC phase due to the continuous diffusion of carbon into the W2C structure until all the interstitial sites are occupied forming WC. The profile of the mass spectrometer analysis during the carburization showed in Fig. S10 ESI† corroborates with in situ XRD results revealing broad peaks of hydrogen and methane consumption associated with H2O release from ca. 450 °C to 800 °C due to the progressive reduction of the tungsten oxide into metallic tungsten followed by the carburization to form tungsten carbides phases. Moreover, the carbothermal hydrogen reduction proposed by Liang et al.28 cannot be excluded from the carburization process applied here. However, it may be proposed that this reaction is likely taking place to a lesser extent due to the lower temperatures employed in this study, thus preserving the textural properties of the support as showed by the BET surface area and porous volume obtained by N2 physisorption isotherms (Fig. S2†).
Concerning the role of Ni in the carburization step, the mass spectrometry results (Fig. S10B and S11B†) show that it is threefold: decreasing the reduction temperature to form metallic W, facilitating the CH4 decomposition forming CHx and C* species and improving the support methanation to form CHx species. These effects are related to the ability of Ni to enhance the cleavage of hydrogen to form activated hydrogen creating a spill over effect on the catalyst surface. This form of hydrogen is more reactive than molecular hydrogen resulting in the reduction of the tungsten oxide species (WOx) at lower temperatures.9–12,21,27,28 In addition, the activated hydrogen interacts with the carbon from the support to form CHx and C* species and promotes the carburization of W at lower temperatures. Moreover, it seems that Ni plays a role in the production of pure phase of W2C as shown in the XRD results (Fig. 2, 3 and S4†).
Based on Giraudon et al. findings,29 the conversion of W2C to WC is slower by comparison to the initial formation of W2C from metallic W, which happens almost instantaneously when metallic tungsten is formed on the surface.29 A decrease in the carburization temperature provided by the Ni promoter further slows the phase transition of W2C to WC. On the other hand, nickel enhances the methane decomposition facilitating the polymerisation and deposition of carbon on the surface of the catalyst as shown by TEM images in the Fig. 10 and 11D. In addition, according to quantitative XPS analysis (Table 1), the relative surface concentration of W and C was almost uniform when compared to the non-promoted samples. However, a significant decrease in the concentration of W on the surface is observed in both of the Ni-promoted tungsten carbides suggesting that nickel promotes the deposition of carbon onto the catalyst surface according to XPS (Table 1). These results are in agreement with Giraudon et al.,29 where a competition between the formation of the carbidic phases and carbon polymerisation was observed. Once the surface was covered by a polymerized carbon deposit, the CH4 adsorption and the methanizing agent formation stopped. Consequently, the diffusion of C through the solid bulk no longer occurs as well as the transition from W2C to WC phase. Our results indicate that Ni favours polymeric carbon deposition on the surface, which implies in the W2C phase stabilization due to the inability of C atoms to diffuse from the surface into the W2C bulk to form WC phase. Regarding the catalytic reaction (Fig. 12), the deposited carbon partially inhibits the access of the cellulose to the active sites resulting in lower catalytic activity towards cellulose conversion for Ni-promoted tungsten carbides catalysts.
Another relevant aspect of Ni is the interaction with W to form Ni4W alloy under the carburization conditions, as revealed by XRD (Fig. 3) and XANES results (Fig. 5 and 7). However, according to the in situ XANES results, the spectra of the carburized samples (Fig. 5) are similar but not identical to that of Ni4W alloy, indicating the contribution of another species such as Ni0. Indeed, metallic Ni was detected by XPS analysis after the catalytic reaction (Fig. S7†). It is worth mentioning that the Ni4W alloy was not detected by XRD analysis (Fig. 3), indicating small nanosized Ni species dispersed on the surface of Ni-promoted sample supported on sulfonated carbon that could be detected only by a local order technique (XANES). To reinforce this finding, the integrated area of the XANES spectra (Fig. 6) plotted as a function of temperature reveal that in the Ni promoted sample supported on activated-carbon the valence and symmetry of the promoter gradually changes during the temperature increase up to 730 °C. However, in the case of the Ni promoted sample supported on sulfonated carbon this transformation is more abrupt with Ni reaching its final configuration at a lower temperature, approximately 450 °C. This experimental observation suggests that the interaction between the nickel and sulfonic groups in some way may lead to an increase in activity of the metal which may be due to the high degree of dispersion of Ni over the sulfonated carbon support.
Apart from the improvement of Ni dispersion, the presence of the SO3H groups on the carbon support seems to have no direct influence on the temperature or type of the carbide phase formation and/or stabilization as observed by XRD (Fig. 3) and mass spectrometry (Fig. S10 and S11 ESI†). Whether the carbon support is sulfonated or not, nanosized W2C, WC1−x and WC are formed in the non-promoted samples after 1 h at 800 °C and W2C phase is the only phase formed in the Ni-promoted sample after 1 h at 750 °C.
On the other hand, XPS analysis revealed the presence of both sulfonic groups (SO3H) and thiol species (C-SH) on the surface of the catalysts supported on the functionalized carbon. Both species appear before and after carburization (Fig. 8) in the tungsten supported on commercial and functionalized carbon exposed to carburization conditions as well as for the same samples after the catalytic reaction (Fig. S5†).
The thiol species appear to be formed due to the chemical interaction between sulfonated carbon and the tungsten precursor ((NH4)10W12O41·5H2O) during the impregnation process. However, these species may also be a product of the interaction between the sulfonated carbon, tungsten precursor, 4% (v/v) H2/1% (v/v) CH4 gas mixture and temperature applied during the carburization process. In case of the non-sulfonated carbon the presence of thiol species on the surface is expectedly almost nonexistent.
It must be noted that the mass spectroscopy analysis (ESI Fig. S10†) indicated that during the carburization step, part of the sulfonic groups are removed from the sulfonated-carbon as H2S and SO2 species. However, these species were not detected in the outlet gases of the samples impregnated with the W and/or Ni precursors (ESI Fig. S11†). This point to a strong interaction between the sulfur containing functional groups and the metal precursors, indicating that due to this the sulfur species are able to resist the carburization conditions. Further, this strong interaction contributed to the retention of the acid properties of the catalyst after one catalytic reaction, as shown by the XPS results for the sample characterized after the reaction (Fig. S5†).
In terms of catalytic activity, sulfonated carbon contributed to increased conversion of both non-promoted and promoted tungsten carbides catalysts, even with C-SO3H in the blank reaction. Solid acid catalysts based on carbon functionalized with sulphonic groups has been successfully explored36–38 as an environmentally friendly alternative to liquid-acid catalysts. The SO3H functional group has the ability to adsorb β-1,4-glucan improving the hydrolysis of cellulose in comparison with liquid acid-catalyzed reactions. Moreover, it brings the advantage of catalyst separation, hydrothermal stability and the strong acid sites of the sulfonic functional groups.36,37 Thiol groups also contribute to the overall acidic properties and may also enhance the cellulose hydrolysis but they have not been detected in the solid-acid catalysts or been explored in the related literature.
The structural difference between the non-promoted and promoted catalysts is related to the type of carbidic phase formed as seen by in situ XRD (Fig. 1–3). While non-promoted samples exhibited a mixture of larger, amorphous carbidic phases composed of W2C, WC1−x and WC, the Ni-promoted samples lead to the sole formation of W2C phase. Furthermore, in situ XRD and XANES revealed a better dispersion of Ni particles on sulfonated carbon leading to an improvement in the interaction and dispersion between Ni and W.
The impact of these structural and surface differences are reflected in the catalysts selectivity. Although the non-promoted samples exhibited higher cellulose conversion values, the major product was acetol with EG barely formed (Fig. 13C). On the other hand, on the Ni-promoted tungsten carbide catalysts there was EG formation, especially for the sample supported on sulfonated-carbon, which gave three times more EG yield in 90 min of catalytic reaction than the composition equivalent but supported on activated carbon (Fig. 13D).
Recently, extensive catalytic studies12–15 revealed a mechanism to explain the EG selectivity over Ni-promoted tungsten carbide catalysts for the conversion of cellulose. According to their findings, first cellulose is hydrolyzed to form glucose at the acidic sites on the surface of the WO3 species with H+ released from water. Secondly, glucose is transformed into glycolaldehyde through a retro-aldol reaction catalyzed by tungsten species. Following this the glycolaldehyde is hydrogenated to EG over Ni and W2C active sites of the catalyst.12–14 Our results are in agreement with this multifunctional catalytic mechanism. In addition, the obtained results show that the functionalized carbon with sulfonic groups in combination with the Ni promotion effects has important implications during the carburization process. This implies in a series of structural and surface properties that are relevant for cellulose conversion to EG. The sulfonated carbon and Ni improve the interaction between Ni/W/C obtained through small and better-dispersed particles, a stable W2C carbide phase and metallic Ni. These properties are directly connected to the active sites of this complex multifunctional catalyst and enhances the EG yield.
The correlation of the structural and surface properties of the heterogeneous catalysts with catalytic behaviour are important to elucidate, improve and control the synthesis parameters and chemical composition of the catalysts. However, a thorough insight into structure and dynamics on the molecular level and under realistic reaction conditions is required to understand the full role of the active sites in the catalyst. As it stands, Ni-promoted tungsten carbide catalysts are a complex multifunctional catalytic system that pose many characterisation challenges. Moreover, a one-pot cellulose reaction that is based on gas–liquid–solid–solid interactions under H2 pressure, temperature and stirring is still a technical and instrumental challenge for in operando characterization.45
5. Conclusions
The addition of Ni to ammonium tungstate supported on a sulfonated carbon facilitated the solid-state transformation of tungstate → tungsten carbide as seen by the TPR, XRD and XANES results. Reducing the carburization temperatures resulted in a decrease of Ni and W2C particle sintering. Ni did however act to facilitate the carbon deposition on catalyst surface. The deposited polymeric carbon was partially removed during the catalytic reaction but still had an adverse effect on the catalytic activity. The deposited carbon was found to play a role in the W2C phase stabilization. The presence of Ni and SO3H groups during the carburization directly affected the outcome of the produced catalyst. SO3H groups were shown to stabilize the Ni promoter which then led to a smaller, better dispersed W2C phase and improved the Ni/W2C/C interaction. This contributes in a high selectivity for the production of ethylene glycol.Acknowledgements
The authors are grateful for the financial support from the Brazilian Synchrotron Light Laboratory (LNLS)/Brazilian Center for Research in Energy and Materials (CNPEM). We would like to thank LNLS, CTBE and LNNano staff and facilities.References
- A. J. Ragauskas, C. K. Williams, B. H. Davison, G. Britovsek, J. Cairney, C. A. Eckert, J. W. Frederick Jr, J. P. Hallett, D. J. Leak, C. L. Liotta, J. R. Mielenz, R. Murphy, R. Templer and T. Tschaplinski, Science, 2006, 311, 484–489 CrossRef CAS PubMed
.
- F. Cherubini and A. H. Stromman, Biofuels, Bioprod. Biorefin., 2011, 5, 548–561 CrossRef CAS
.
- M. Stöcker, Angew. Chem., Int. Ed., 2008, 47, 9200–9211 CrossRef PubMed
.
- R. Rinaldi and F. Schüth, ChemSusChem, 2009, 3, 1096–1107 CrossRef PubMed
.
- S. Van der Vyver, J. Geboers, P. A. Jacobs and B. F. Sels, ChemCatChem, 2011, 3, 82–94 CrossRef
.
- Y. Ogaki, Y. Shinozuka, T. Hara, N. Ichikuni and S. Shimazu, Catal. Today, 2011, 164, 415–418 CrossRef CAS
.
- C. H. Zhou, X. Xia, C. X. Lin, D. S. Tong and J. Beltramini, Chem. Soc. Rev., 2011, 40, 5588–5617 RSC
.
- A. M. Ruppet, K. Weinberg and R. Palkovits, Angew. Chem., Int. Ed., 2012, 41, 2564–26501 CrossRef PubMed
.
- N. Ji, T. Zhang, M. Zheng, A. Wang, H. Wang, X. Wang and J. G. Chen, Angew. Chem., Int. Ed., 2008, 47, 8510 CrossRef CAS PubMed
.
- N. Ji, T. Zhang, M. Zheng, A. Wang, H. Wang, X. Wang, Y. Shu, A. L. Stottlemeyer and J. G. Chen, Catal. Today, 2009, 147, 77 CrossRef CAS
.
- Y. Zhang, A. Wang and T. Zhang, Chem. Commun., 2010, 46, 862–864 RSC
.
- L. Zhou, A. Wang, C. Li, M. Zheng and T. Zhang, ChemSusChem, 2012, 5, 932–938 CrossRef CAS PubMed
.
- A. Wang and T. Zhang, Acc. Chem. Res., 2012, 46(7), 1377–1386 CrossRef PubMed
.
- R. Ooms, M. Dusselier, J. A. Geboers, O. B. de Beek, R. Verhaeven, E. Gobechiya, J. A. Martens, A. Redl and B. F. Sels, Green Chem., 2014, 16, 695–707 RSC
.
- H. Yue, Y. Zhao, X. Ma and J. Gong, Chem. Soc. Rev., 2012, 41, 4218–4244 RSC
.
- Y. G. Sun, Y. Ma, Z. Wang and J. Yao, Bioresour. Technol., 2014, 158, 307–312 CrossRef CAS PubMed
.
- Y. Liu, C. Luo and H. Liu, Angew. Chem., Int. Ed., 2012, 51, 3249–3253 CrossRef CAS PubMed
.
- Y. Cao, J. Wang, M. Kang and Y. Zhu, J. Mol. Catal. A: Chem., 2014, 381, 46–53 CrossRef CAS
.
- K. Fabicovicová, O. Malter, M. Lucas and P. Claus, Green Chem., 2014, 16, 3580–3588 RSC
.
-
(a) I. G. Baek, S. J. You and E. D. Park, Bioresour. Technol., 2012, 114, 684–690 CrossRef CAS PubMed
; (b) M.-Y. Zheng, A.-Q. Wang, N. Ji, J.-F. Pang, X.-D. Wang and T. Zhang, ChemSusChem, 2010, 3(1), 63–66 CrossRef CAS PubMed
.
- T. Xiao, A. Hanif, A. P. E. York, J. Sloan and M. L. H. Green, Phys. Chem. Chem. Phys., 2002, 4, 3522 RSC
.
- F. H. Ribeiro, R. A. D. Betta, G. J. Guskey and M. Boudart, Chem. Mater., 1991, 3, 805 CrossRef CAS
.
- F. H. Ribeiro, R. A. D. Betta, M. Boudart and E. Iglesia, J. Catal., 1991, 130, 498–513 CrossRef CAS
.
- F. H. Ribeiro, R. A. D. Betta, M. Boudart, J. Baumgartner and E. Iglesia, J. Catal., 1991, 130, 86–105 CrossRef CAS
.
- G. Leclerq, J. M. Giraundon, P. Devassine, L. Feigenbaum, L. Leclercq, A. Frennet, J. M. Bastin, A. Löfberg, S. Decker and M. Dufour, J. Catal., 1996, 158, 142–169 CrossRef
.
- S. T. Oyama, Ph D Dissertation, Stanford University, 1981
.
- C. Liang, F. Tian, Z. Feng, Z. Li, Z. Wei and C. Li, Chem. Mater., 2003, 15, 4846–4853 CrossRef CAS
.
- J. M. Giraudon, P. Devassine, J. F. Lamonier, L. Delannoy, L. Leclerq and G. Leclercq, J. Solid State Chem., 2000, 154, 412–426 CrossRef CAS
.
- A. Löfberg, A. Frennet, G. Leclerq, L. Leclerq and J. M. Giraudon, J. Catal., 2000, 189, 170–183 CrossRef
.
- R. Cury, J.-M. Joubert, S. Tusseau-Nenez, E. Leroy and A. Allavena-Valette, Intermetallics, 2009, 17, 174–178 CrossRef CAS
.
- R. F. Souza, L. C. Somon and M. C. M. Alves, J. Catal., 2003, 214, 165–168 CrossRef
.
- J. F. Moulder, W. F. Stickle, P. E. Sobol and K. D. Bomben, Handbook of X-ray Photoelectron Spectroscopy, Pelkin-Elmer Corporation, 1992 Search PubMed
.
- E. I. Basaldella, S. Legnoverde, I. J. Morales, E. R. Catellón, B. O. D. Costa and C. A. Querini, Adsorption, 2011, 17, 631–641 CrossRef CAS
.
- M. Okamura, A. Takagaki, M. Toda, J. N. Kondo, K. Domen, T. Tatsumi, M. Hara and S. Hayashi, Chem. Mater., 2006, 18, 3039–3045 CrossRef CAS
.
- S. Suganuma, K. Nakajima, M. Kitano, D. Yamaguchi, H. Kato, S. Hayashi and M. Hara, J. Am. Chem. Soc., 2008, 130, 12787–12793 CrossRef CAS PubMed
.
- A. Onda, T. Ochi and K. Yanagisawa, Top. Catal., 2009, 52, 801–807 CrossRef CAS
.
- Y. Zhang, A. Wang and T. Zhang, Chem. Commun., 2010, 46, 862–864 RSC
.
- X. L. Yang, R. Gao, W. L. Dai and K. Fan, J. Phys. Chem. C, 2008, 112, 3819–3826 CAS
.
- H. W. Nesbitt, D. Legrand and G. M. Bancroft, Phys. Chem. Miner., 2000, 2, 357–366 CrossRef
.
- R. Juškėnas, I. Valsiūnas, P. Lives, A. Selskis, V. Jasulaitienė, V. Karpavičienė and V. Kapočius, Appl. Surf. Sci., 2006, 253, 1435–1442 CrossRef
.
- A. Warren, A. Nylund and I. Olefjord, Int. J. Refract. Met. Hard Mater., 1996, 14, 345–353 CrossRef CAS
.
- A. Corma, S. Iborra and A. Velty, Chem. Rev., 2007, 107(6), 2411–2502 CrossRef CAS PubMed
.
- A. S. Kurlov and A. I. Gusev, Inorg. Mater., 2006, 42, 121–127 CrossRef CAS
.
- A. S. Kurlov and A. I. Gusev, Phys. Rev. B: Condens. Matter Mater. Phys., 2007, 76, 174115 CrossRef
.
- I. L. C. Buurmans and B. M. Weckhuysen, Nat. Chem., 2012, 4, 873–886 CrossRef CAS PubMed
.
Footnote |
| † Electronic supplementary information (ESI) available: Additional characterization for the samples by N2 adsorption/desorption, in situ XRD, mass spectroscopy and XPS. See DOI: 10.1039/c5ra03252k |
| This journal is © The Royal Society of Chemistry 2015 |

