Monolayer of close-packed Pt nanocrystals on a reduced graphene oxide (RGO) nanosheet and its enhanced catalytic performance towards methanol electrooxidation

Lin-Nan Zhoua, Xiao-Ting Zhanga, Wen-Jin Shena, Shi-Gang Sun*b and Yong-Jun Li*a
aState Key Lab of Chemo/Biosensing and Chemometrics, School of Chemistry and Chemical Engineering, Hunan University, Changsha 410082, China. E-mail: liyje@hnu.edu.cn
bState Key Lab for Physical Chemistry of Solid Surfaces, Department of Chemistry, Xiamen University, Xiamen 361005, China. E-mail: sgsun@xmu.edu.cn

Received 16th February 2015 , Accepted 15th May 2015

First published on 15th May 2015


Abstract

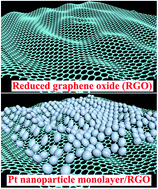
Owing to the high hydrophobicity of the graphene surface and the easy aggregation of Pt nanoparticles, it is very challenging to deposit high loading and a uniform distribution of Pt nanoparticles on graphene nanosheets. Herein, we report a facile approach to produce nanocomposites of Pt nanoparticles and reduced graphene oxide (Pt/RGO) with the intervention of glucose. The number density and arrangement of Pt nanoparticles on RGO nanosheets can be adjusted simply by changing the amount of Pt precursors. With the increase of the amount of Pt precursors, the loading amount of Pt nanoparticles rises and simultaneous Pt nanoparticle arrangement evolves from sparse distribution to a close-packed monolayer, to linear aggregation. HRTEM reveals that Pt nanoparticles are (111)-orientated nanocrystals (NCs) close to 3 nm. Pt24/RGO (Pt, 24 wt%) holds an excellent catalytic performance and stability towards methanol oxidation, ∼3 times in the mass activity better than the commercial Pt/C catalyst (Pt, 20 wt%), due to the close-packed monolayer structure of Pt NCs.

Introduction

Graphene has been considered to be an effective substrate for enhancing the electrocatalytic performance of Pt catalysts because of its electron-donating property.1,2 Thus, Pt/graphene nanocomposite catalysts are widely exploited. Nevertheless, a graphene nanosheet powder either derived from chemical vapor deposition or chemical reduction of graphene oxide is hydrophobic and detrimental to the dispersion and immobilization of Pt nanoparticles3 although hydrophobic pristine graphene has been used to successfully load Pt nanoparticles by defect-mediated immobilization.4

To fabricate Pt nanoparticles with a uniform distribution, graphene nanosheets are usually functionalized by organic linkers, such as polydopamine,5 aminopyrene,6 phosphomoly-bdic acid,7 poly(sodium styrene sulfonate),8 poly(diallyldi-methylammonium chloride),9 p-aminothiophenol-b-cyclodex-trin polymer,10 8-hydroxy-1,3,6-pyrene trisulfonic acid trisodium salt (PyS),11 5,10,15,20-tetrakis(1-methyl-4-pyridinio) porphy-rin tetra(p-toluenesulfonate),12 nickel(II) phthalocy-anine-tetrasulfonic acid tetrasodium salt,13 and ionic liquids.14 In most occasions, the functionalization of graphene surface can effectively avoid the aggregation of Pt nanoparticles, but Pt nanoparticles are sparsely decorated on graphene surface. Few strategies involving functionalized graphene can produce Pt/graphene composites with high-loading Pt nanoparticles9,14b Additionally, although the intervention of organic linkers is very helpful for fabricating uniformly distributed Pt nanoparticles on graphene surface, it also deteriorates the physical properties of graphene due to the disruption of its conjugated structure and decreases the effective contact area between Pt nanoparticles and graphene.9,11 Thus, a post-thermal treatment is sometimes required to remove organic linkers so as to increase the electric conductivity of Pt/graphene composite and expose more active sites of Pt nanoparticles for practical applications,15 which accordingly has a risk of causing the aggregation of Pt nanoparticles.

Thus, organic linker-free methods should be infinitely preferable to producing Pt/graphene composites. The direct growth of Pt nanoparticles on graphene surface can maximize the contact area between graphene and nanoparticles, improving the catalytic activity of Pt/graphene. To meet the hydrophobicity of graphene, supercritical carbon dioxide has been employed as a favorable solvent to successfully prepare Pt/graphene composites by using either dimethyl (1,5-cyclooctadiene) platinum(II) (PtMe2COD) or platinum(II) acetylacetonate (Pt(acac)2) as platinum precursors,16 but the size and distribution of Pt nanoparticles depend on the type of Pt precursor. In spite of the hydrophobicity of graphene powder, reduced graphene oxide (RGO) prepared by chemical methods still has a certain dispersivity in aqueous solution and can be used to prepare Pt/RGO composites as long as it does not undergo a drying process. The typical approach is to reduce Pt precursors in RGO dispersion with NaBH4 under alkaline conditions, but it cannot produce uniformly distributed Pt nanoparticles on RGO surface: Pt nanoparticle aggregates17 and network structures18 are usually observed. Anchoring of Pt nanoparticles on RGO surface is attributed to residue oxygen-containing organic groups of RGO surface.19 Electrochemical deposition can uniformly plant Pt nanoparticles on one side of graphene surface,20 but the loading of Pt nanoparticles is extremely low in order to avoid aggregation. To raise the loading amount, it is imperative to eliminate the aggregation of Pt nanoparticles.21 To address this issue, highly wavy graphene with abundant ripples was used, which not only increases the dispersivity of graphene in aqueous solution, also raises the loading amount of Pt nanoparticles,22 but the size and distribution of Pt nanoparticles on RGO lack the uniformity. To the best of our knowledge, two outstanding studies have fabricated high-loading Pt nanoparticles without severe aggregation on graphene surface by the supercritical carbon dioxide-assisted16b and femto-second-laser-pulse deposition.21 Despite all that, the high loading and uniform distribution of Pt nanoparticles on graphene surface are not easily fabricated due to the easy aggregation of Pt nanoparticles and the hydrophobicity of graphene.

Here, ∼3 nm Pt nanocrystals (NCs) were directly planted on the surface of purified RGO involving glucose as the stabilizer and NaBH4 as the reductant. The participation of glucose not only manipulates the growth of Pt along (111)-orientated direction, but also increases the stability of RGO in aqueous solution. The loading amount and distribution of Pt NCs can be controlled simply by changing the amount of Pt precursors. Pt24/RGO (Pt, 24 wt%) with close-packed Pt NCs exhibits the best electrocatalytic activity and stability towards methanol oxidation among all as-prepared Pt/RGO composites, approximately 3 times in the mass activity better than the commercial Pt/C catalyst (Pt, 20 wt%).

Experimental

Chemicals

Graphite powder (C, 99.8%), potassium permanganate (KMnO4, 99.5%), sulphuric acid (H2SO4, 98%), sodium nitrate (NaNO3, 99.5%), hydrogen peroxide (H2O2, 30%), glucose anhydrous (C6H12O6, 99.5%), hexachloroplatinic acid hexahydrate (H2PtCl6·6H2O, 37%), sodium borohydride (NaBH4, 96%) and sodium hydroxide (NaOH, 96%) were supplied by Sinopharm Chemical Reagent Co. Ltd (China); hydrazine hydrate (N2H4, 80%) was obtained from Shanghai Shanpu Huagong Co. Ltd. (China). Ammonia solution (NH3·H2O, 25%) was purchased from Hengyang Chemical Reagent Co. Ltd (China); commercial Pt/C (Pt, 20 wt%) catalyst was obtained from Johnson Matthey Company. All chemicals were of analytical grade and used as received. All solutions were prepared with Milli-Q water.

Synthesis of reduced graphene oxide (RGO) dispersion

Graphite oxide was synthesized according to Hummer's method22 with little modification. Typically, 2.0 g of graphite powder and 1.0 g of NaNO3 were added into 46 mL of concentrated H2SO4 under stirring in an ice bath. Subsequently, 6.0 g of KMnO4 was dissolved into the above solution and the mixture was stirred at 20 °C for 5 h, and then heated to 35 °C under vigorous stirring, holding for 30 min until the purple color disappeared. To the mixture was slowly added 46 mL of concentrated H2SO4 and 6.0 g of KMnO4, and the resulting mixture was continually stirred for 24 h at 35 °C and cooled to room temperature, 300 mL of ice water and 6 mL of H2O2 were added and the mixture immediately turned into a bright yellow accompanied by the emergence of air bubbles. Incomplete oxidized graphite floated on the solution surface was removed. To the mixture was added 10% HCl solution to dissolve the sediments containing Mn species, such as MnO2. Thus, graphite oxide dispersion with a yellow-brown color was obtained. The dispersion was successively subjected to sonication and centrifugation several times until graphite oxide was completely exfoliated into graphene oxide (GO) sheets. Purified GO dispersion was further diluted to ∼1.5 mg mL−1 with Milli-Q water.

RGO dispersion was directly obtained by adding hydrazine hydrate in GO aqueous dispersion.23 Typically, 80.0 mL of water, 25.2 μL of hydrazine aqueous solution and 628.0 μL of ammonia solution were added into 20.0 mL of as-prepared GO dispersion under vigorous stirring. Subsequently, the mixture was heated to 85 °C, holding for 45 min to produce RGO. Impurities in as-prepared RGO dispersion were removed by centrifugation. The purified RGO precipitate was further redispersed into water to produce RGO dispersion (1.0 mg mL−1) for the following utilization.

Growth of Pt nanocrystals on the surface of RGO nanosheet (Pt/RGO)

Typically, 27 mL of RGO dispersion was added into 50 mL of 0.18 mol L−1 glucose aqueous solution under sonication, to which was added 3.0 mL of 0.02 mol L−1 H2PtCl6 solution. The pH of the mixture was adjusted to 9 by dropwise addition of a certain amount of 0.1 mol L−1 NaOH solution. Subsequently, 3.0 mL of 0.1 mol L−1 fresh ice-cold NaBH4 solution was added under vigorous stirring. After 30 min, Pt nanocrystals were formed on RGO surface. As-prepared Pt/RGO was purified by centrifugation with water several times and dried in the air. Pt content in the Pt/RGO composite was determined to be 24 wt% by an inductively coupled plasma-optical emission spectroscopy (ICP-OES), which is designated as Pt24/RGO. The dry sample was redispersed into 5 mL of water for electrocatalysis and the concentration is 2.342 mg mL−1.

Fabrication of catalytic electrode

Glassy carbon (GC) disk (diameter, 5 mm) was used as an electrode substrate, which, prior to use, was polished successively with 1.0 μm-, 0.3 μm- and 0.05 μm-alumina slurry, and ultrasonically rinsed twice with water and ethanol. 10 μL of Pt24/RGO dispersion was applied over the GC disk. For comparison, 2.81 mg of commercial Pt/C catalyst was dispersed into 1.0 mL ethanol, 10 μL of which was applied over a GC disk. After drying in the air at room temperature, 5 μL of Nafion alcohol solution (0.05 wt%) was applied over each electrode surface for solidification.

The procedure of electrochemical experiments

All electrochemical experiments were conducted on a conventional three-electrode configuration at room temperature. A saturated calomel electrode (SCE) and a platinum wire were used as the reference electrode and the counter electrode, respectively. All potentials mentioned below refer to SCE unless otherwise specified. Pt/RGO or Pt/C supported on GC substrate served as a working electrode and was further cleaned by cycling between −0.2 and 1.0 V at 50 mV s−1 in 0.5 mol L−1 H2SO4 solution until the pattern of the cycle voltammogram did not change. Measurements of methanol electrooxidation were carried out in 50 mL of 0.5 mol L−1 H2SO4 solution containing 1.0 mol L−1 CH3OH at 50 mV s−1 between 0 and 1.0 V. Before each measurement, N2 was bubbled through the electrolyte for 15 min to eliminate dissolved O2.

Instruments and characterization

All electrochemical experiments were performed on a CHI 660D workstation (Chenhua, Shanghai). Transmission electron microscopy (TEM) and high-resolution transmission electron microscopy (HRTEM) images were obtained on a JEM-3010 microscope (JEOL, Japan) with an Oxford INCA detector operating at 300 kV. The compositions of as-prepared catalyst were determined through an inductively coupled plasma-optical emission spectroscopy (ICP-OES) (Optimal 5300DV spectrometer, PerkinElmer Inc.). X-ray photoelectron spectroscopy (XPS) was conducted on a K-Alpha 1063 X-ray photoelectron spectrometer (Thermo Fisher Scientific) with Al Kα X-rays as the excitation source. X-ray diffraction (XRD) measurement was performed on a θ–2θ X-ray diffraction Siemens D5000 apparatus.

Results and discussion

As-prepared RGO nanosheet has many rumples (Fig. 1A), consistent with the previous report.24 After the loading of Pt nanoparticles on RGO, Pt24/RGO has a darker color than pure RGO, indicating that numerous Pt nanoparticles cover the RGO surface (Fig. 1B). To examine the distribution of Pt nanoparticles, three representative sites in Fig. 1B were chosen to be magnified. Rectangle a marked in Fig. 1B is shown in Fig. 1C: Pt nanoparticles have a high number density on either dark or grey area, exhibiting a monolayer structure. Although the color of the spot marked with a rectangle in Fig. 1C is light grey compared with other parts, Pt nanoparticles are still closely packed (Fig. 1D). On close inspection (the inset in Fig. 1D), most of Pt nanoparticles are not isolated but interconnected, having a linear structure composed of 3–5 nanoparticles, of which linear dimers and trimers take a large proportion. Rectangle b marked in Fig. 1B has the deepest dark color, where Pt nanoparticles are arranged extremely closely, as shown in Fig. 1E. Despite that, individual nanoparticles are still distinguishable. Thus, dark strips in Fig. 1B come from the initial rumples of RGO rather than from 3D aggregation of Pt nanoparticles. The overlapping and the high number density of Pt nanoparticles located on RGO rumples should be attributed to the trapping of rumples. We also examined the edge of graphene marked with rectangle c in Fig. 1B, which had a light grey color. TEM image (Fig. 1F) shows that Pt nanoparticles are relatively sparse, but some dimers and trimers are still visible.
image file: c5ra03007b-f1.tif
Fig. 1 TEM images of pure RGO nanosheet (A) and Pt24/RGO (B–F). (C), (E) and (F) were the magnified TEM images of rectangle a, b and c marked in (B), respectively. (D) TEM image of the rectangle marked in (C) with a magnified inset. The inset in (F) is the particle size distribution.

By analyzing 300 Pt nanoparticles, the diameter is 2.84 ± 0.03 nm (Inset in Fig. 1F), similar to that of Pt nanoparticles electrodeposited on monolithic porous graphene network,15 which is very suitable to be used as catalyst, but the number density of Pt nanoparticles in our case is much higher. Although similar wavy RGO has been used in the previous report,24 Pt nanoparticles are sparsely decorated on RGO surface and the particle size lacks uniformity, completely different from our results. Such uniform Pt nanoparticles in our study may be attributed to glucose, of which five hydroxyl groups are able to bind Pt nanoparticle surface by the interaction of Pt atom and O atom.25 Moreover, glucose may have a weak non-covalent interaction with RGO due to the existence of C[double bond, length as m-dash]O, assisting the formation of dense and uniform Pt nanoparticles because RGO dispersion can remain stable for several weeks without aggregation if glucose is added, which may be the key point for the construction of the closely-packed Pt nanoparticle monolayer. Of course, the number density of Pt nanoparticles also depends on the amount of Pt precursors, which will be involved later.

HRTEM image (Fig. 2A) shows that each Pt nanoparticle has parallel lattice fringes with a spacing of ∼0.226 nm between two neighboring fringes, indicating that the resulting Pt nanoparticles are nanocrystals (NCs) with abundant (111) facets26 (JCPDF 04-0802), which is attributed to the directing role of glucose additive.25 We also examined the linear aggregates, as shown in Fig. 2B. Lattice fringes extend from one nanocrystal to another, indicating that the linear aggregates are formed by the orientation attachment of Pt NCs rather than the random aggregation. XRD analysis (Fig. 2C) further indicates that Pt NC has a face-centered cubic (fcc) crystal structure with characteristic refraction peaks of Pt(111), (200), (220) and (311) crystalline planes (JCPDF 04-0802).27 The refraction peak of at ∼40° has the strongest intensity, dwarfing other peaks, which is indicative of abundant Pt(111) facets, in accord with the result of HRTEM (Fig. 2A). Apart from the diffraction peaks of Pt facets, there is another diffraction peak at ∼26.35°, which is ascribed to graphite (002) peak of graphene sheets.28


image file: c5ra03007b-f2.tif
Fig. 2 HRTEM images (A and B) and XRD pattern (C) of Pt24/RGO nanocomposite.

The distribution of Pt NCs on RGO nanosheet has a clear picture: individual RGO nanosheets are covered by close-packed Pt NCs except for the edges of graphene sheets, implying that surface rumples exactly play an important role in accumulating Pt NCs. However, Pt NCs cannot be arranged closely only dependent on RGO rumples.24 In our case, as-prepared Pt NCs not only have a high number density, also show a uniform size-distribution. Such closely-packed Pt NCs on RGO surface are rarely reported,14b which may be attributed to the combination of physical trapping of rumples, chemical bonding of residue oxygen groups of RGO surface and the non-covalent interaction of glucose with RGO.

The existence of residue oxygen groups was demonstrated by C1s and O1s XPS. Asymmetrical C1s binding energy bands were observed in pure RGO (Fig. 3A) and Pt24/RGO (Fig. 3B) and further deconvoluted into four components, respectively: C[double bond, length as m-dash]C, C–O–, C[double bond, length as m-dash]O and C[double bond, length as m-dash]OO–, as shown in Fig. 3A and B. As for pure RGO, the corresponding binding energies and the relative atomic amounts are shown in Table S1, almost consistent with previous reports.24,29 It means that RGO still contains a few oxygen-containing functional groups. Although residual oxygen influences the electrical conductivity of RGO, traces of oxygen in RGO are helpful for the loading of Pt nanoparticles and improving their stability and distribution on RGO surface.30 Moreover, oxygen atoms also increase the hydrophilicity of graphene, making its dispersion more stable. When Pt NCs are loaded on RGO surface, the atomic percentage of C[double bond, length as m-dash]C groups increases by comparison with pure graphene (Table S1), which may be ascribed to the repair of the basal plane structure of graphene, implying that the initial C–C groups containing oxygen are partially transformed into C[double bond, length as m-dash]C groups during the reduction process of Pt precursors. Accordingly, the atomic percentages of C1s of C[double bond, length as m-dash]O and C[double bond, length as m-dash]OO– components in Pt24/RGO also decrease (Table S1), which is attributed to the transformation of C[double bond, length as m-dash]O and C[double bond, length as m-dash]OO– components to C[double bond, length as m-dash]C component and the formation of Pt–O linkages.29 Also, compared with pure RGO, C–O– component has a higher atomic percentage in Pt24/RGO, which may be related to the conversion of C[double bond, length as m-dash]O to C–O– and the participation of C–O– in C[double bond, length as m-dash]OOH coming from glucose. This analysis is further confirmed by O1s XPS spectra, as shown in Fig. 3C and D. After deconvolution, O1s XPS spectra of pure RGO (Fig. 3C) and Pt24/RGO (Fig. 3D) contain three oxygen components, respectively: carbonyl oxygen from C[double bond, length as m-dash]O*O– and C[double bond, length as m-dash]O*, hydroxyl oxygen from C–O*– and C[double bond, length as m-dash]OO*–, and oxygen from tiny absorbed H2O (Fig. 3C and D, the corresponding oxygen is marked with the symbol, *). The binding energy and the relative atomic amount of each component are shown in Table S2. Compared with the spectrum of pure RGO, the atomic percentages of oxygen atoms coming from C[double bond, length as m-dash]O*O– and C[double bond, length as m-dash]O* components decrease in Pt24/RGO, in tandem with the increase of the atomic percentages of hydroxyl oxygen atoms in C–O*– and C[double bond, length as m-dash]OO*– components, which agrees with the results of C1s XPS analysis. Also, the tiny amount of oxygen coming from adsorbed H2O was detected in both Pt/RGO and pure RGO. Additionally, compared with pure RGO, in the XPS pattern of Pt/RGO, the deconvoluted band centers of C1s spectra, apart from C[double bond, length as m-dash]C component, tend to shift positively while the deconvoluted band centers of O1s spectra, apart from adsorbed H2O, tend to shift negatively, disclosing the difference of the chemical surroundings around C and O atoms. The existence of Pt–O linkage may be related to C–O*– and C[double bond, length as m-dash]OO*– groups, which is capable of providing heterogeneous nucleation sites for the growth of Pt NCs,30b but not enough for producing uniformly distributed Pt NCs on RGO surface according to the previous reports.17,24 Thus, the introduction of glucose plays a crucial role in the formation of uniform Pt NCs and their close-packed monolayer.


image file: c5ra03007b-f3.tif
Fig. 3 C1s (A) and O1s (C) XPS spectra of pure RGO; C1s (B), O1s (D) and Pt4f (E) XPS spectra of Pt24/RGO. Black curves are the original patterns; red curves are the simulated patterns by the curves of the deconveluted components marked in each figure.

Pt4f XPS spectrum of the Pt/RGO (Fig. 3E) is not symmetrical, implying that some Pt species exist as non-metallic Pt. Pt4f spectrum possesses a pair of peaks. After the deconvolution of Pt4f spectrum, Pt NCs were found to contain Pt(II) and Pt(IV) species. The binding energies centered at 71.61 and 74.81 eV (blue curves) correspond to metallic Pt; the binding energies centered at 72.84 and 75.84 eV (green curves) are attributed to Pt(II) species, such as PtO and Pt(OH)2;31 the broad double peaks at 76.33 and 79.28 eV (purple curves) are assigned to Pt(IV) species, such as PtO2.31 The appearance of Pt(II) and Pt(IV) is caused by the formation of Pt–O linkages, in agreement with the analysis of C1s and O1s XPS spectra. The atomic ratio of Pt(0)[thin space (1/6-em)]:[thin space (1/6-em)]Pt(II)[thin space (1/6-em)]:[thin space (1/6-em)]Pt(IV) is about 2.2[thin space (1/6-em)]:[thin space (1/6-em)]1.7[thin space (1/6-em)]:[thin space (1/6-em)]1 (Table S3), indicating that almost half of Pt atoms exist as non-metallic Pt, similar to the case of Pt nanoparticles supported on CeO2/graphene.32 Actually, non-metallic Pt also exists in ‘pure’ Pt nanoparticles and the commercial Pt/C. If RGO was not added in the synthesis of Pt24/RGO, as described in Experimental section, ‘pure’ Pt nanoparticles were obtained. XPS analysis (Fig. S1A) indicates that the atomic ratio of Pt(0)[thin space (1/6-em)]:[thin space (1/6-em)]Pt(II)[thin space (1/6-em)]:[thin space (1/6-em)]Pt(IV) in Pt nanoparticles is 11.8[thin space (1/6-em)]:[thin space (1/6-em)]1[thin space (1/6-em)]:[thin space (1/6-em)]1 (Table S3) and Pt(II/IV) species account for 14.5%. XPS analysis (Fig. S1B) also indicates that Pt(II/IV) species in Pt/C account for 32.9% with the Pt(0)[thin space (1/6-em)]:[thin space (1/6-em)]Pt(II)[thin space (1/6-em)]:[thin space (1/6-em)]Pt(IV) ratio of 4.9[thin space (1/6-em)]:[thin space (1/6-em)]1.4[thin space (1/6-em)]:[thin space (1/6-em)]1. Although non-metallic Pt exists in Pt nanoparticles and Pt/C, the atomic percentage is lower than that of Pt24/RGO, suggesting that the introduction of RGO is responsible for the appearance of partial non-metallic Pt. The decoration of non-crystalline oxygen-contained species (PtO2, PtO or Pt(OH)2) on Pt(0) surface may provide –OH group for promoting the oxidation of organic molecules and produce a certain favorable capability against the corrosion of Pt catalyst during the catalysis process.33

Arrangement of Pt nanoparticles on RGO surface also depends on their number density. To explore the effect of the number density of Pt nanoparticles on the final structure of Pt/RGO, another four samples were synthesized by changing the amount of Pt precursors (the detail of synthesis in ESI and Table S4). Pt contents in Pt/RGO composites were found to increase with the increase of the molar amount of Pt precursors. Four Pt/RGO samples were determined to contain 17 wt%, 19 wt%, 39 wt% and 52 wt% Pt, respectively, by ICP-OES. The corresponding samples were designated as Pt17/RGO, Pt19/RGO, Pt39/RGO and Pt52/RGO, respectively. TEM characterizations (Fig. S2–S5) indicate that the number density of Pt nanoparticles on RGO surface gradually increases with the increase of Pt contents. From Pt17/RGO to Pt53/RGO, the arrangement of Pt nanoparticles changes from sparse distribution to close-packed monolayer, to linear aggregation. Pt nanoparticles in Pt17/RGO and Pt19/RGO are sparsely distributed except for the rumple location of RGO (Fig. S2 and S3). Pt nanoparticles in Pt24/RGO are close-packed (Fig. 1C and D). When Pt content is beyond 24 wt%, Pt nanoparticles in Pt/RGO (namely Pt39/RGO and Pt52/RGO) densely cover RGO surface (Fig. S4 and S5) and form 2D linear aggregates. Thus, the arrangement of Pt nanoparticles on RGO surface depends not only on the specific synthetic procedure, but also on the amount of Pt precursors. Pt nanoparticles in each sample are (111)-oriented nanocrystals, having the same crystalline structure as those in Pt24/RGO (Fig. 2A). The average size of Pt nanoparticles does not show an obvious change compared with that of Pt24/RGO: the average diameters of Pt NCs in different Pt/RGO nanocomposites fluctuates from 2.6 to 2.9 nm (insets in Fig. S2–S5).

All Pt/RGO nanocomposites show the same distinguishing characteristics as the commercial Pt/C catalyst in the cyclic voltammetric measurement (Fig. S6): a pair of adsorption–desorption peaks of hydrogen ranging from −0.2 to 0.05 V, a broad oxidation peak of Pt between 0.5 and 0.9 V, and the reduction peak of platinum oxide at ∼0.50 V. The adsorption–desorption peaks of hydrogen are well known to be closely linked with the electrochemical active surface area (ECSA) of Pt catalyst, which can be calculated by integrating the charge of the hydrogen absorption–desorption peaks.34 ECSAs of all Pt/RGO composites were summarized in Table S4. Pt39/RGO has the largest ECSA (36.7 m2 g−1), about 2 times larger than that of the commercial Pt/C. With the increase of Pt contents, the ECSA increases from Pt17/RGO to Pt39/RGO. On the contrary, when the mass of Pt reaches up to 52% (i.e. Pt52/RGO), the ECSA decreases due to the severe overlapping of Pt nanoparticles, but all ECSAs of Pt/RGO composites are larger than that of Pt/C, implying that Pt/RGO is able to provide more active sites than Pt/C for chemical reactions occurring on its surface.

To assess the electrocatalytic performance of Pt/RGO towards methanol oxidation, Pt/RGO and the commercial Pt/C catalysts were examined by the cycle voltammetric technique, as shown in Fig. 4A. Cycle voltammograms of Pt/RGO composites and Pt/C have similar features. In the positive-going scan, oxidation peaks appear between 0.5 and 0.8 V due to the direct oxidation of methanol; in the backward scan, another oxidation peaks between 0.2 and 0.6 V are ascribed to the oxidation of intermediate carbonaceous residues caused by the direct oxidation of methanol during the positive-going scan. All the currents were normalized to the mass of Pt. By comparison, all mass activities of Pt/RGO composites and Pt/C, namely the current densities of the positive-going oxidation peaks, are showed in Fig. 4B. With the increase of Pt contents, the mass activity firstly increases, and then decreases. Obviously, Pt content is closely dependent on the electrocatalytic activity of Pt/RGO. Among all Pt/RGO nanocomposites, Pt24/RGO, Pt39/RGO and Pt52/RGO show better catalytic activities than Pt/C; Pt17/RGO and Pt19/RGO have lower activities (∼100 mA mgPt−1), similar to the previous report of Pt/wavy RGO,24 which may be ascribed to the low-loading amount of Pt. Although Pt content increases from Pt24/RGO to Pt52/RGO, the corresponding catalytic activity gradually decreases, which may be attributed to the aggregation of Pt nanoparticles, as shown in Fig. S4 and S5. Pt24/RGO has the best mass activity (553.4 mA mgPt−1), 3.26 times better than the commercial Pt/C, comparable to Pt nanoparticles loaded on graphene with the help of supercritical carbon dioxide (550.4 mA mgPt−1).16a Also, the mass activity of Pt24/RGO is also far better than previous analogous catalysts (Table 1).14b,17,35 Although dense Pt nanoparticles were produced on graphene surface by reducing PtCl62− with femto-second laser pulses21 and with the assistance of supercritical CO2,16b the mass activities of these two kinds of Pt/graphene towards methanol oxidation (Table 1) are still lower than that of Pt39/RGO (∼359 mA mgPt−1), and far inferior to that of Pt24/RGO in our case.


image file: c5ra03007b-f4.tif
Fig. 4 (A) Cycle voltammograms (A) and histograms of the mass activities and the specific activities (B) of five Pt/RGO composites and the commercial Pt/C in 0.5 mol L−1 H2SO4 + 1.0 mol L−1 CH3OH. The scan rate is 50 mV s−1. The mass activities and the specific activities were obtained according to the positive-going oxidation peaks.
Table 1 Comparison of mass activities of different graphene-based Pt catalysts
Catalyst Mass activity/mA mg−1 Reference
Pt24/RGO 550.4 This study
Pt/ionic liquid functionalized RGO ∼50 14b
Pt nanoparticle aggregates/RGO ∼199.6 17
Pt/graphene obtained through the thermal treatment of GO with Pt(acac)2 ∼70 35
Pt/graphene obtained with the assistance of femto-second laser pulses 295 21
Pt/graphene obtained with the assistance of supercritical CO2 246.7 16b
Pt dendrites/β-cyclodextrin functionalized RGO 478 36
Pt/PyS-functionalized graphene sheet 279.5 11
Pt/H3PW12O40-functionalized graphene nanosheet (Pt/PW12–graphene) 353.23 37
Pt/PANI-HPMo-functionalized RGO 322 7
Pt/RGO nanoscroll ∼450.3 38
Pt/3D network graphene 93.31 39
Pt/Ni/RGO catalyst ∼413 41
PtPd NWs/RGO ∼510 42
Pt/CeO2/graphene ∼450 32


Studies also demonstrated that functionalized RGO with organic linkers is helpful to some extent for improving the electrocatalytic activity of Pt nanoparticles towards methanol oxidation owing to their manipulation to Pt nanoparticle distribution on RGO. But this strategy cannot effectively improve the mass activities to methanol oxidation (Table 1)7,11,36,37 due to the limited loading amount of Pt. Additionally, 3D graphene nanostructure is considered to be a better alternative than flat graphene for loading Pt catalysts because it is able to provide large, accessible, multi-size pores for fast transportation of reactants to the electroactive sites of Pt nanoparticles and has a high electrical conductivity. Design of 3D graphene structure aims to increase the loading amount of Pt by taking advantage of its large surface area. In our case, the number density of Pt nanoparticles on RGO surface can be easily controlled simply by changing the added amount of Pt precursors. The optimized Pt24/RGO with a close-packed Pt NCs is enough to meet the requirement of the catalyst, and shows the better mass activity than Pt/RGO nanoscrolls (Table 1)38 and Pt/3D graphene architecture (Table 1).39

To greatly improve the catalytic performance of Pt nanoparticles, two approaches are usually taken: the first is to introduce another foreign metal to modify the electronic structure of platinum for improving its electrocatalytic activity to methanol oxidation, which is a very effective way to lower the density of states at the Fermi level and to weaken the adsorption of CO-like intermediates on Pt,40 such as, Pt/Ni/RGO,41 PtPd nanowires (NWs)/RGO,42 Pt-on-Pd/RGO,43 Pd/Pt core–shell nanoparticles/RGO,44 Pt/Cu/graphene,45 and Pt/Ru/graphene.46 The second is to rely upon the heterogeneous interaction between Pt and metal oxide that can provide –OH groups for radically enhancing their electrocatalytic activity and durability towards methanol oxidation,47 such as Pt/CeO2/graphene,32 Pt/TiO2/graphene,47 and Pt/SnO2/RGO.48 The enhanced effects of these two strategies are remarkable. Although Pt/RGO prepared in our case without introducing either foreign metallic elements or metal oxide, the optimized Pt24/RGO composite still has a better mass activity than Pt/Ni/RGO,41 PtPd NWs/RGO,42 and Pt/CeO2/graphene32 (Table 1).

After normalization with the ECSAs (Table S4), the specific activities of all Pt/RGO composites and the commercial Pt/C catalyst were obtained, as shown in Fig. 4B. With the increase of Pt contents, the specific activity of Pt/RGO changes with the same tendency as the mass activity, but only Pt24/RGO and Pt39/RGO show better specific activities than Pt/C. Pt24/RGO still exhibits the best specific activity (∼1.70 mA cm−2), nearly 2 times better than that of the commercial Pt/C, indicating that Pt24/RGO has the great capability of enhancing methanol electrooxidation. The specific activity of Pt24/RGO is far better than branched Pt NWs/RGO,49 Pt/CD-functionalized graphene36 and Pt/PW12–graphene,37 and is comparable to those of Pt/3D graphene monolith (3DGM),20c PtCu dendrites/RGO,45 and Pt hollow nanostructure/RGO.50

Additionally, the current density ratio of the forward oxidation peak to the backward oxidation peak, jf/jb, is usually used to describe the anti-poisoning capability of catalysts. The larger the jf/jb value, the more tolerant the catalyst is towards intermediate carbonaceous species. All jf/jb values of Pt/RGO composites (Table S4) are larger than Pt/C (0.87), indicating that poisoning intermediates are easily removed from Pt/RGO catalysts. The jf/jb values of Pt17/RGO and Pt24/RGO are 1.24 and 1.23, respectively, ∼1.5 times higher than that of the commercial Pt/C, suggesting that Pt17/RGO and Pt24/RGO have better tolerance towards poisoning intermediates than branched Pt NWs/RGO49 and Pt/3D graphene structure.15 This poisoning tolerance is similar to Pt/exfoliated graphene (jf/jb = 1.20),1 and even comparable to that of bimetallic nanoparticles/graphene, such as PtPd/RGO,42 Pt-on-Pd bimetallic dendrites/graphene nanosheet43 and hollow Pt/Ni/graphene.41 Although the number density of Pt nanoparticles on pristine graphene is similar to our result, the jf/jb value is just 0.89.4

Moreover, the catalytic stability was also further assessed by chronoamperometry, as shown in Fig. 5. At the beginning, all polarization current densities decrease rapidly due to the formation of the double-layer capacitance. Subsequently, the decay of current densities, i.e. lowering of the electrocatalytic activity, may be attributed to the adsorption of poisoning intermediates and the surface reconstruction of catalyst particles. At 2000 s, Pt24/RGO and Pt39/RGO show much better mass activities than Pt/C. The mass activities of Pt17/RGO, Pt19/RGO and Pt52/RGO are close to that of Pt/C. The current density on Pt24/RGO is nearly constant (11.8 mA mgPt−1) since 1700 s, while the current density on Pt39/RGO still tends to decrease, indicating that Pt24/RGO among all as-prepared Pt/RGO possesses satisfactory stability for methanol oxidation, consistent with the cyclic voltammetric result (Fig. 4A).


image file: c5ra03007b-f5.tif
Fig. 5 Chronoamperometric curves of Pt/RGO composites and Pt/C at 0.6 V in 0.5 mol L−1 H2SO4 +1.0 mol L−1 CH3OH. The inset show the curves between 1000 s and 2000 s for clarification.

The electrocatalytic performance of Pt catalyst depends on nanoparticle size, surface facet, surface composition, supporter and loading amount, which collaboratively contributes to the final performance of Pt catalyst. Although all Pt/RGO composites were prepared under the similar conditions, but Pt/RGO composites with different loading amounts exhibit different catalytic activities, which mainly depends on the loading amounts and arrangement of Pt nanoparticles. Compared with Pt/C, Pt24/RGO, Pt39/RGO and Pt52/RGO are better in the case of the mass activity while Pt17/RGO and Pt19/RGO are not. Pt nanoparticles in the commercial Pt/C have an average diameter of 4.2 nm, larger than that of Pt NCs in Pt/RGO composites, which is one possible reason for the worse activity of Pt/C. However, particle size is not a crucial factor because Pt17/RGO and Pt19/RGO with ∼3 nm Pt NCs do not show better activities. Among all Pt/RGO nanocomposites, Pt24/RGO has the best electrocatalytic performance and stability, which may be attributed to the close-packed structure of Pt NCs. we previously demonstrated that close-packed Au/Pt core–shell nanoparticle monolayer, compared with randomly distributed counterparts, has three-fold enhancement in the mass activity towards methanol electrooxidation.51

Conclusions

Briefly, one-pot, organic linker-free strategy is proposed to fabricate Pt/RGO composites. The number density and the arrangement of Pt nanoparticles on RGO surface can be tuned simply by changing the amount of Pt precursors. With the increase of Pt contents in Pt/RGO, the arrangement of Pt nanoparticles on RGO surface changes from isolated distribution to close-packed monolayer, to linear aggregation. Catalytic measurements indicate that the electrocatalytic performance Pt/RGO mainly depends on the loading amount and the arrangement of Pt nanoparticles on RGO. Pt24/RGO with a close-packed monolayer of Pt nanoparticles shows the best electrochemical activity and stability towards methanol oxidation, 3.26 times in the mass activity better than the commercial Pt/C catalyst, and even comparable to some Pt-based bimetallic nanoparticle/graphene and Pt/metal oxide/graphene hybrids. This facile approach does not particularly involve the functionalization of RGO and harsh conditions, which not only fabricates Pt/RGO catalyst with different loading amounts, also adjusts the arrangement of Pt nanoparticles on RGO surface.

Acknowledgements

This study was financed by NSFC (no. 21176060) and Chemical Science Base (nos J1210040 and J1103312) of Hunan University.

Notes and references

  1. W. Qian, R. Hao, J. Zhou, M. Eastman, B. A. Manhat, Q. Sun, A. M. Goforth and J. Jiao, Carbon, 2013, 52, 595 CrossRef CAS PubMed.
  2. W. Qin and X. Li, J. Phys. Chem. C, 2010, 114, 19009 CAS.
  3. (a) M. M. Liu, R. Z. Zhang and W. Chen, Chem. Rev., 2014, 114, 5117 CrossRef CAS PubMed; (b) S. Wang, X. Wang and S. P. Jiang, Phys. Chem. Chem. Phys., 2011, 13, 6883 RSC.
  4. Y. Shen, Z. Zhang, R. Long, K. Xiao and J. Xi, ACS Appl. Mater. Interfaces, 2014, 6, 15162 CAS.
  5. X. Yu, H. Wang, L. Guo and L. Wang, Chem.–Asian J., 2014, 9, 3221 CrossRef CAS PubMed.
  6. D. Liu, L. Yang, J. S. Huang, Q. H. Guo and T. Y. You, RSC Adv., 2014, 4, 13733 RSC.
  7. Z. Cui, C. X. Guo and C. M. Li, J. Mater. Chem. A, 2013, 1, 6687 CAS.
  8. S. Mayavan, H.-S. Jang, M.-J. Lee, S. H. Choi and S.-M. Choi, J. Mater. Chem. A, 2013, 1, 3489 CAS.
  9. J.-D. Qiu, G.-C. Wang, R.-P. Liang, X.-H. Xia and H.-W. Yu, J. Phys. Chem. C, 2011, 115, 15639 CAS.
  10. M. Chen, Y. Meng, J. Zhou and G. Diao, J. Power Sources, 2014, 265, 110 CrossRef CAS PubMed.
  11. Q. Liang, L. Zhang, M. Cai, Y. Li, K. Jiang, X. Zhang and P. K. Shen, Electrochim. Acta, 2013, 111, 275 CrossRef CAS PubMed.
  12. R.-X. Wang, J.-J. Fan, Y.-J. Fan, J.-P. Zhong, L. Wang, S.-G. Sun and X.-C. Shen, Nanoscale, 2014, 6, 14999 RSC.
  13. J.-P. Zhong, Y.-J. Fan, H. Wang, R.-X. Wang, L.-L. Fan, X.-C. Shen and Z.-J. Shi, Electrochim. Acta, 2013, 113, 653 CrossRef CAS PubMed.
  14. (a) G. Shi, Z. Wang, J. Xia, S. Bi, Y. Li, F. Zhang, L. Xia, Y. Li, Y. Xia and L. Xia, Electrochim. Acta, 2014, 142, 167 CrossRef CAS PubMed; (b) J. Park, S.-J. Park and S. Kim, J. Electrochem. Soc., 2014, 161, F641 CrossRef CAS PubMed.
  15. H. Qiu, X. Dong, B. Sana, T. Peng, D. Paramelle, P. Chen and S. Lim, ACS Appl. Mater. Interfaces, 2013, 5, 782 CAS.
  16. (a) J. Zhao, L. Zhang, T. Chen, H. Yu, L. Zhang, H. Xue and H. Hu, J. Phys. Chem. C, 2012, 116, 21374 CrossRef CAS; (b) J. Zhao, H. Yu, Z. Liu, M. Ji, L. Zhang and G. Sun, J. Phys. Chem. C, 2014, 118, 1182 CrossRef CAS.
  17. Y. Li, L. Tang and J. Li, Electrochem. Commun., 2009, 11, 846 CrossRef CAS PubMed.
  18. G. Wu, H. Huang, X. Chen, Z. Cai, Y. Jiang and X. Chen, Electrochim. Acta, 2013, 111, 779 CrossRef CAS PubMed.
  19. A. Mondal and N. R. Jana, ACS Catal., 2014, 4, 593 CrossRef CAS.
  20. (a) Y.-G. Zhou, J.-J. Chen, F.-B. Wang, Z.-H. Sheng and X.-H. Xia, Chem. Commun., 2010, 46, 5951 RSC; (b) T. Teranishi, M. Hosoe, T. Tanaka and M. Miyake, J. Phys. Chem. B, 1999, 103, 3818 CrossRef CAS; (c) T. Maiyalagan, X. Dong, P. Chen and X. Wang, J. Mater. Chem., 2012, 22, 5286 RSC; (d) K. Kakaei and M. Zhiani, J. Power Sources, 2013, 225, 356 CrossRef CAS PubMed.
  21. H.-W. Chang, Y.-C. Tsai, C.-W. Cheng, C.-Y. Lin and P.-H. Wu, J. Power Sources, 2013, 239, 164 CrossRef CAS PubMed.
  22. W. S. Hummers and R. E. Offeman, J. Am. Chem. Soc., 1958, 80, 1339 CrossRef CAS.
  23. D. Li, M. B. Muller, S. Gilje, R. B. Kaner and G. G. Wallace, Nat. Nanotechnol., 2008, 3, 101 CrossRef CAS PubMed.
  24. J.-J. Shao, Z.-J. Li, C. Zhang, L.-F. Zhang and Q.-H. Yang, J. Mater. Chem. A, 2014, 2, 1940 CAS.
  25. (a) J. Liu, P. Raveendran, G. Qin and Y. Ikushima, Chem. Commun., 2005, 2972 RSC; (b) J. Liu, G. Qin, P. Raveendran and Y. Ikushima, Chem.–Eur. J., 2006, 12, 2131 CrossRef CAS PubMed.
  26. Z. Liu, L. M. Gan, L. Hong, W. Chen and J. Y. Lee, J. Power Sources, 2005, 139, 73 CrossRef CAS PubMed.
  27. (a) C. V. Rao, C. R. Cabrera and Y. Ishikawa, J. Phys. Chem. C, 2011, 115, 21963 CrossRef; (b) C. V. Rao and B. Viswanathan, J. Phys. Chem. C, 2010, 114, 8661 CrossRef CAS.
  28. (a) H.-J. Shin, K. K. Kim, A. Benayad, S.-M. Yoon, H. K. Park, I.-S. Jung, M. H. Jin, H.-K. Jeong, J. M. Kim, J.-Y. Choi and Y. H. Lee, Adv. Funct. Mater., 2009, 19, 1987 CrossRef CAS PubMed; (b) H. Huang, H. Chen, D. Sun and X. Wang, J. Power Sources, 2012, 204, 46 CrossRef CAS PubMed.
  29. M.-Y. Yen, C.-C. Teng, M.-C. Hsiao, P.-I. Liu, W.-P. Chuang, C.-C. M. Ma, C.-K. Hsieh, M.-C. Tsai and C.-H. Tsai, J. Mater. Chem., 2011, 21, 12880 RSC.
  30. (a) M. N. Groves, C. Malardier-Jugroot and M. Jugroot, J. Phys. Chem. C, 2012, 116, 10548 CrossRef CAS; (b) C. Nethravathi, E. A. Anumol, M. Rajamathi and N. Ravishankar, Nanoscale, 2011, 3, 569 RSC; (c) I. Fampiou and A. Ramasubramaniam, J. Phys. Chem. C, 2012, 116, 6543 CrossRef CAS; (d) H. Vedala, D. C. Sorescu, G. P. Kotchey and A. Star, Nano Lett., 2011, 11, 2342 CrossRef CAS PubMed.
  31. J.-N. Zheng, S.-S. Li, F.-Y. Chen, N. Bao, A.-J. Wang, J.-R. Chen and J.-J. Feng, J. Power Sources, 2014, 266, 259 CrossRef CAS PubMed.
  32. S. Yu, Q. Liu, W. Yang, K. Han, Z. Wang and H. Zhu, Electrochim. Acta, 2013, 94, 245 CrossRef CAS PubMed.
  33. (a) A. Kowal, S. N. Port and R. J. Nichols, Catal. Today, 1997, 38, 483 CrossRef CAS; (b) G. Chen, Y. Zhao, G. Fu, P. N. Duchesne, L. Gu, Y. Zheng, X. Weng, M. Chen, P. Zhang, C.-W. Pao, J.-F. Lee and N. Zheng, Science, 2014, 344, 495 CrossRef CAS PubMed.
  34. B. Seger and P. V. Kamat, J. Phys. Chem. C, 2009, 113, 7990 CAS.
  35. S. Mayavan, J.-B. Sim and S.-M. Choi, J. Mater. Chem., 2012, 22, 6953 RSC.
  36. Z. Li, L. Zhang, X. Huang, L. Ye and S. Lin, Electrochim. Acta, 2014, 121, 215 CrossRef CAS PubMed.
  37. L. Zhang, Z. Li, X. Huang, L. Ye and S. Lin, J. Solid State Electrochem., 2014, 8, 2005 CrossRef.
  38. Y. Liu, Y. Xia, H. Yang, Y. Zhang, M. Zhao and G. Pan, Nanotechnology, 2013, 24, 235401 CrossRef PubMed.
  39. M. Wang, X. Song, Q. Yang, H. Hua, S. Dai, C. Hua and D. Wei, J. Power Sources, 2015, 273, 624 CrossRef CAS PubMed.
  40. Y. J. Hu, P. Wu, Y. J. Yin, H. Zhang and C. X. Cai, Appl. Catal., B, 2012, 208, 111 Search PubMed.
  41. Y. Hu, P. Wu, H. Zhang and C. Cai, Electrochim. Acta, 2012, 85, 314 CrossRef CAS PubMed.
  42. S. Du, Y. Lu and R. Steinberger-Wilckens, Carbon, 2014, 79, 346 CrossRef CAS PubMed.
  43. S. Guo, S. Dong and E. Wang, ACS Nano, 2009, 4, 547 CrossRef PubMed.
  44. J.-X. Feng, Q.-L. Zhang, A.-J. Wang, J. Wei, J.-R. Chen and J.-J. Feng, Electrochim. Acta, 2014, 142, 343 CrossRef CAS PubMed.
  45. F. Li, Y. Guo, M. Chen, H. Qiu, X. Sun, W. Wang, Y. Liu and J. Gao, Int. J. Hydrogen Energy, 2013, 38, 14242 CrossRef CAS PubMed.
  46. Z. Bo, D. Hu, J. Kong, J. Yan and K. Cen, J. Power Sources, 2015, 273, 530 CrossRef CAS PubMed.
  47. L. Ye, Z. Li, L. Zhang, F. Lei and S. Lin, J. Colloid Interface Sci., 2014, 433, 156 CrossRef CAS PubMed.
  48. H. Huang, Y. Liu, Q. Gao, W. Ruan, X. Lin and X. Li, ACS Appl. Mater. Interfaces, 2014, 6, 10258 CAS.
  49. Z. Luo, L. Yuwen, B. Bao, J. Tian, X. Zhu, L. Weng and L. Wang, J. Mater. Chem., 2012, 22, 7791 RSC.
  50. Y.-P. Xiao, S. Wan, X. Zhang, J.-S. Hu, Z.-D. Wei and L.-J. Wan, Chem. Commun., 2012, 48, 10331 RSC.
  51. M.-Y. Duan, R. Liang, N. Tian, Y.-J. Li and E. S. Yeung, Electrochim. Acta, 2013, 87, 432 CrossRef CAS PubMed.

Footnote

Electronic supplementary information (ESI) available: Summary of XPS analysis result and electrochemical characterization of Pt/RGO. See DOI: 10.1039/c5ra03007b

This journal is © The Royal Society of Chemistry 2015
Click here to see how this site uses Cookies. View our privacy policy here.