The influence of hierarchical TiO2 microspheres on the trap state distribution and charge transport/recombination dynamics in quantum dot sensitized solar cells
Xiao-Juan Shia,
Yi Wanga,
Dapeng Wubc,
Yujun Qina,
Xi-Cheng Ai*a,
Dongsheng Xub and
Jian-Ping Zhanga
aDepartment of Chemistry, Renmin University of China, Beijing 100872, P. R. China. E-mail: xcai@ruc.edu.cn; Fax: +86-10-62516444; Tel: +86-10-62516604
bColleage of Chemistry and Molecular Engineering, Peking University, Beijing 100871, P. R. China
cSchool of Chemistry and Chemical Engineering, Henan Normal University, Henan, Xinxiang 453007, P. R. China
First published on 30th March 2015
Abstract
Two different kinds of quantum dot sensitized solar cells (QDSSCs) were fabricated based on the photoanode materials P25 (Cell-P25) and hierarchical TiO2 microspheres (HMS, Cell-HMS). The trap state distributions and charge transport/recombination dynamics are comparatively investigated by means of time-resolved charge extraction and transient photovoltage measurements. The dynamics results prove that, compared to Cell-P25, Cell-HMS possesses higher density and lower trap state energy characteristics, as well as a 30% lower charge transport rate. In addition, the boundary level dividing lower-voltage iso-energetic charge recombination and higher-voltage multiple-trap limited charge recombination is experimentally determined. Furthermore, Cell-HMS is found to exhibit a slightly higher boundary voltage and a 96% lower recombination rate with respect to Cell-P25. A physical model is proposed to describe the influence of trap state distribution on charge transport/recombination, highlighting the importance of photoanode morphology in optimizing the photovoltaic performance of QDSSCs.
1. Introduction
Since Nozik's team replaced the organic dye in dye sensitized solar cells (DSSCs) with InP quantum dots (QDs) and fabricated the first quantum dot sensitized solar cell (QDSSC) in 1988,1 such novel photovoltaic devices have attracted significant attention as the promising third-generation solar cell owing to the high energy conversion efficiency and low cost.2–4 In QDSSCs, the introduction of QDs offers new advantages of hot electron injection5 and multi-exciton generation,6 and the band gap of QDs can be adjusted by changing the particle size.7 So far, a large variety of narrow band semiconductors, such as CdS, CdTe, CdSe, PbS, etc. have been used as the QD sensitizers in QDSSCs and the PCE has reached more than 6%.8–10Similar to the dye in conventional DSSCs, the QDs are excited by incident light to generate electron–hole pairs and the electrons are subsequently injected into the TiO2 conduction band, and then collected by the transparent conductive oxide electrode. At the same time, the holes are injected into the hole-transporting electrolyte and finally reach the counter electrode, on which the oxidized counterpart of the electrolyte is reduced. Therein, the morphology of photoanode plays a crucial role in the photovoltaic performance of QDSSCs and various TiO2 photoanodes have been fabricated. For example, TiO2 arrays composed of nanotube, nanowires, or nanorods as photoanode have been utilized in QDSSCs and significantly improved the PCE of the devices.11–13 Recently, novel hierarchical TiO2 structures have attracted considerable attention as promising photoanode materials.14–16 Mesoporous anatase TiO2 beads with high surface areas and controllable pore sizes prepared through a combined sol–gel and solvothermal process effectively promoted the PCE of corresponding DSSC device than P25-based DSSC.17 Surfactant-directed self-assembly of size-tunable mesoporous TiO2 microspheres was also employed in quasi-solid state DSSCs, which provided efficient light harvest and charge collection.18 In addition, three dimensional hierarchical TiO2 nanotube branches assembled onto the primary hollow TiO2 nanofibrous backbone could offer large surface area for high QD loading and high light-scattering property.19 The hierarchical TiO2 microspheres consisting of nanorods and nanoparticles were also employed in QDSSCs and achieved a PCE over 4%.20
Hitherto, the influence of the hierarchical photoanode morphologies on the photovoltaic performance of QDSSCs is focused on the investigation of the factors such as particle structure, pore size distribution and light-harvesting effect, and so on.14–19 In fact, the affect of morphologies on the trap states, charge transport and recombination kinetics of the device is also noteworthy. In general, the distribution of trap states could be obtained by measuring the chemical capacitance Cμ through electrochemical impedance spectroscopy.21–23 By comparing the Cμ values of photoanode with and without loading QDs, Zaban et al. has confirmed that the QDs surface states may contribute to the experimental distribution of trap states.21 And the surface states of photoanode materials are also found to exist in the photoelectrode and can be effectively eliminated by surface modification such as TiCl4 treatment.22,23 Actually, the energy states referring to photoanodes of QDSSCs with different materials and morphologies need further study. In the traditional DSSCs, the trap states play a key role in the charge transport, which can be described by the multiple-trap model or the hopping model. The former model assumes that electrons in trap states have to be activated to the conduction band to participate in the charge transport, while the latter assumes a tunneling mechanism in the intra-gap states.24–27 However, it is unclear if either of the models is applicable to the charge transport in QDSSCs. Besides, the recombination dynamic is also significantly influenced by the distribution of trap states. Bisquert et al. have proposed a typical recombination model in DSSCs with three distinct classes: (a) the conduction band states with a constant recombination rate; (b) the exponential distribution of bulk trap states obeying the multiple-trap limited recombination mechanism; (c) the iso-energetic surface states with a minimum parabolic velley.28 So far, the recombination mechanisms and models in QDSSCs still lacks systematic study and Bisquert's model might be used for reference. In addition, the recombination dynamics in QDSSCs is usually measured by means of electrochemical impedance spectroscopy (EIS), intensity modulated photovoltage spectroscopy (IMVS) or open-circuit photovoltage decay, which has their own advantages of easy operation and analysis.21–23,29,30 In contrast, another effective technique, the transient photovoltage (TPV) measurement, is time-consuming, but it is advantageous in providing the dynamic result at different energy states by modulating bias light intensities.31
Obviously, the study on the preparation of QDSSCs with hierarchical TiO2 microspheres has achieve a lot of progress, while the involved mechanism research seems insufficient, especially about the trap states distribution and charge transport/recombination dynamics. In this work, based on two kinds of QDSSCs with P25 and HMS as photoanode material respectively, the distribution of trap states and the charge transport dynamics is measured by the technique of time-resolved charge extraction (TRCE).32,33 In addition, the influence of trap states on the recombination dynamics is investigated by TPV measurement with different bias light intensities. Finally, a physical model involving trap states distribution, charge transport and recombination is put forth upon the related experimental results.
2. Experimental section
2.1 HMS preparation
The HMS particles were prepared according to our previous work.34 Briefly, 0.65 g of P25 was dispersed in a mixture solution of 87.5 mL of hydrogen peroxide (H2O2, 30 wt%) and 12.5 mL of ammonia (NH4OH, 26–28 wt%). The mixture was stirred for 24 h and converted to clear orange precursor solution. Afterwards, 20 mL of the precursor, 20 mL of distilled water and 40 mL of ethanol were transferred into a 100 mL Teflon container, which was then sealed tightly with a stainless jacket and heated at 160 °C for 30 min. After washing with water, the white precipitate was dispersed into the 40 mL distilled water and sealed in a 50 mL Teflon-lined autoclave and heated at 180 °C for 6 h. The final white precipitate was then washed with water and ethanol several times. The average size of as-prepared HMS is ∼400 nm with specific surface area about ∼100 m2 g−1 while the specific surface area of commercial P25 (Degussa) is about 50 m2 g−1.2.2 QDSSC fabrication
The photoanode was prepared according to the literature.35 Hydroxypropyl cellulose (Aldrich) was added into the polyethylene glycol with weight ratio of 10% and stirred at 100 °C for 6 h to yield the paste. Different TiO2 materials (P25 or HMS) were added into the paste with vigorous stirring to prepare the uniform slurries, which was coated onto the substrate by doctor-blade method. After drying at room temperature, the photoanode was calcinated at 450 °C for 30 min with heating rate of 5 °C min−1. The photoanode film was treated in 40 mM TiCl4 solution in an oil bath at 70 °C for 30 min and then calcinated at 450 °C for 30 min with the same heating rate.A modified chemical bath deposition method was applied for the deposition of the QDs on the TiO2 photoanode.36,37 To load the CdS QDs, TiO2 photoanode was immersed in an aqueous solution with the composition of 0.02 mM CdCl2, 0.14 mM thiourea, 0.07 mM NH4Cl and 0.23 mM ammonia with a final pH of ∼9.0 in the chemical bath at 10 °C for 45 min. Afterwards, the CdSe QDs were deposited by immersing the films in an aqueous solution containing 0.026 mM CdSO4, 0.04 mM N(CH2COONa)3 and 0.026 mM Na2SeO3 for 6 h in the same way. Finally, the films were treated with ZnS passivation by twice dipping alternatively into 0.1 M Zn(CH3COO)2 and 0.1 M Na2S solutions for 1 min per dip, rinsing with deionized water between dips. The QD-sensitized photoelectrode and counter electrode were assembled to a sandwiched cell and the electrolyte composed of 1 M Na2S and 1 M S in deionized water was injected into the slit via capillarity.
2.3 Photo-electrical measurements
TRCE is an established technique as reported in the previous work.32,33 The cell was illuminated from the substrate side by a Nd3+:YAG laser (Quanta-Ray Pro-230 Series) with wavelength of 532 nm, pulse width of 10 ns, pulse energy of 170 μJ. The photovoltage signals were recorded by a digital storage oscilloscope (64Xs, Lecroy; input impendence, 1 MΩ). At an indicated delay time during the photovoltage decay, a CMOS analog switch driven by a DG535 (Stanford Research System) was adopted to switch the cell from open circuit to short circuit. In this way, the charge stored in the cell can be extracted at the corresponding delay time (or photovoltage).TPV is frequently used to evaluate charge recombination lifetime in the device. In order to study the relationship between the charge recombination rate and the open-circuit photovoltage, a green-light-emitting diode with central wavelength of 530 nm was used to generated different bias photovoltage (0–500 mV), and the transient photovoltage was recorded by the oscilloscope as mentioned above. A small perturbation photovoltage from 532 nm pulse laser was used to generate a small perturbation which is controlled less than 5% compared with the bias photovoltage.
3. Results and discussion
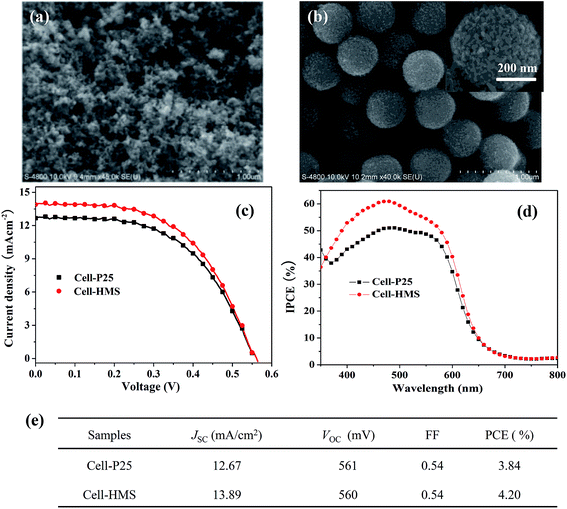
To investigate the influence of the HMS photoanode on the photovoltaic performance of QDSSCs, traditional P25 photoanode based QDSSC is also fabricated for reference. The photoanode morphology of the two types of devices is significantly different from each other, as shown in Fig. 1a and b. Obviously, P25 shows the morphology of random stacking from TiO2 nanoparticle with the average size of ∼25 nm. While HMS is microspheres with the diameter of ∼400 nm, which are assembled from ∼20 nm nanoparticles, as revealed in the inserted image of Fig. 1b.34 Due to the different photoanode materials, the two target devices demonstrate different photovoltaic performance. The J–V curves of the two devices are shown in Fig. 1c, with the photovoltaic characteristics listed in Fig. 1d. It can be seen that the PCE of Cell-HMS is 4.2%, which is 9% higher than that of Cell-P25 (3.8%). Besides, the two devices possess the same or similar open-circuit voltage (VOC) and fill factor (FF). The increase of PCE in Cell-HMS should be owing to its higher short-circuit current density (Jsc) of 13.89 mA cm−2 compared with 12.67 mA cm−2 for Cell-P25.According to the previous report, the significant increase of Jsc for microspheres photoanode is mainly attributed to the increase of photogenerated charges.34 It is generally considered that microspheres with higher specific surface area can uptake more sensitizers and enhance the light scattering, promoting the absorption of incident light.17,18,38 The incident photon-to-current conversion efficiency (IPCE) spectra demonstrated in Fig. 1d can also confirm the superior light harvest effect for Cell-HMS compared with Cell-P25. Besides, the Jsc is determined by the efficiency of charge collection which is in turn controlled by photogenerated charge transport and recombination. Considering the importance of distribution of trap states to the charge transport and recombination, it is necessary to identify the relationship between the distribution of trap state, charge transport and recombination for the two devices.
3.1 Chemical capacitance and density of states
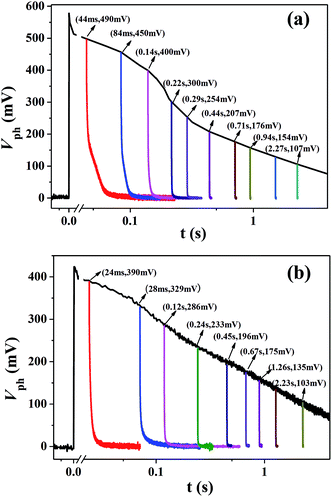
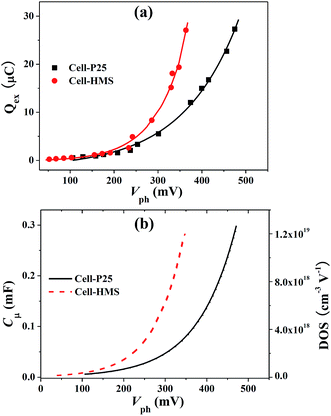
TRCE is an effective technique to evaluate charge distribution and the dynamic of charge transport in the photoanode. As shown in Fig. 2, the black line represents the open-circuit photovoltage decay caused by recombination of the photogenerated electrons and the vertical colored lines are the extraction curves at indicated photovoltage (or decay time) by switching the cell from open-circuit to short-circuit condition. The extracted charge (Qex) at different photovoltage (or decay time) can be obtained by integrating the extraction curves with decay time, as shown in Fig. 3a. It can be seen that the two cells show similar extracted charge at the region lower than 200 mV. However, in the region higher than 200 mV, the extracted charges for Cell-HMS increase more rapidly compared with that of Cell-P25, which may arise from the relatively higher density of trap states in Cell-HMS due to the grain boundaries among the assembled particles in microspheres or contacts between the microspheres and QDs.In addition, it is found that the extracted charge increases exponentially versus photovoltage, and the chemical capacitance Cμ can be calculated by taking the derivative with respect to Qex. Then the DOS of trap states can be obtained by DOS = Cμ/edS(1 − p), where d is the films thickness, S is the effective area of photoanode, and p is the porosity.39 The resulting chemical capacitance Cμ and DOS of the two types of devices are plotted in Fig. 3b. The Cμ values obtained for Cell-HMS are higher than Cell-P25, which is in consistent with the EIS result of TiO2 microsphere-based QDSSCs.40 Obviously, DOS increases exponentially versus photovoltage, and the trap states distribution can be fitted by the equation Ctrapμ = Ctrap0![[thin space (1/6-em)]](https://www.rsc.org/images/entities/char_2009.gif) exp(eVph/kBT0).41–43 Then the characteristic energy kBT0 values can be calculated as 70 meV for Cell-HMS and 93 meV for Cell-P25, respectively, which indicates that Cell-HMS shows a shallower distribution of DOS and higher density of trap states. In another word, more electrons are distributed in the shallower trap states of Cell-HMS. Moreover, electrons with lower activation energy for Cell-HMS are prone to be extracted out and may effectively favor the charge collection even at lower photovoltage, which is in consistent with its relatively larger amount of extracted charge, as revealed in Fig. 3a.
exp(eVph/kBT0).41–43 Then the characteristic energy kBT0 values can be calculated as 70 meV for Cell-HMS and 93 meV for Cell-P25, respectively, which indicates that Cell-HMS shows a shallower distribution of DOS and higher density of trap states. In another word, more electrons are distributed in the shallower trap states of Cell-HMS. Moreover, electrons with lower activation energy for Cell-HMS are prone to be extracted out and may effectively favor the charge collection even at lower photovoltage, which is in consistent with its relatively larger amount of extracted charge, as revealed in Fig. 3a.
3.2 Charge transport dynamics
Apart from the distribution of trap states, TRCE can also give the information about charge transport dynamics.33 Typical extraction kinetics consists of a fast photovoltage drop within 6 μs and a subsequent slow decay, corresponding to the discharge of substrate capacitance and chemical capacitance, respectively. The slow decay kinetics of the two devices is shown in Fig. 4, from which the charge transport in TiO2 photoanode under short-circuit condition could be obtained. The photovoltage decay rate increase with the decrease of photovoltage for both devices and the apparent extraction time constant τapp can be derived by exponential fitting to the decay curves, as is shown in Fig. 5a. Obviously, in the voltage region lower than 200 mV, the τapp values of the Cell-HMS shows slightly larger than Cell-P25, while in the photovoltage region larger than 200 mV, the τapp values of Cell-HMS increase much faster than Cell-P25, which may arise from the density of trap states as illustrated in Fig. 3a.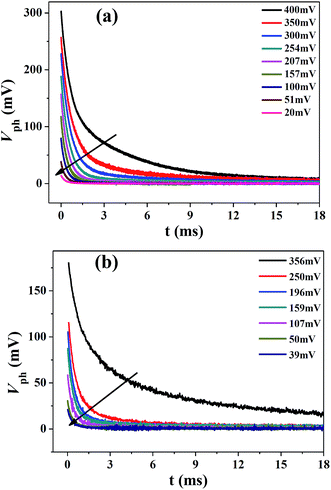 | ||
| Fig. 4 TRCE kinetics of the slow decay region with the extraction time set to zero for (a) Cell-P25 and (b) Cell-HMS, respectively. The black arrows indicate the decrease of the photovoltage. | ||
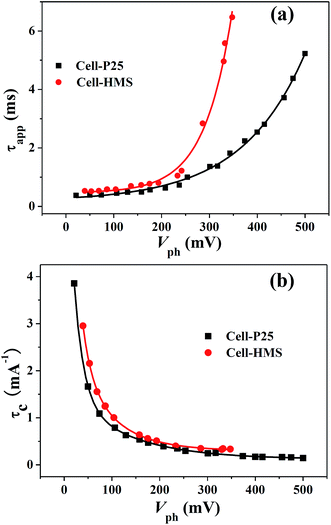 | ||
| Fig. 5 (a) The apparent extraction time τapp and (b) characteristic extraction time at different photovoltage for Cell-P25 and Cell-HMS, respectively. | ||
However, it should be kept in mind that more electrons are populated at higher photovoltage and consequently a larger amount of charges should be extracted out in that case. Therefore, τapp is an appropriate value determined by the amount of charges and the transport rate. In order to evaluate the comparable charge transport rate, the characteristic extraction time constant τc is defined by dividing τapp with the corresponding extracted charges, implying the time constant for extracting out the same amount of charges. As shown in Fig. 5b, Cell-HMS demonstrates a slightly lower charge transport rate and the τc–Vph curves can be fitted by exponential decay, which can be described as multiple-trap limited transport mechanism.33 Although the average transport rate for Cell-HMS is calculated to be ∼30% lower with respect to Cell-P25, it should be noted that the average DOS increase for Cell-HMS is about five times larger than that of Cell-P25 in the region of 200 mV to 350 mV, as revealed in Fig. 3b. This indicates that the trapping and detrapping rate for Cell-HMS is much faster compared with Cell-P25. Meanwhile, the higher density of trap states in Cell-HMS means electrons must take more trapping and detrapping steps before they are eventually released to the conduction band within the multiple-trap frameworks, which would inevitably slow down the transport rate. On the other hand, electrons in Cell-HMS possess a lower characteristic energy, which are more likely to be activated and thus may accelerate the transport process. As a result, the higher density and shallower distribution of DOS, which influence the rate of charge transport from two opposite aspects, result in ∼30% lower transport rate for Cell-HMS compared with Cell-P25. Obviously, in view of the transport process, such hierarchical structure would bring negative influence due to the high trap state density.
3.3 Charge recombination dynamics
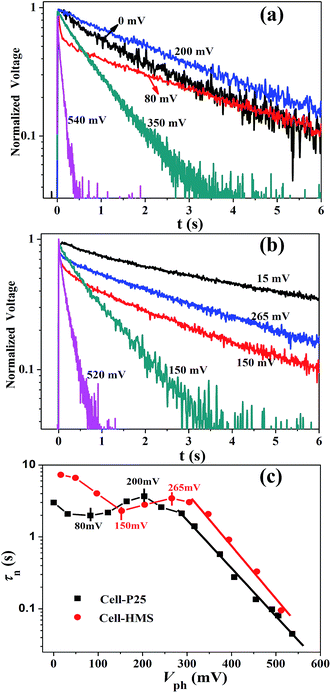
In addition to the charge transport kinetics, we have also investigated the recombination dynamics by means of TPV with different bias light intensities. Fig. 6a and b represent the normalized voltage curves of some characteristic transient photovoltage for Cell-P25 and Cell-HMS, respectively. It could be found that the relationship between the recombination rate and the photovoltage experiences three different procedures: (a) the recombination rate increases with photovoltage in the region of 0–80 mV for Cell-P25 and 15–150 mV for Cell-HMS, respectively; (b) along with the rise of photovoltage, the recombination rate turns to decreases in the region of 80–200 mV and 150–265 mV for Cell-P25 and Cell-HMS, respectively; (c) at even higher photovoltage, the recombination rate significantly increases with photovoltage. From the variation of recombination lifetime τn for different bias voltage illustrated in Fig. 6c, it can be seen that τn of Cell-P25 decreases in the photovoltage region of 0–80 mV, followed by an increase in the region of 80–200 mV, respectively. While for Cell-HMS, similar tendency is also observed with the evolution of τn appearing in the photovoltage region 15–150 mV and 150–265 mV, respectively. Beyond the maximum at 200 mV for Cell-P25 and 265 mV for Cell-HMS, the τn decreases continuously over photovoltage.Obviously, the τn–Vph plot involves two distinct regimes, a parabolic regime (<200 mV for Cell-P25 and <265 mV for Cell-HMS) and a linear regime at higher voltage region, which could be ascribed to different recombination mechanism. The charge recombination in the parabolic region is considered to be dominated by iso-energetic charge transfer through surface states, and the parabolic minimum represents the characteristic energy level of iso-energetic charge recombination, which is significantly influenced by the distribution of trap states.28 The minimum of Cell-HMS is 80 mV and 150 mV for Cell-P25, indicating a 70 mV shift to high potential level for Cell-HMS, in consistent with its shallower DOS distribution. As the photovoltage increases beyond 200 mV and 265 mV for Cell-P25 and Cell-HMS respectively, recombination lifetime decays exponentially as described by the multiple-trap limited recombination mechanism.24,28,44 Besides, the intersection point for the two regimes is also closely related to the density of the trap states and is regarded as the boundary level dividing the lower-voltage iso-energetic charge recombination through surface states to higher-voltage multiple-trap limited recombination. The boundary voltage of 265 mV for Cell-HMS is 65 mV higher compared with 200 mV for Cell-P25, which is in consisted with its higher density of trap states. In addition, it could be noted that the average recombination rate for Cell-HMS is 96% lower compared with Cell-P25, which can be attributed to the higher surface area that could effectively load QDs and prevent the contact between TiO2 and electrolyte.37 Besides, the HMS photoanode with the large pores could allow the full electrolyte permeation and prolong the recombination lifetime.18 The slower recombination rate for microsphere-based photoanode were also founded from the results of EIS in other reports.45,46 Therefore, although charge transport rate of Cell-HMS is about 30% slower than that of Cell-P25, as mentioned above, the dramatic increase of the recombination lifetime leads to an efficient charge collection in Cell-HMS.
3.4 Influence of DOS on charge transport and recombination
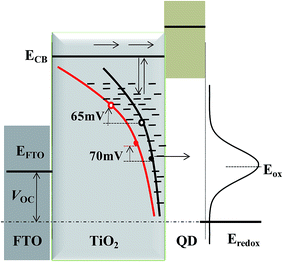
The aforementioned findings allowed us to propose a detailed scheme describing the influence of trap state distribution on charge transport/recombination, which is shown in Fig. 7. With reference to Cell-P25, Cell-HMS shows higher overall trap state density but shallower DOS distribution, resulting in slower charge transport but faster trapping–detrapping processes. The charge recombination process is also significantly influenced by the trap states. The characteristic energy level of iso-energetic recombination through surface trap for Cell-HMS is 70 mV higher compared with that of Cell-P25, in accord with the shallower DOS distribution. Meanwhile, the boundary level from lower-voltage iso-energetic recombination to higher-voltage multiple-trap limited recombination also demonstrates a 65 mV upward shift for Cell-HMS with its higher density of trap states.The dynamics performance would significantly affect photovoltaic parameters of the device. The much lower recombination rate in Cell-HMS should benefit the increase of VOC,47–49 while the higher density of trap states would reduce the VOC because more electrons are filled in the trap states. The two devices demonstrate a similar VOC upon the influence of these opposite factors. Therefore, it can be concluded that trap states play a negative role in the device performance and should be reduced as far as possible. Actually, the trap states are expected to be distributed almost near the bottom edge of the conduction band. In this view, TiO2 structure with enhanced crystal quality and less defects should be favorable as a photoanode materials for QDSSCs.
4. Conclusions
In summary, two kinds of QDSSCs with different photoanode morphology were prepared based on P25 and HMS photoanode to systematically study the DOS of the trap state, charge transport and recombination dynamics by means of TRCE and TPV techniques. Compared with Cell-P25, Cell-HMS shows a higher density of trap states and shallower distribution of DOS, which can influence the charge transport rate from two opposite ways within the multiple-trap limited transport mechanism. Cell-HMS shows a slightly lower transport rate but faster trapping and detrapping process compared with Cell-P25. In addition, the charge recombination rate for Cell-HMS is 96% lower than that of Cell-P25, which effectively promotes the charge collection. The characteristic energy level of iso-energetic charge recombination is 70 mV higher in Cell-HMS than that in Cell-P25 with different DOS distribution. Meanwhile, the boundary energy level dividing lower-voltage iso-energetic recombination and higher-voltage multiple-trap limited recombination is also found a 65 mV upward shift for Cell-HMS with the higher trap states density. Based on the experimental results, a detailed scheme is proposed to describe the effect of trap state distribution on charge transport/recombination. This work offers deeper insights into the operating mechanisms of QDSSCs, which can be helpful for further optimization of their photovoltaic performance.Acknowledgements
The authors gratefully acknowledge the financial support from the Natural Science Foundation of China (Grant nos 21133001, 21173266 and 21473250) and the Fundamental Research Funds for the Central Universities, the Research Funds of Renmin University of China (Grant no. 11XNJ021).References
- A. Zaban, O. I. Micic, B. A. Gregg and A. J. Nozik, Langmuir, 1998, 14, 3153 CrossRef CAS.
- P. V. Kamat, J. Phys. Chem. C, 2008, 112, 18737 CAS.
- S. Rühle, M. Shalom and A. Zaban, ChemPhysChem, 2010, 11, 2290 CrossRef PubMed.
- S. Emin, S. P. Singh, L. Han, N. Satoh and A. Islam, Sol. Energy, 2011, 85, 1264 CrossRef CAS PubMed.
- W. A. Tisdale, K. J. Williams, B. A. Timp, D. J. Norris, E. S. Aydil and X.-Y. Zhu, Science, 2010, 328, 1543 CrossRef CAS PubMed.
- J. B. Sambur, T. Novet and B. A. Parkinson, Science, 2010, 330, 63 CrossRef CAS PubMed.
- G. Hodes, J. Phys. Chem. C, 2008, 112, 17778 CAS.
- N. Zhao, T. P. Osedach, L.-Y. Chang, S. M. Geyer, D. Wanger, M. T. Binda, A. C. Arango, M. G. Bawendi and V. Bulovic, ACS Nano, 2010, 4, 3743 CrossRef CAS PubMed.
- P. Sheng, W. Li, J. Cai, X. Wang, X. Tong, Q. Cai and C. A. Grimesb, J. Mater. Chem. A, 2013, 1, 7806 CAS.
- J. Wang, I. Mora-Seró, Z. Pan, K. Zhao, H. Zhang, Y. Feng, G. Yang, X. Zhong and J. Bisquert, J. Am. Chem. Soc., 2013, 135, 15913 CrossRef CAS PubMed.
- W.-T. Sun, Y. Yu and H.-Y. Pan, J. Am. Chem. Soc., 2008, 130, 1124 CrossRef CAS PubMed.
- K. Žídek, K. Zheng, C. S. Ponseca Jr, M. E. Messing, L. R. Wallenberg, P. Chábera, M. Abdellah, V. Sundstrom and T. Pullerits, J. Am. Chem. Soc., 2012, 134, 12110 CrossRef PubMed.
- J. Luo, L. Ma, T. He, C. F. Ng, S. Wang, H. Sun and H. J. Fan, J. Phys. Chem. C, 2012, 116, 11956 CAS.
- P. Yang, T. Deng, D. Zhao, P. Feng, D. Pine, B. F. Chmelka, G. M. Whitesides and G. D. Stucky, Science, 1998, 282, 2244 CrossRef CAS.
- F. Zhu, D. Wu, Q. Li, H. Dong, J. Li, K. Jiang and D. Xu, RSC Adv., 2012, 2, 11629 RSC.
- P. B. Patil, S. S. Mali, V. V. Kondalkar, N. B. Pawar, K. V. Khot, C. K. Hong, P. S. Patilb and P. N. Bhosale, RSC Adv., 2014, 4, 47278 RSC.
- D. Chen, F. Huang, Y.-B. Cheng and R. A. Caruso, Adv. Mater., 2009, 21, 2206 CrossRef CAS.
- W. Chen, Y. Qiu, K. Yan and S. Yang, J. Power Sources, 2011, 196, 10806 CrossRef CAS PubMed.
- H. Han, P. Sudhagar, T. Song, Y. Jeon, I. Mora-Seró, F. Fabregat-Santiago, J. Bisquert, Y. S. Kang and U. Paik, Chem. Commun., 2013, 49, 2810 RSC.
- X.-Y. Yu, J.-Y. Liao, K.-Q. Qiu, D.-B. Kuang and C.-Y. Su, ACS Nano, 2011, 5, 9494 CrossRef CAS PubMed.
- I. Hod, V. Gonzalez-Pedro, Z. Tachan, F. Fabregat-Santiago, I. Mora-Seró, J. Bisquert and A. Zaban, J. Phys. Chem. Lett., 2011, 2, 3032 CrossRef CAS.
- Q. Huang, F. Li, Y. Gong, J. Luo, S. Yang, Y. Luo, D. Li, X. Bai and Q. Meng, J. Phys. Chem. C, 2013, 117, 10965 CAS.
- Q. Yu, Y. Wang, Z. Yi, N. Zu, J. Zhang, M. Zhang and P. Wang, ACS Nano, 2010, 4, 6032 CrossRef CAS PubMed.
- A. C. Fisher, L. M. Peter, E. A. Ponomarev, A. B. Walker and K. G. U. Wijayantha, J. Phys. Chem. B, 2000, 104, 949 CrossRef CAS.
- L. M. Peter and K. G. U. Wijayantha, Electrochem. Commun., 1999, 1, 576 CrossRef CAS.
- J. Bisquert, Phys. Chem. Chem. Phys., 2008, 10, 3175 RSC.
- J. Bisquert, J. Phys. Chem. C, 2007, 111, 17163 CAS.
- J. Bisquert, A. Zaban, M. Greenshtein and I. Mora-Seró, J. Am. Chem. Soc., 2004, 126, 13550 CrossRef CAS PubMed.
- K. Zhu, T. B. Vinzant, N. R. Neale and A. J. Frank, Nano Lett., 2007, 7, 3739 CrossRef CAS PubMed.
- J. Bisquert, F. Fabregat-Santiago, I. Mora-Seró, G. Garcia-Belmonte and S. Gimenez, J. Phys. Chem. C, 2009, 113, 17278 CAS.
- L. Luo, C.-J. Lin, C.-S. Huang, C.-F. Lo, C.-Y. Lin and E. W.-G. Diau, Phys. Chem. Chem. Phys., 2010, 12, 12973 RSC.
- N. W. Duffy, L. M. Peter, R. M. G. Rajapakse and K. G. U. Wijayantha, J. Phys. Chem. B, 2000, 104, 8916 CrossRef CAS.
- Y. Wang, D. Wu, L.-M. Fu, X.-C. Ai, D. Xu and J.-P. Zhang, Phys. Chem. Chem. Phys., 2014, 16, 11626 RSC.
- D. Wu, Y. Wang, H. Dong, F. Zhu, S. Gao, K. Jiang, L. Fu, J. Zhang and D. Xu, Nanoscale, 2013, 5, 324 RSC.
- F. Zhu, P. Zhang, X. Wu, L. Fu, J. Zhang and D. Xu, ChemPhysChem, 2012, 13, 3731 CrossRef CAS PubMed.
- G. Hodes, Phys. Chem. Chem. Phys., 2007, 9, 2181 RSC.
- D. Wu, X. Shi, H. Dong, F. Zhu, K. Jiang, D. Xu, X. Ai and J. Zhang, J. Mater. Chem. A, 2014, 2, 16276 CAS.
- G. Zhu, L. Pan, T. Xu and Z. Sun, ACS Appl. Mater. Interfaces, 2011, 3, 1472 CAS.
- B. C. O' Regan, K. Bakker, J. Kroeze, H. Smit, P. Sommeling and J. R. Durrant, J. Phys. Chem. B, 2006, 110, 17155 CrossRef PubMed.
- J. Yang, L. Pan, G. Zhu, X. Liu, H. Sun and Z. Sun, J. Electroanal. Chem., 2012, 677, 101 CrossRef PubMed.
- J. Bisquert, Phys. Chem. Chem. Phys., 2003, 5, 5360 RSC.
- B. C. O' Regan, S. Scully and A. C. Mayer, J. Phys. Chem. B, 2005, 109, 4616 CrossRef PubMed.
- J. R. Jennings and Q. Wang, J. Phys. Chem. C, 2010, 114, 1715 CAS.
- J. Bisquert and V. S. Vikhrenko, J. Phys. Chem. B, 2004, 108, 2313 CrossRef CAS.
- K. Fan, T. Peng, J. Chen, X. Zhang and R. Li, J. Power Sources, 2013, 222, 38 CrossRef CAS PubMed.
- F. Xu, X. Zhang, Y. Wua, D. Wu, Z. Gao and K. Jiang, J. Alloys Compd., 2013, 574, 227 CrossRef CAS PubMed.
- T. Marinado, K. Nonomura, J. Nissfolk, M. K. Karlsson, D. P. Hagberg, L. Sun, S. Mori and A. Hagfeldt, Langmuir, 2010, 26, 2592 CrossRef CAS PubMed.
- R. Li, X. Lv, D. Shi, D. Zhou, Y. Cheng, G. Zhang and P. Wang, J. Phys. Chem. C, 2009, 113, 7469 CAS.
- D. Wu, J. He, S. Zhang, K. Cao, Z. Gao, F. Xu and K. Jiang, J. Power Sources, 2015, 282, 202 CrossRef CAS PubMed.
| This journal is © The Royal Society of Chemistry 2015 |

