
Plasma enhanced label-free immunoassay for alpha-fetoprotein based on a U-bend fiber-optic LSPR biosensor†
Gaoling Lianga,
Zhongjun Zhaoa,
Yin Weid,
Kunping Liuac,
Wenqian Houd and
Yixiang Duan*b
aCollege of Chemistry, Sichuan University, Chengdu, China
bResearch Center of Analytical Instrumentation, Key Laboratory of Bio-resource and Eco-environment, Ministry of Education, College of Life Science, Sichuan University, Chengdu, China. E-mail: yduan@scu.edu.cn; Fax: +86 28 85418180; Tel: +86 28 85418180
cFaculty of Biotechnology Industry, Chengdu University, Chengdu, China
dAnalytical & Testing Center, Sichuan University, Chengdu, China
First published on 25th February 2015
Abstract
A simple, label-free and cost-effective localized surface plasmon resonance (LSPR) immunosensing method was developed for detection of alpha-fetoprotein (AFP). The U-bend fiber optic probe was firstly pretreated by microwave-induced H2O/Ar plasma to ensure better silanization, which could greatly improve the adsorbed amounts and uniformity of the gold nanoparticles (GNPs) on the fiber optic probe surface. Furthermore, according to the sucrose refractive index (RI) testing result, the absorbance sensitivity to RI change of this sensor was obviously improved due to the plasma pretreatment. Finally, on the basis of this U-bend strategy and plasma pretreated method, the fabricated biosensor displayed good analytical performance for detection of AFP, ranged from 5 to 200 ng mL−1 in both phosphate-buffered saline (PBS) and human serum, with different detection limits of 0.85 and 3.3 ng mL−1 respectively. Therefore, the present strategy definitely paves a way for wider applications of LSPR in clinical research and may eventually become a promising technique for protein detection.
1. Introduction
In recent years, protein detection has attracted increasing attention because of its importance in human health research. Several techniques have been used to detect protein molecules, such as optical, chemical, and immune-based methods, and biosensors have also been developed for protein detection with high sensitivity and selectivity. These biosensors can be classified based on the recognition elements they employ, including enzyme biosensors, cell biosensors, DNA-biosensors, and immunosensors. Immunosensors using antibodies as the biological recognition elements have become more and more popular in the past decades.1–3 In general, conventional biosensors require fluorescent molecules, enzyme substances, or other labels, which are expensive and time-consuming. Therefore, a label-free and low-cost analytical technique is urgently required.Surface plasmon resonance (SPR), which is based on evanescent electromagnetic fields, has been widely used in many affinity biosensing applications.4 In order to support the surface plasmon (SP), the material should possess a negative real and small positive imaginary dielectric constant. Recently, researchers have explored alternative strategies based on noble metal nanoparticles (Au and Ag). The surface plasmon is confined to a nanometer size, which is usually known as localized surface plasmon (LSP). The free electrons of the particles participate in the collective oscillation. Since the plasmon is localized, it is known as LSPR. The resonance phenomenon occurs when the wave vector of the incident light matches to the collective oscillation frequency of the surface electrons of metal nanoparticles. These resonances are associated with noble metal nanoparticles, which exhibit a strong UV-vis absorption band as well as strong electromagnetic enhancement.5–7 Using LSPR in biosensing is of considerable interest recently since the sensitivity of the molecules binding to the sensor surface is increased in LSPR, in other words, the background influence can be decreased significantly.8
AFP is one of the major tumor markers for hepatocellular carcinoma, the normal concentration of AFP in serum is lower than 20 ng mL−1, but its concentration can be over 400 ng mL−1 with the disease.9 Therefore, the early diagnosis of hepatocellular carcinoma can be facilitated by quantitative detection of AFP in human serum. Conventional immunological methods, such as radioimmunoassay (RIA),10,11 enzyme-linked immunosorbent assay (ELISA) and electrochemical immunoassay are usually used for detection of AFP.12–14 Especially the methods of RIA and ELISA, both have advantages of high sensitivity, with the detection limits of AFP down to 0.01 nmol L−1 (ref. 11 and 15) and 0.14 nmol L−1,15 respectively. However, these methods require complicated operating procedures and advanced instruments. Therefore, it is necessary to develop simpler and label-free methods for sensitive and selective detection of AFP.
Some previous studies used SPR for detection of AFP, with the predominantly couplers of prism.9,16–18 In this study, we reported a label-free immunoassay for AFP detection based on plasma enhanced U-bend fiber-optic LSPR biosensor. Modification of the probe geometry was explored to increase the sensitivity of about ten-fold improvement in evanescent wave absorbance since the majority of the traditional fiber optic sensors with straight geometry have low sensitivity.19,20 Moreover, the absorbance sensitivity to RI changes of the straight fiber probe was tested to compare with the sensitivity of U-bend probes in our study. 7-fold and 15-fold improvements in absorbance sensitivity were obtained by the U-bend fiber-optic probes without and with plasma pretreatment, respectively. In case of a U-bend optical fiber is considered, the evanescent electromagnetic field is enhanced, so does the sensitivity of the biosensor.19,21 In a theoretical analysis of the U-bent probe, the sensitivity increase is mainly due to the variation of the angle of incidence. The angle of incidence decreases along with the light rays propagating in the U-bent sensing region. Furthermore, the angle of incidence is related to the penetrating depth, which increases as the incident angle decreases. The bending of the optical fiber results in losing light and increasing the evanescent field, thereby enhancing the sensitivity.19,21–23
In this paper, we demonstrate a label-free LSPR biosensor, which relies on the absorption spectrum of a self-assembled monolayer of colloidal gold on the surface of fiber optics. Since the optical properties of GNPs are sensitive to the refractive index of the surrounding medium, it is crucial to effectively immobilize the GNPs on the fiber surface. The lack of sufficient active groups on the surface of inorganic substrates such as fused silica restricts the quantity of the GNPs on the optical fiber. Therefore, effective methods are needed to generate enough anchoring points on the optical fiber. Herein, a microwave-induced H2O/Ar plasma is introduced in this work for surface pretreatment of the optical fibers and eventually for signal enhancement. To the best of our knowledge, GNPs immobilization with H2O/Ar plasma pretreatment has not been reported previously, and in the meantime, it is the first time that using microwave-induced H2O/Ar plasma for optical fiber pretreatment in LSPR biosensor. Moreover, the plasma pretreatment could ensure better silanization, higher RI sensitivity for greater surface coverage of GNPs.
Furthermore, the monoclonal antibody, an appropriate self-assembled monolayer (SAM), and highly concentrated masking agents were contributed to the specificity and selectivity of the sensor. For detection of AFP in PBS buffer, the current signal is proportional to the concentration of AFP from 5 ng mL−1 to 200 ng mL−1 with a detection limit of 0.85 ng mL−1. The method can also be used to detect AFP in human serum. Moreover, this new system can be extended to detect other target proteins with the corresponding antibodies, and has potential applications in disease diagnose. Although some previous fiber-optic U-shaped SPR sensors were tested with emphasis on optimal design of U-bent probe geometry,22,23 manufacturing chemical sensor for environmental monitoring, or using U-bent fiber-optic SPR technology in biosensing, the target molecules detections in real samples never been explored so far. Compared with other studies, the novel plasma-enhanced sensor in our study shows a promising potential for biomolecule detection in practical applications, thus, this study promoted the development of a unique fiber optic LSPR biosensor.
2. Experimental
2.1. Reagents
Reagents such as thiourea, glutaraldehyde (GA), and the cross-linking agent [3-(aminopropyl) trimethoxysilane, (APTMS), >98%] were obtained from Sigma-Aldrich. PBS and bovine serum albumin (BSA) were purchased from Sheng Gong Biological (Shanghai, China). Mouse anti-human AFP monoclonal antibody, human AFP, human serum albumin (HSA), and human immunoglobulin G (IgG) were obtained from Wanyumeilan Company in Beijing. Deionized (DI) water (18 MΩ, UP Water Purification System) was used in all tests.2.2. Materials and apparatus
Plastic-clad silica (PCS) multimode optic fibers with a core diameter of 600 μm and a numerical aperture (NA) of 0.37, and annular tubes (ADASMAB2) for use as fiber connections, were obtained from Thorlabs. The spectrometer (Ocean Optics USB 2000+) with a 2048-pixels CCD detector was used to respond from 200 to 1100 nm with a resolution of 0.35 nm (FWHM), and a tungsten lamp (Ocean Optics HL-2000) of 20 W was used as the light source. In this study, the microwave plasma device mainly included a copper Surfatron microwave cavity, which is cylinder-shaped with a fused-silica tube (2.0 mm i.d., 6 mm o.d., 200 mm long) centered axially. Ar/H2O discharge gas was fed through the fused-silica tube at a flow rate of 1.45 L min−1, which was measured by a mass flow controller (MFC, D07-19B, Beijing Sevenstar Electronic CO., LTD). The microwave generator (2045 MHz; Yanyou Electronics, Nanjing, China) could produce a maximum power of 150 W, which was connected to the plasma cavity via a coaxial cable.2.3. Synthesis of GNPs
The GNPs were synthesized via the sodium citrate reduction of HAuCl4 according to the method reported in literature.24 All of the glassware were cleaned thoroughly with aqua regia (1![[thin space (1/6-em)]](https://www.rsc.org/images/entities/char_2009.gif) :3 HNO3/HCl) and rinsed adequately with sufficient DI water. The molar ratio of citrate to gold was 1:1. A mixture solution of 149.8 mg of HAuCl4 in 499.3 mL DI water was heated to boiling with vigorous stirring in a four-necked round-bottomed flask with a reflux condenser. Sodium citrate solution (10.7 mL, 1% w/v) was then added rapidly to the flask as soon as the solution boiled. The heating was maintained for another 15 min, when the color of the solution changed from pale yellow to black, and then to brick-red. The solution was allowed to cool to room temperature with continuous stirring. To remove any large aggregates and to obtain uniform-sized nanoparticles, a 0.22 μm filter membrane was used to filter the colloidal solution. The synthesized nanoparticles were characterized using transmission electron microscopy (TEM), where the average size was about 70 nm (Fig. S1, ESI†). Finally, the nanoparticles produced were stored in amber colored laboratory bottles at 4 °C.
:3 HNO3/HCl) and rinsed adequately with sufficient DI water. The molar ratio of citrate to gold was 1:1. A mixture solution of 149.8 mg of HAuCl4 in 499.3 mL DI water was heated to boiling with vigorous stirring in a four-necked round-bottomed flask with a reflux condenser. Sodium citrate solution (10.7 mL, 1% w/v) was then added rapidly to the flask as soon as the solution boiled. The heating was maintained for another 15 min, when the color of the solution changed from pale yellow to black, and then to brick-red. The solution was allowed to cool to room temperature with continuous stirring. To remove any large aggregates and to obtain uniform-sized nanoparticles, a 0.22 μm filter membrane was used to filter the colloidal solution. The synthesized nanoparticles were characterized using transmission electron microscopy (TEM), where the average size was about 70 nm (Fig. S1, ESI†). Finally, the nanoparticles produced were stored in amber colored laboratory bottles at 4 °C.
2.4. Preparation and functionalization of the U-bend probe
First, the multi-mode fiber optic with a core diameter of 600 μm was cut to a length of 40 cm. The core was exposed in the middle of the fiber for a length of 4 cm with both ends of 1 cm. The jacket and the cladding on these sections were removed using a sharp surgical blade. To remove the revealed cladding, 50% HF was applied to the designated portion of the fiber for 10 min. Both ends of the fiber were polished by 5, 1, and 0.3 μm roughness emery papers in that order to enhance the intensity of the transmitted light. Finally, the core area in the middle was fabricated into a U-bend shape with the use of an alcohol blast burner, where the bend radius obtained was 0.35 cm.The layer-by-layer functionalized process was illustrated in this study. To form the self-assembled monolayer of amino-silane on the fiber probe for the GNPs binding, the U-bend probes were treated in a step-by-step process. Briefly, the probes were cleaned by sonication in DI water for 5 min before immersion in 1:1 (v/v) ethanol and concentrated HCl solution for 30 min. Cleaned with DI water and rinsed in ethanol with sonication for 3 min, before drying overnight at 60 °C. The cleaned fiber optic U-bend probes were pretreated by microwave induced plasma for 15 min with a voltage of 8.6 V (112 W), and (2% v/v) H2O/Ar vapor was used as working gas with a flow rate of 1.45 L min−1. Finally, the silanol sites (Si–OH) were generated. After the pre-treatment process mentioned above, the cleaned probes were immersed in an anhydrous ethanol solution with 10% APTMS aminosilane. After 30 min, the probes were rinsed with DI water and ethanol under sonication, respectively. After that, the probes were dried at 120 °C for 2 h, thus the amino-silane molecules were bound to the silanol sites.
2.5. Experimental set-up
As shown in Fig. 1, the testing chamber was cubic with a U-bent groove. It was made of polydimethylsioxane (PDMS). The unclad U-bend fiber optic probe was held in the U-bent chamber and the annular tubes (ADASMAB2) were used as fiber connections to hold the other ends of the probe. The light, from a tungsten lamp (Ocean Optics HL-2000) at wavelengths of 360–2000 nm, was focused through a collimation lens into the U-bend fiber. The reaction liquid was injected into the testing chamber using a peristaltic pump and the light of the response signal was collected by a spectrometer (USB2000+, Ocean Optics). The data were analyzed using Spectrasuite® software. | ||
| Fig. 1 Optical set-up of the fiber optic LSPR biosensor. | ||
3. Results and discussion
3.1. Enhanced GNPs immobilization with plasma pretreatment
In this study, the testing chamber with a U-bent groove was used to incubate the U-bend probes with GNPs. The light intensity was decreased immediately when GNPs were added due to the enhanced light scattering and adsorption in LSPR. Since polar molecules have dipole matrices and electrostatic force among the dipole molecules,25–28 GNPs have negative charges on their surface. On the other hand, the amino functional groups of the amino-silane have positive charges on their surface. Therefore, the negatively charged colloid Au bound to the positively charged amino-silane via electrostatic force. To obtain the normalized absorbance, we calculated the original light intensity data by using the following formula (1),29
 | (1) |
Plasma contained electrons, charged ions, radicals, UV light and so on, which could act on the fused silica and cause an etching effect. The dangling bonds and the charged surface were produced, and the activated surface was provided by the etching effect. In this study, a microwave-induced (2% v/v) H2O/Ar plasma was used to modify the optical fiber surface. The process of optimizing H2O/Ar gas ratio was carried out using microwave induced Ar/H2O plasma with different water vapor components added to the argon stream to pretreat the fiber optic probes, and then measured the absorbance immersed in GNPs for 30 min, as shown in Fig. S3.† The immobilization effects of GNPs were initially increased with the raised water vapor content, and the absorbance reached a minimum value at the water vapor of 2%, and then the pretreatment effect was decreased if the water vapor exceed 2%. Therefore, 2% v/v water vapor to Ar was used throughout our experiment. The enhancement of hydroxyl groups was achieved by adding H2O vapor into Ar. The H2O/Ar gas mixture ratio was optimized (2% v/v) to induce maximal hydroxyl group to the optical fiber surface. Therefore, the density of the silicon hydroxyls could be increased significantly because the generated hydroxyl groups were grafted to dangling bonds on silica surface to form Si–OH.30 Furthermore, better silanization could adsorb more GNPs, thus, the surface-density of the GNPs bound to the U-bend probe was increased. In comparison to the previous published work using acid solutions to generate silanol sites,31,32 the present microwave-induced H2O/Ar plasma pretreatment have at least three obvious advantages, namely, increasing the density of silicon hydroxyls, causing an etching effect resulting dangling bonds, and enhancing hydrophilicity and surface roughness.
Atomic force microscopy (AFM) was used to examine the difference of the surface morphology of GNPs immobilized on the plasma pretreatment optical fiber probe (Fig. 2c) and control groups (Fig. 2a and b). Control group 1 (see Fig. 2a) is the surface morphology of the GNPs coated on the U-bent fiber optic probe without using any effective functionalization method, and the cleaned bare fiber was directly immersed in a GNPs solution without using crosslinkers or plasma pretreatment. Control group 2 (see Fig. 2b) is the surface morphology of the GNPs coated on the U-bent fiber optic probe without plasma pretreatment, but just using acidic solution to generate silanol sites, and then using silanization methodology to immobilize GNPs. By comparing Fig. 2a with Fig. 2c, it was obvious that the microwave-induced H2O/Ar plasma pretreatment not only made the GNPs more evenly distributed, but also increased the amount of the GNPs on the optical fiber surface. Therefore, it was reasonably suggested that the surface modification of the fiber optic probe with H2O/Ar plasma could enhance GNPs immobilization (see Fig. 2b and c).
 | ||
| Fig. 2 AFM images of the GNPs coated U-bend fiber optic probes. (a) Control group 1 without founctionlization method. (b) Control group 2 without plasma pretreatment. (c) H2O/Ar plasma pretreatment group. | ||
3.2. Effect of RI change on sensitivity
The LSPR technology in biosensing was based on RI changes induced by the binding between the target molecules and the biological recognition elements. GNPs, as a sensitive material, were used to transduce the RI changes into spectral absorbance. Therefore, it was necessary to examine the ability of the GNPs modified U-bend fiber optic sensor to RI changes. In theory, the absorbance is raised with surface refractive index increasing.33 In this work, a U-bend probe was used to detect a series of sucrose solutions with a concentration range from 4% to 24%, which corresponded to various RIs.The absorption spectral obtained from the sensor immersed in sucrose solution with RIs from 1.34 RIU to 1.37 RIU is shown in Fig. 3a. The experimental results showed that the absorbance was increased with the higher RI of the sucrose. A significant increase in the absorbance was observed at 590 nm, where the optical signal was measured due to higher sensitivity and lower SNR. There was a linear increase in the maximum absorbance at the fixed wavelength of 590 nm, as shown in Fig. 3b. To better understand the effect of the GNPs on LSPR, the RI sensitivity of the GNPs coated fiber optic probe was examined and compared with that of the bare probe. Sensitivity was defined as the ratio of the change in the absorbance relative to the variation in the RI, which was equal to the slope of the linearity curve, as shown in Fig. 3b. The sensitivity of the GNPs-coated U-bend fiber optic sensor with plasma pretreatment was 20.25 absorbance units (AU)/RIU, which was almost 16 times higher than that of the bare probe with just 1.2 AU/RIU. Simultaneously, the RI sensitivity of the GNPs-coated U-bend fiber optic without plasma pretreatment was also measured with the value of 9.32 (AU)/RIU, which was about half of the sensitivity compared with the plasma modification. These results indicated that the GNPs coated U-bend fiber optic probe with microwave-induced plasma treatment get a higher sensitivity (20.25AU/RIU) and a better linearity (R2 = 0.9989) in response to the changes of bulk RI in the region from 1.34 RIU to 1.37 RIU. Compared with the previous reported LSPR sensor for the detection of RI change, the LSPR sensor developed in this work has a better sensitivity and linearity.34 Furthermore, compared with other plasmonic sensor, the performance of the microwave-induced H2O/Ar plasma enhanced sensor has a better limit of detection (LOD).35,36 LOD, defined as the smallest measurable absolute refractive index,36 is the sensor resolution (LOD = 3 σ/m = 8.05 × 10⁻⁶ RIU). In addition, in order to obtain a better SNR and sensitivity, a higher power (20 W) halogen tungsten light source and a U-bend probe design was also used, The experiment about the comparison of the bending fiber with a straight fiber was also done to evaluate the positive effect in our study (Fig. S4, ESI†). The sensitivity of the straight fiber probes was 1.3 (AU/RIU), which is much less sensitive than the U-bend fiber probe.
 | ||
| Fig. 3 (a) Absorption spectra obtained with different concentrations (w/w) of sucrose solution, which correspond to various refractive indices (RI). (i) 4% → 1.3388, (ii) 8% → 1.3448, (iii) 12% → 1.3509 (iv) 16% → 1.3573, (v) 20% → 1.3639, (vi) 24% → 1.3706; (b) linear curve of the different GNP coated U-bend probes to RI in the range from 1.3388 to 1.3706: a. Plot of absorbance versus refractive index: the points for the GNP coated probe with plasma pretreatment were linearly fitted with a sensitivity of 20.25 (AU)/RIU and R2 = 0.9989, (n = 3), b. GNP coated U-bend probe without plasma pretreatment with a sensitivity of 9.32 (AU)/RIU and R2 = 0.9989, c. The slope of the linear curve of the bare probe was 1.24 (AU)/RIU and R2 = 0.8625, (n = 3). | ||
3.3. Detection of AFP in PBS buffer
For biosensor applications, GNP-coated U-bend fiber-optic probes were used to detect the absorbance changes induced by the binding of bioreceptor–analyte pair. Firstly, U-bend probes were immersed in the GNPs solution, as mentioned earlier, because the negatively-charged colloid Au can bind to the positive amino of the amino-silane via electrostatic adsorption. Next, thiourea was bound on the Au surface via an Au–S coordination bond. The end amine group was reacted with one aldehyde group from GA, thereby forming an aldehyde-activated surface on the opposite side. PBS of pH = 7.4 was injected as the baseline. Then, 20 μg mL−1 of AFP monoclonal antibody protein was immobilized on the functionalized probes via covalent bonds between the amine groups of the protein and the other aldehydes of GA. Thus, specific sensing probes were produced since the antibody covalently attached to the functionalized GNPs through forming C![[double bond, length as m-dash]](https://www.rsc.org/images/entities/char_e001.gif) N.37 The monoclonal antibody was useful for the specificity of the sensor. Subsequently, PBS buffer was injected to wash away unbound AFP antibody and to stabilize the baseline. Prior to the analysis, 10 mg mL−1 BSA was used to block the nonspecific sites of the sensor surface except for the area covered by the antibody. The concentration of the AFP antigen in PBS buffer was varied from a low concentration to a high concentration. Herein, 40 μL solutions injected into the chamber were sufficient to totally immerse the U-bend exposed optical probe portion.
N.37 The monoclonal antibody was useful for the specificity of the sensor. Subsequently, PBS buffer was injected to wash away unbound AFP antibody and to stabilize the baseline. Prior to the analysis, 10 mg mL−1 BSA was used to block the nonspecific sites of the sensor surface except for the area covered by the antibody. The concentration of the AFP antigen in PBS buffer was varied from a low concentration to a high concentration. Herein, 40 μL solutions injected into the chamber were sufficient to totally immerse the U-bend exposed optical probe portion.
A reference spectrum was obtained using PBS buffer solution before the AFP antigen detection in PBS. The absorbance changes, which were induced by the binding between the immobilized AFP antibody and the AFP antigen, were detected by UV-vis absorption spectrum. The different concentrations of antigens produced varied changes in the absorbance, thereby facilitating quantifiable analysis of the AFP antigen.38 Firstly, four solutions with different concentrations of AFP antigen were tested (Fig. S5, ESI†). The changes in the absorbance were linear for the first three concentrations of AFP antigen. However, the absorbance corresponding to the 400 ng mL−1 AFP solution was almost the same as those with the 200 ng mL−1 solution because the binding sites may be saturated.38 In the following experiment, the UV-vis absorption spectra of a series of AFP antigen concentrations including 5 ng mL−1, 50 ng mL−1, 100 ng mL−1, 150 ng mL−1 and 200 ng mL−1 were determined (Fig. 4a). The absorbance changes corresponding to different concentrations of AFP at the maximum absorption wavelength were illustrated in Fig. 4b. The concentrations of AFP (from 5 ng mL−1 to 200 ng mL−1) in PBS and their absorbance exhibit a good linear relationship (R2 = 0.99). Thus, LOD is determined according to the equation LOD = 3 (SD/S) and the limit of quantification (LOQ) by the equation LOQ = 10 (SD/S), where SD is the standard deviation of the signal value based on six replicated analyses and S is the sensitivity. The LOD and LOQ of the AFP detection method were 0.85 ng mL−1 and 2.8 ng mL−1, respectively, which are lower than those reported 0.04 nM and 0.14 nM, for AFP detection in PBS using plasmonic nanosensing based on aggregation of GNRs.9
 | ||
| Fig. 4 (a) UV-Vis absorption spectra of the AFP antigen in PBS, where the concentrations were 5 ng mL−1, 50 ng mL−1, 100 ng mL−1, 150 ng mL−1, and 200 ng mL−1 in that order. (b) Calibration curve of the absorbance, which correspond to the AFP antigen concentrations (the error bars represented the standard deviations from the mean, n = 6). | ||
To better illustrate the effectiveness of microwave-induced H2O/Ar plasma pretreatment, calibration curves (Fig. 5) were constructed for a range of concentrations using AFP antigen in PBS buffer. Fig. 5b shows the plasma pretreatment group, while Fig. 5a shows a control group where the optical fiber probe was not pretreated with plasma. The sensitivity of the sensor was defined as the slope of the calibration curves with the best fit. The sensitivity of the plasma pretreatment group is about 1.95 times higher than that of the control group. The plasma pretreatment can provide improvement in the sensor sensitivity.
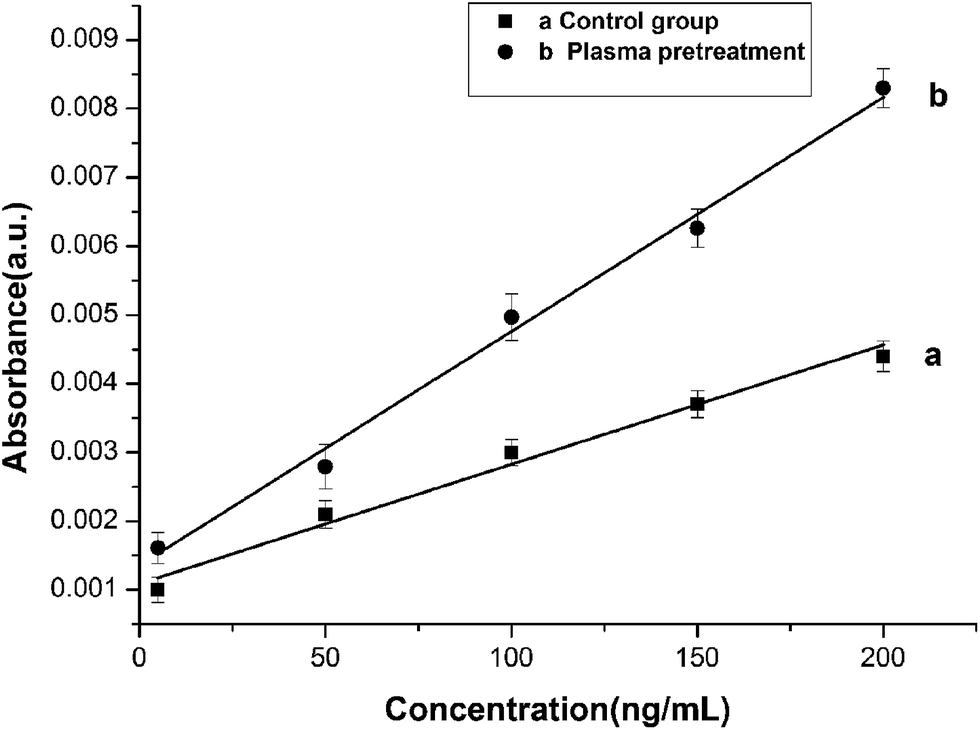 | ||
| Fig. 5 Sensitive response of AFP for plasma pretreatment group and control group with error bars (n = 5), the absorbance signal corresponding to the concentrations of AFP (5 ng mL−1, 50 ng mL−1, 100 ng mL−1, 150 ng mL−1 and 200 ng mL−1). | ||
Dynamic response of the proposed biosensor was examined in this study. The real-time response corresponding to 50 ng mL−1 AFP antigen in PBS and control group of the baseline in PBS blank solution were illustrated (Fig. S6, ESI†). As shown in Fig. S6,† for 50 ng mL−1 AFP antigen, the absorbance increased drastically firstly and then stayed almost constant for about 30 min. Thus, the optical signal reflected a result of the binding between the AFP antigen and the AFP antibody.
3.4. The specificity of the LSPR biosensor
To investigate the potential interference effect, the immobilized monoclonal AFP antibody (20 μg mL−1) probe was immersed in two nonspecific proteins (HSA, and human IgG), herein, HSA is a common protein in human serum with a similar molecular weight with AFP, 66 kDa, while Human IgG, is another major protein in human serum, HSA and IgG, with both physical and chemical characteristics similar to AFP. At first, the target and the interference proteins with the same concentration in PBS were detected (100 ng mL−1 AFP, 100 ng mL−1 HSA, 100 ng mL−1 IgG). The absorbance changes attributable to the binding of the AFP-anti AFP were significant, whereas the probe responded slightly to the other two nonspecific proteins (HSA and IgG) (Fig. 6). The absorbance response of the target proteins was about six times higher than those of the nonspecific proteins. Moreover, LSPR biosensor was also used to analyze a mixed solution obtained by adding 400 ng mL−1 HSA and 400 ng mL−1 IgG solutions into a solution of 100 ng mL−1 AFP. The signal was increased slightly in the mixed solutions compared with the response of the 100 ng mL−1 AFP in PBS buffer. There were increases in the absorbance signal in the presence of HSA and IgG proteins separately, approximately 1.8% and 5.2% increases in the signal amplitude compared with the original signal, respectively. In our experiments, the U-bend LSPR biosensor exhibited good specificity and a strong anti-interference capacity when using high concentrations of BSA (10 mg mL−1), which provided sufficient protein to block the nonspecific sites of the sensor surface. The specificity of the binding between the monoclonal antibody and the target antigen was another important reason. | ||
| Fig. 6 Specificity of the LSPR biosensor for AFP (100 ng mL−1), and against other proteins: HSA (100 ng mL−1), IgG (100 ng mL−1), and interference effects of HSA and IgG (400 ng mL−1) in 100 ng mL−1 AFP solution (the error bars represented the standard deviation, n = 3). | ||
3.5. Detection of AFP in human serum
It was expected that the label-free biosensor technique could be suitable for detection of tumor markers in human serum. In this study, direct detection of real serum samples with the proposed fiber optic LSPR was explored. Due to the difference between the PBS RI and the real serum RI, it is necessary to do the standard curves in real serum for detection of AFP in practical samples. Serum samples were prepared by adding certain amounts of AFP to undiluted human serum (5–200 ng mL−1). The signal of the absorbance was measured by comparing the light intensity of the sensor immersed in human serum to the light intensity of the sensor immersed in AFP-spiked serum samples with a concentration of 5–200 ng mL−1. Fig. 7a shows the absorbance response versus the concentrations of AFP in undiluted human serum. Fig. 7b illustrated the normalized absorbance is proportional to the concentrations of the target AFP with a linear relationship over the range of 5–200 ng mL−1 with a LOD = 3(SD/S) of 3.3 ng mL−1, which is comparable to other SPR biosensors for the detection of AFP in human serum.39,40 To demonstrate the comparison of the results obtained from other methods for detection AFP, a brief summary is shown in Table 1 (ESI†). Furthermore, compared with other conventional assays, such as RIA, ELISA, fluoroimunoassay and electrochemical immunoassay,10,12 the proposed sensor has significant advantages such as simple detection scheme, cost-effective, and label-free biomarker detection. Therefore, the fiber optic LSPR immunosensor can successfully detect AFP concentrations as low as ng mL−1 range in human serum, which may be used to the early diagnosis of hepatocellular carcinoma. | ||
| Fig. 7 (a) Absorbance responses generated by the LSPR biosensor with different concentrations of AFP in human serum with the wavelength range of 500–700 nm. (b) Linear relationship between the AFP concentrations (from bottom to top: 5, 20, 40, 60, 100, 150, 200 ng mL−1) in undiluted human serum versus the absorbance (with the error bars represented the standard deviation from the mean, n = 6). | ||
3.6. Comparative analysis of AFP levels in serum samples obtained by the proposed method and ELISA method
To demonstrate the accuracy of the U-bend fiber optic LSPR sensor, seven human serum samples collected from Wanyumeilan Company in Beijing were analyzed using the plasma enhanced U-bend fiber optic LSPR biosensor with reference to ELISA method. Correlation between ELISA and our assay is shown in Fig. 8 with a correlation coefficient of 0.9873 from the linear regression analysis. These results suggest the feasibility of the developed strategy for real sample assay.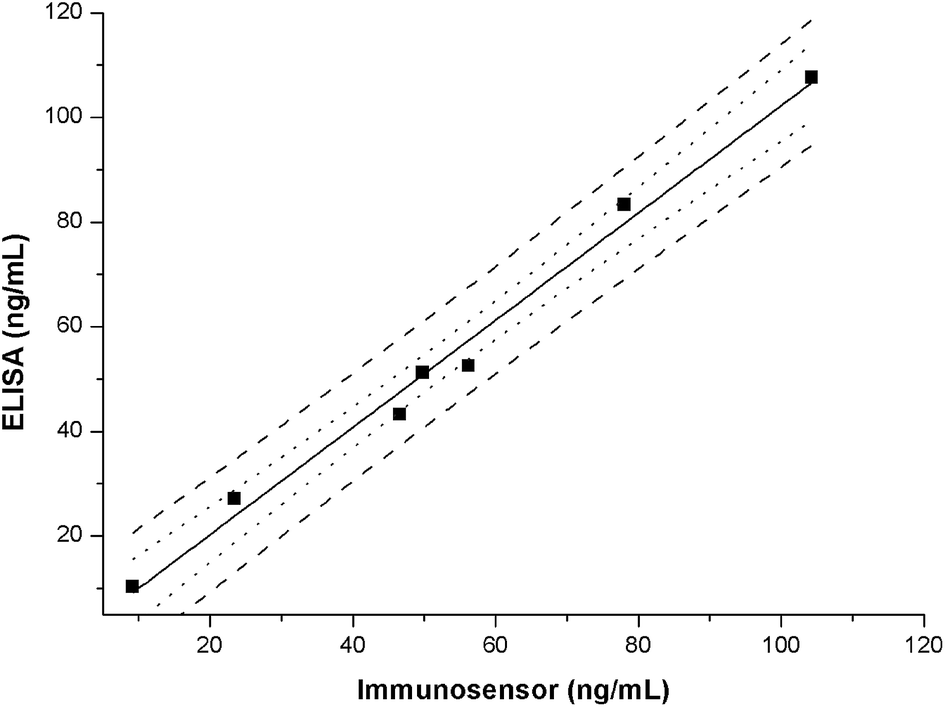 | ||
| Fig. 8 Correlation between ELISA and our plasma-enhanced fiber optic immunosensor assay results for AFP detection in human serum. Best-fit line (solid), the 95% confidence interval (dot) and 95% prediction interval (dash) are presented. | ||
4. Conclusions
In this study, a fiber optic AFP immunosensor was developed based on a modified GNPs-coated U-bend optical fiber probe with microwave-induced H2O/Ar plasma pretreatment. Compared with straight probe, the use of U-bend geometry probe design obviously enhanced the sensitivity of the evanescent-field absorption. The plasma pretreatment was also used to enhance the GNPs immobilization, in the meantime, a higher surface coverage of the GNPs elicited the better RI sensitivity. For AFP detection, the LOD in PBS or human serum is comparable to that obtained with conventional assays. Furthermore, the specificity of the AFP immunosensor was tested, where the main interfering proteins (HSA and human IgG) in the sample had negligible effects on the experimental results. Potentially, the fiber optic LSPR biosensing technology could be used in practical applications for detecting the AFP concentrations as low as a few ng mL−1 in complex samples, or for detection of other tumor markers. Therefore, the fabricated sensor has great potential for in vivo sensing biomolecules to facilitate the real application of the label-free biosensor.Acknowledgements
The authors acknowledge funding provided by the National Natural Science Foundation of China: Investigation of Fast Pathogen Detection Based on Novel Macroporous Chips Technology (no. 21275105), National Recruitment Program of Global Experts (NRPGE) and the Hundred Talents Program of Sichuan Province (HTPSP), and the Startup Funding of Sichuan University for setting up the Research Center of Analytical Instrumentation. We also thank Qiaoling Yu, Yang Li, Guanghui Niu, Jianxiong Dai, Xin Yuan, for their assistances during the experimental work.References
- D. R. Shankaran, K. V. Gobi and N. Miura, Sens. Actuators, B, 2007, 121, 158–177 CrossRef CAS PubMed.
- W. M. Mullett, E. P. C. Lai and J. M. Yeung, Methods, 2000, 22, 77–91 CrossRef CAS PubMed.
- S. J. Kim, K. V. Gobi, R. Harada, D. R. Shankaran and N. Miura, Sens. Actuators, B, 2006, 115, 349–356 CrossRef CAS PubMed.
- A. J. Haes and R. P. Van Duyne, J. Am. Chem. Soc., 2002, 124, 10596–10604 CrossRef CAS PubMed.
- J. Homola, Sens. Actuators, B, 1995, 29, 401–405 CrossRef CAS.
- J. Homola and M. Piliarik, in Surface plasmon resonance based sensors, Springer, 2006, pp. 45–67 Search PubMed.
- J. Homola, Chem. Rev., 2008, 108, 462 CrossRef CAS PubMed.
- J. A. Ruemmele, W. P. Hall, L. K. Ruvuna and R. P. Van Duyne, Anal. Chem., 2013, 126, 6100–6103 Search PubMed.
- X. Xu, Y. Ying and Y. Li, Sens. Actuators, B, 2012, 175, 194–200 CrossRef CAS PubMed.
- L. M. Ao, F. Gao, B. Pan, R. He and D. Cui, Anal. Chem., 2006, 78, 1104–1106 CrossRef CAS PubMed.
- L. Chuang, J.-Y. Hwang, H.-C. Chang, F.-M. Chang and S.-B. Jong, Clin. Chim. Acta, 2004, 348, 87–93 CrossRef CAS PubMed.
- J. Lin and H. Ju, Biosens. Bioelectron., 2005, 20, 1461–1470 CrossRef CAS PubMed.
- X. Liu, H. Wu, Y. Zheng, Z. Wu, J. Jiang and G. Shen, et al., Electroanalysis, 2010, 22, 244–250 CrossRef CAS.
- W.-C. Tsai and I. C. Lin, Sens. Actuators, B, 2005, 106, 455–460 CrossRef CAS PubMed.
- C. Yun-Xiang, Q. Yang, C. Wen-Bao and L. Yuan-Zong, Anal. Chim. Acta, 1995, 300, 273–276 CrossRef.
- X. Xu, Y. Ying and Y. Li, Procedia Eng., 2011, 25, 67–70 CrossRef CAS PubMed.
- Y. Teramura and H. Iwata, Anal. Biochem., 2007, 365, 201–207 CrossRef CAS PubMed.
- R.-P. Liang, G.-H. Yao, L.-X. Fan and J.-D. Qiu, Anal. Chim. Acta, 2012, 737, 22–28 CrossRef CAS PubMed.
- S. Khijwania and B. Gupta, Opt. Commun., 2000, 175, 135–137 CrossRef CAS.
- R. K. Verma, A. K. Sharma and B. D. Gupta, IEEE Photonics Technol. Lett., 2007, 19, 1786–1788 CrossRef.
- R. Verma and B. Gupta, J. Phys. D: Appl. Phys., 2008, 41, 095106 CrossRef.
- R. Bharadwaj and S. Mukherji, Sens. Actuators, B, 2014, 192, 804–811 CrossRef CAS PubMed.
- V. Sai, T. Kundu and S. Mukherji, Biosens. Bioelectron., 2009, 24, 2804–2809 CrossRef CAS PubMed.
- G. Frens, Nature, 1973, 241, 20–22 CAS.
- Q. Zhang, C. Y. Xue, Y. L. Yuan, J. Lee, D. Sun and J. J. Xiong, Sensors, 2012, 12, 2729–2741 CrossRef CAS PubMed.
- S. K. Srivastava, V. Arora, S. Sapra and B. D. Gupta, Plasmonics, 2012, 1–8 Search PubMed.
- H.-H. Jeong, N. Erdene, J.-H. Park, D.-H. Jeong, H.-Y. Lee and S.-K. Lee, Biosens. Bioelectron., 2013, 39, 346–351 CrossRef CAS PubMed.
- H. H. Jeong, Y. J. Son, S. K. Kang, H. J. Kim, H. J. Roh and N. Erdene, et al., IEEE Sens. J., 2013, 13, 351–358 CrossRef CAS.
- Z. Zhao and Y. Duan, Sens. Actuators, B, 2011, 160, 1340–1345 CrossRef CAS PubMed.
- Q. Yu, X. Zhan, K. Liu, H. Lv and Y. Duan, Anal. Chem., 2013, 85, 4578–4585 CrossRef CAS PubMed.
- S.-F. Cheng and L.-K. Chau, Anal. Chem., 2003, 75, 16–21 CrossRef CAS.
- N. Nath and A. Chilkoti, Anal. Chem., 2002, 74, 504–509 CrossRef CAS.
- J.-P. Conzen, J. Bürck and H.-J. Ache, Appl. Spectrosc., 1993, 47, 753–763 CrossRef CAS.
- H. H. Jeong, N. Erdene, S. K. Lee, D. H. Jeong and J. H. Park, Opt. Eng., 2011, 50, 124405–124408 CrossRef PubMed.
- C.-H. Chen, T.-C. Tsao, W.-Y. Li, W.-C. Shen, C.-W. Cheng and J.-L. Tang, et al., Microsyst. Technol., 2010, 16, 1207–1214 CrossRef CAS.
- Z. Q. Tou, C. C. Chan, W. C. Wong and L. H. Chen, IEEE Photonics Technol. Lett., 2013, 25, 556–559 CrossRef CAS.
- Y. Sun, Y. Bai, D. Song, X. Li, L. Wang and H. Zhang, Biosens. Bioelectron., 2007, 23, 473–478 CrossRef CAS PubMed.
- N. Bi, Y. Sun, Y. Tian, D. Song, L. Wang, J. Wang and H. Zhang, Spectrochim. Acta, Part A, 2010, 75, 1163–1167 CrossRef PubMed.
- K. Li, G. Liu, Y. Wu, P. Hao, W. Zhou and Z. Zhang, Talanta, 2014, 120, 419–424 CrossRef CAS PubMed.
- Y.-F. Chang, R.-C. Chen, Y.-J. Lee, S.-C. Chao, L.-C. Su and Y.-C. Li, et al., Biosens. Bioelectron., 2009, 24, 1610–1614 CrossRef CAS PubMed.
Footnote |
| † Electronic supplementary information (ESI) available. See DOI: 10.1039/c5ra02910d |
| This journal is © The Royal Society of Chemistry 2015 |