Photoageing of cardanol: characterization, circumvention by side chain methoxylation and application for photocrosslinkable polymers†
T. Fouquet*,
L. Fetzer*,
G. Mertz,
L. Puchot and
P. Verge
Luxembourg Institute of Science and Technology (LIST), 5 Avenue des Hauts-Fourneaux, 4362 Esch/Alzette, Luxembourg. E-mail: thierry.fouquet83@gmail.com; ludivine.fetzer@list.lu
First published on 16th June 2015
Abstract
The photosensitivity of cardanol has been evaluated using a multi-technique approach. Among other techniques, size exclusion chromatography, matrix assisted laser desorption ionization mass spectrometry and their off line coupling provided useful details on the macroscopically observed yellowing and insolubility of cardanol under UV activation by analyzing photoproducts at the molecular level. Evidencing the implication of the unsaturations borne by the cardanol side chain in a crosslinking process, an original synthesis route leading to its complete methoxylation has been proposed as a way to lower the photosensitivity of cardanol. Using a similar set of analytical techniques, this newly synthesized methoxylated cardanol has appeared more resistant towards UV exposure, without any crosslinking but a simple dimerization preserving its solubility. As a direct application, copolymers made from methyl methacrylate, cardanol and methoxylated cardanol have been synthesized, and their photocrosslinking ability was found to depend on the content of the two latter co-monomers, as a preliminary step towards the production of photocrosslinkable bio-based polymers with a tunable UV curing propensity.
Introduction
Cashew nutshell liquid (CNSL)1 is an abundant annually renewable agricultural non-food by-product extracted from the honeycomb structure of cashew nutshells and forms the basic raw material for a vast number of industrially important chemicals and chemical intermediates,2 such as antioxidants3 or plasticizers.4 A thermal treatment of CNSL permits the production of cardanol, a phenol derivative bearing a C15 polyunsaturated side chain in the meta position,5 at industrial scale. Cardanol is actually composed of four components – namely tri-, di-, mono-unsaturated congeners and the saturated constituent (ESI† for their structures). This intrinsically reactive alkyl chain constitutes an interesting platform for chemical modifications and functionalizations.6,7 For instance, cardanol-grafted rubbers have been produced by its chemical grafting through the C15 side chain.8,9 From a structural point of view, a generic poly(butadiene) PB (unsaturations spaced by –CH2–CH2–, ESI†) could roughly mimic the feature of the side chain of cardanol (unsaturations spaced by –CH2–). PB is notoriously sensitive to photoageing under either natural or accelerated UV irradiation10,11 through the abstraction of the hydrogen atoms in alpha position of the unsaturations, followed by oxidative processes ultimately leading to oligomerization and chain scission. The oligomerization route is of prime importance: taking the opposite view from photoageing, one could consider PB as a photocrosslinkable substrate under mild UV activation, i.e. a property rather than a deleterious drawback. Similarly, and with a probably greater propensity to react owing to the vicinity of the double bonds, cardanol could thus be seen as a photocrosslinkable renewable chemical. Suresh et al. have shown that a copolymer made of methyl methacrylate (MMA) and acrylated cardanol could be of interest to produce photocrosslinkable thin layers used as adhesives or inks.12 A thorough understanding of the processes behind the expected photopolymerization of cardanol would be valuable to properly design photocrosslinkable chemicals or polymers. In addition, finding a way to limit such photo-crosslinking would allow a fine tuning of the photosensitivity of the resulting materials, broadening the scope of applications. This article thus offers a first exploration of the behavior of cardanol under UV irradiation, using a multi-technique analytical strategy combining Fourier transform infrared spectroscopy (FTIR), UV/Vis spectroscopy, size exclusion chromatography (SEC) and its coupling with mass spectrometry (MS) to gain more and more insights into the nature of the photoproducts issued from cardanol. A chemical modification of its side chain – namely methoxylation – will then be proposed as a way to circumvent an early photocrosslinking of cardanol by eliminating the reactive C![[double bond, length as m-dash]](https://www.rsc.org/images/entities/char_e001.gif) C functions. A similar set of analytical tools will be deployed to properly characterize this newly synthesized cardanol derivative and evaluate the reduction of its photosensitivity. Finally, a direct application will be proposed through the synthesis of MMA/cardanol copolymer (similarly to those proposed by Suresh et al.12), MMA/methoxylated cardanol copolymer and MMA/cardanol/methoxylated cardanol terpolymer, and the evaluation of their photocrosslinking propensity, found to depend on the co-monomeric composition in accordance with the photosensitivity of the constituting cardanol-based monomers.
C functions. A similar set of analytical tools will be deployed to properly characterize this newly synthesized cardanol derivative and evaluate the reduction of its photosensitivity. Finally, a direct application will be proposed through the synthesis of MMA/cardanol copolymer (similarly to those proposed by Suresh et al.12), MMA/methoxylated cardanol copolymer and MMA/cardanol/methoxylated cardanol terpolymer, and the evaluation of their photocrosslinking propensity, found to depend on the co-monomeric composition in accordance with the photosensitivity of the constituting cardanol-based monomers.
Experimental
Synthesis procedures
![[double bond, length as m-dash]](https://www.rsc.org/images/entities/char_e001.gif) CH2/CH
CH2/CH![[double bond, length as m-dash]](https://www.rsc.org/images/entities/char_e001.gif) /CH2
/CH2![[double bond, length as m-dash]](https://www.rsc.org/images/entities/char_e001.gif) CH), 4.35–3.54 (m, CH2O), 3.62 (m, CH3–O–C(O)–), 2.80 (m, CH
CH), 4.35–3.54 (m, CH2O), 3.62 (m, CH3–O–C(O)–), 2.80 (m, CH![[double bond, length as m-dash]](https://www.rsc.org/images/entities/char_e001.gif) CH–CH2–CH
CH–CH2–CH![[double bond, length as m-dash]](https://www.rsc.org/images/entities/char_e001.gif) CH), 2.57 (m, CH2–Ar), 2.06–0.84 (m, CH2–CH
CH), 2.57 (m, CH2–Ar), 2.06–0.84 (m, CH2–CH![[double bond, length as m-dash]](https://www.rsc.org/images/entities/char_e001.gif) , CH2–CH2–Ar, (CH2)n, CH3) (Fig. 7a).
, CH2–CH2–Ar, (CH2)n, CH3) (Fig. 7a).![[double bond, length as m-dash]](https://www.rsc.org/images/entities/char_e001.gif) , th), 4.34 (m, CH2O), 3.62 (m, CH3–O–C(O)–), 3.43 (m, CH3O), 2.57 (m, CH2–Ar), 2.06–0.84 (m, CH2–CH
, th), 4.34 (m, CH2O), 3.62 (m, CH3–O–C(O)–), 3.43 (m, CH3O), 2.57 (m, CH2–Ar), 2.06–0.84 (m, CH2–CH![[double bond, length as m-dash]](https://www.rsc.org/images/entities/char_e001.gif) , CH2–CH2–Ar, (CH2)n, CH3) (Fig. 7c).
, CH2–CH2–Ar, (CH2)n, CH3) (Fig. 7c).Photoageing and photopolymerization
Samples were exposed to UV-visible irradiation by means of a Suntest CPS+ system (Rycobel, Deerlijk, Belgium) at 35 °C in presence of oxygen.10 The device is equipped with a xenon lamp for irradiation at wavelengths longer than 290 nm. A black panel controls the irradiance at 400 W m−2. For cardanol and methoxylated cardanol, 50 μL of pure chemical have been deposited on a glass slide (∼20 mm × 20 mm), gently rotated at 500 rpm to form a homogeneous film further submitted to photo-polymerization. The thickness has been evaluated by means of a Nanoscratch tester from CSM Instruments (Peseux, Switzerland) at 100 μm for cardanol after 96 h of UV exposure. For polymers, 500 μL of a polymer solution in THF (20 mg mL−1) have been deposited on a glass slide (20 mm × 20 mm) and allowed to air dry. The thickness measured by Nanoscratch has been found around 6 μm for each sample. Aiming at providing results about the chemical and molecular changes undergone by cardanol and derivatives under UV activation by implementing a complete analytical strategy, kinetics of photocrosslinking and thicknesses considerations are out of the scope of the following discussion. Consequently, exposure times are indicative and a unique UV-exposed sample will be presented in each section, considered as sufficiently representative of the underlying processes behind the UV exposure.Characterizations
![[thin space (1/6-em)]](https://www.rsc.org/images/entities/char_2009.gif) 000, 3700 and 2000 g mol−1 (Sigma Aldrich) were used as calibrants to estimate the MW of the samples. In SEC-MS coupling, collected fractions were allowed to evaporate for a couple of minutes and the residual solution submitted to mass analysis. In SEC-UV/Vis coupling, collected fractions were directly submitted to a UV/Vis analysis with THF used in the SEC elution as blank.
000, 3700 and 2000 g mol−1 (Sigma Aldrich) were used as calibrants to estimate the MW of the samples. In SEC-MS coupling, collected fractions were allowed to evaporate for a couple of minutes and the residual solution submitted to mass analysis. In SEC-UV/Vis coupling, collected fractions were directly submitted to a UV/Vis analysis with THF used in the SEC elution as blank.![[thin space (1/6-em)]](https://www.rsc.org/images/entities/char_2009.gif) 15 were used for data processing. In matrix assisted laser desorption ionization mass spectrometry in the positive ion mode (MALDI(+)-MS), samples were mixed with grains of matrix (trans-2-[3-(4-tert-butylphenyl)-2-methyl-2-propenylidene]malononitrile DCTB, Sigma-Aldrich) and salt (LiTFA or AgTFA, Sigma-Aldrich), gently ground using mortar/pestle, the resulting powder further deposited onto the target and pressed gently with a small spatula to produce a homogeneous thin coverage (solvent-free sample preparation16,17). In surface assisted laser desorption ionization mass spectrometry in the negative mode (SALDI(−)-MS), samples were dissolved in THF and mixed with a suspension of carbon nanofibers GANF (Grupo Antolin, Spain) in acetone, the mixture deposited on the target and allowed to air dry before the mass analysis.
15 were used for data processing. In matrix assisted laser desorption ionization mass spectrometry in the positive ion mode (MALDI(+)-MS), samples were mixed with grains of matrix (trans-2-[3-(4-tert-butylphenyl)-2-methyl-2-propenylidene]malononitrile DCTB, Sigma-Aldrich) and salt (LiTFA or AgTFA, Sigma-Aldrich), gently ground using mortar/pestle, the resulting powder further deposited onto the target and pressed gently with a small spatula to produce a homogeneous thin coverage (solvent-free sample preparation16,17). In surface assisted laser desorption ionization mass spectrometry in the negative mode (SALDI(−)-MS), samples were dissolved in THF and mixed with a suspension of carbon nanofibers GANF (Grupo Antolin, Spain) in acetone, the mixture deposited on the target and allowed to air dry before the mass analysis.Results and discussion
Highlighting the photosensitivity of cardanol by FTIR and SEC
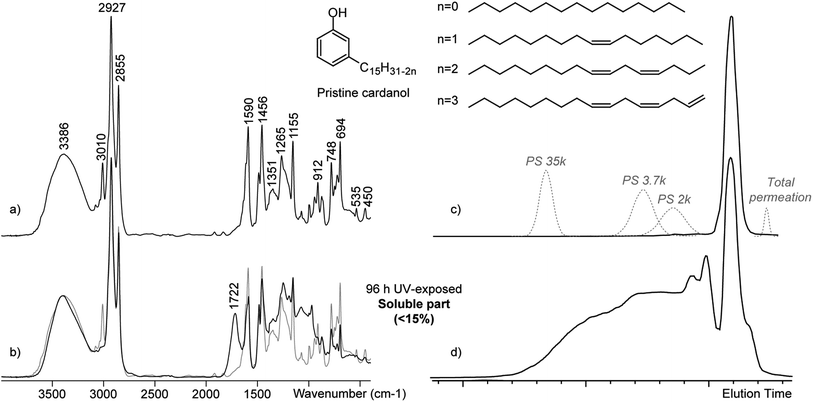
Despite its expected propensity for photopolymerization owing to its structural feature, and to the best of our knowledge, the behavior of cardanol under UV exposure has not been reported in the literature. Pristine cardanol has been deposited as a thick film on a glass substrate (evaluated at a hundred microns at the end of a 96 h irradiation). After 48 h of exposure to UV irradiation, the light yellow liquid of low viscosity turned into a 50% insoluble highly viscous liquid and a 85% insoluble wax was obtained after 96 h, exhibiting a dark yellow color (ESI†), confirming that cardanol is highly photosensitive and undoubtedly undergoes crosslinking. Its UV/Vis absorption spectrum is also found to noticeably change, with a shouldering of the absorbance towards longer wavelengths (ESI†) from which the yellowing phenomenon is originating. FTIR spectra of pristine and 96 h UV-exposed cardanol are depicted in Fig. 1a and b, the former being superimposed in light grey line on Fig. 1b for sake of easier comparison. Among other changes, the appearance of a carbonyl band at 1722 cm−1 is typical of polymer photoproducts under (accelerated) ageing through light exposure. The decrease – rather than disappearance – of bands at 3011 cm−1, 1590 cm−1 and 748 cm−1 (C![[double bond, length as m-dash]](https://www.rsc.org/images/entities/char_e001.gif) C from alkenes)18,19 denotes a substantial consumption of the unsaturations borne by the cardanol side chain.
C from alkenes)18,19 denotes a substantial consumption of the unsaturations borne by the cardanol side chain.
Cardanol and even more its associated UV-exposed counterpart are formed of several components. The increase of viscosity and the decrease of solubility undoubtedly reveal underlying polymerization and cross-linking processes. With such a complex sample, additional analytical techniques should be proposed to comprehend these polymerization processes, beyond the chemical insights provided by FTIR. SEC appears as a well-suited analytical tool to highlight any changes in the MW, themselves pointing out the polymerization processes. The SEC chromatograms of pristine cardanol and the soluble part (∼15%) of the 96 h UV-exposed cardanol are depicted in Fig. 1c and d respectively, recorded with a UV detector set at 280 nm![[thin space (1/6-em)]](https://www.rsc.org/images/entities/char_2009.gif) 9 (a local UV absorption maximum of pristine cardanol, ESI†). As compared to the chromatogram of pristine cardanol exhibiting a unique fine “monomer” peak, the occurrence of high MW materials after UV exposure is readily found with a strong signal towards the shortest elution times. Contributions from “dimers” and “trimers” are clearly separated from the “monomer” peak while the largest oligomers constitute a shouldering with no resolution. Those arbitrary assignments will be further validated by a SEC-MALDI(+)-MS coupling. Such polymerization process found in the (limited) soluble part of the photopolymerized sample should be extrapolated into crosslinking processes to account for the main insoluble part. With PB as a reference, these processes probably occur through the abstraction of the reactive hydrogen(s) in alpha position of the unsaturations borne by the C15 side chain, forming radical species prone to enter into polymerization through C–O–C or C–C linkages with other unsaturated congeners.10,20 Similar observations have been reported for the photoageing of vegetable oils.21 As a short digression and still following the PB reference behavior, a small shouldering towards the longer elution times compared to the “monomer” peak is also observed, pointing out some cleavage processes accompanying the polymerization route leading to short structures bearing either the phenol moiety or a part of the side chain (not seen with a UV detector).10 Superimposed on Fig. 1c is the SEC chromatogram of the co-elution of three PS standards (MW 35
9 (a local UV absorption maximum of pristine cardanol, ESI†). As compared to the chromatogram of pristine cardanol exhibiting a unique fine “monomer” peak, the occurrence of high MW materials after UV exposure is readily found with a strong signal towards the shortest elution times. Contributions from “dimers” and “trimers” are clearly separated from the “monomer” peak while the largest oligomers constitute a shouldering with no resolution. Those arbitrary assignments will be further validated by a SEC-MALDI(+)-MS coupling. Such polymerization process found in the (limited) soluble part of the photopolymerized sample should be extrapolated into crosslinking processes to account for the main insoluble part. With PB as a reference, these processes probably occur through the abstraction of the reactive hydrogen(s) in alpha position of the unsaturations borne by the C15 side chain, forming radical species prone to enter into polymerization through C–O–C or C–C linkages with other unsaturated congeners.10,20 Similar observations have been reported for the photoageing of vegetable oils.21 As a short digression and still following the PB reference behavior, a small shouldering towards the longer elution times compared to the “monomer” peak is also observed, pointing out some cleavage processes accompanying the polymerization route leading to short structures bearing either the phenol moiety or a part of the side chain (not seen with a UV detector).10 Superimposed on Fig. 1c is the SEC chromatogram of the co-elution of three PS standards (MW 35![[thin space (1/6-em)]](https://www.rsc.org/images/entities/char_2009.gif) 000, 3700 and 2000 g mol−1) and detected in that order of elution (grey line, recorded at λ = 254 nm). MW of the soluble photoproducts from the 96 h UV-exposed cardanol thus ranges from a few hundred g mol−1 (smallest photo products near the total permeation peak) to more than 30
000, 3700 and 2000 g mol−1) and detected in that order of elution (grey line, recorded at λ = 254 nm). MW of the soluble photoproducts from the 96 h UV-exposed cardanol thus ranges from a few hundred g mol−1 (smallest photo products near the total permeation peak) to more than 30![[thin space (1/6-em)]](https://www.rsc.org/images/entities/char_2009.gif) 000 g mol−1 PS equivalent. These largest products correspond to the coupling of around ten cardanol moieties. To better understand the polymerization processes behind this increase of MW, mass spectrometry has been used and the results reported in the following section. Mass spectrometry has indeed been recently proposed as a powerful tool for the analysis of cardanol and cardanol derivatives.22,23 In particular, MALDI(+)-MS24 and its emphasis on the so-called “unsaturation pattern” arising from the tri-, di-, mono-unsaturated and saturated components composing cardanol has allowed thorough insights into the chemistry of cardanol to be gained.25
000 g mol−1 PS equivalent. These largest products correspond to the coupling of around ten cardanol moieties. To better understand the polymerization processes behind this increase of MW, mass spectrometry has been used and the results reported in the following section. Mass spectrometry has indeed been recently proposed as a powerful tool for the analysis of cardanol and cardanol derivatives.22,23 In particular, MALDI(+)-MS24 and its emphasis on the so-called “unsaturation pattern” arising from the tri-, di-, mono-unsaturated and saturated components composing cardanol has allowed thorough insights into the chemistry of cardanol to be gained.25
Mass spectrometry and off-line SEC-MS coupling: the implication of the side chain in cardanol photosensitivity
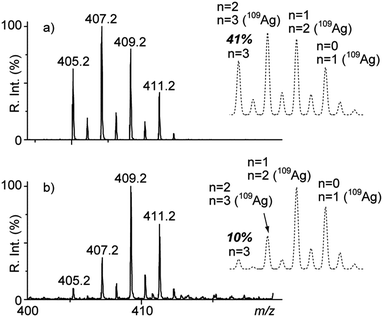
A rapid mass analysis of the pristine and 96 h UV-exposed cardanol samples focused on the unsaturation pattern gives rise to the restricted MALDI(+)-MS spectra depicted in Fig. 2. The four peaks spaced by 2 Da are assigned to the three main tri-, di- and mono-unsaturated compounds convoluted by a silver cation (the saturated component is of too low relative abundance to be visualized owing to the isotope contributions). A strong distortion of the unsaturation pattern is observed between the pristine (Fig. 2a) and the UV-exposed (soluble) sample (Fig. 2b). Simulation of the unsaturation patterns25 allows the composition of tri/di/mono-unsaturated species to be evaluated (insets in Fig. 2). Considering the tri-unsaturated congener at m/z 405/407 (tri-unsaturated cardanol + 107Ag/109Ag), a drastic reduction from 41% to 10% of its abundance is readily observed, in accordance with the preliminary FTIR data. Those highly unsaturated species are indeed more prone to (a) lose a H radical in alpha position and be oxidized and (b) react with the so-formed alkoxide or alkyl radicals. The more the number of unsaturations, the higher the probability to react with radicals.Mass spectrometry is a unique analytical tool to explore the molecular composition of samples. MALDI-MS is nevertheless notoriously biased by the dispersity of polymers,26 owing to desorption, ionization and detection efficiencies issues (in case of a secondary electron detector), all favorable to the lowest molecular weight species. In polydisperse samples for which “small” and “large” species coexist, only the smallest structures would be over-detected while the largest will not be observed at all.
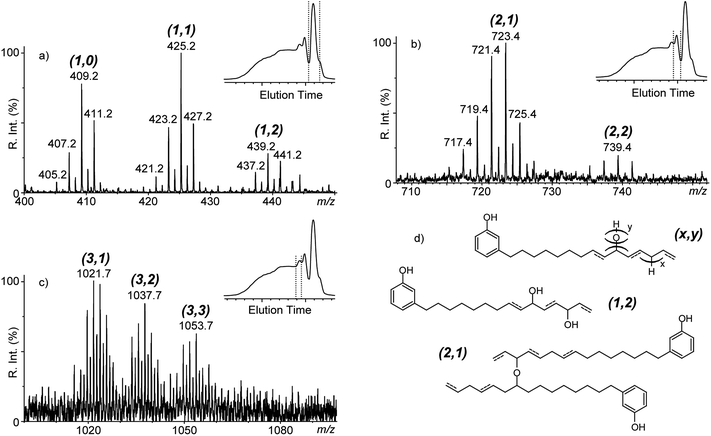
The SEC chromatogram of the 96 h UV-exposed sample (Fig. 1d) exhibits the fingerprint of a highly polydisperse material, leading to biased direct MALDI(+)-MS spectra unable to display the oligomeric species (data not shown). To overcome this inherent discrimination, an off/on-line coupling of SEC and mass spectrometry constitutes an elegant and easy-to-handle analytical strategy.27–29 Fractionating a polydisperse sample by the way of SEC separation (i.e. based on the gyration radius in solution, further correlated to the molecular weight) into several aliquots allows those so-collected “monodisperse” fractions to be mass-analyzed independently with a drastically limited bias. From the SEC elution of the 96 h UV-exposed sample, three fractions have been collected and thought to consist in “monomers”, “dimers” and “trimers” of cardanol. The collected fractions have been re-analyzed by SEC to check at their purity (ESI†) and further mass-analyzed by MALDI(+)-MS (Fig. 3a–c respectively). Owing to a poor signal-to-noise ratio, m/z ranges of the MALDI(+)-MS spectra have been restricted around the peaks of interest, but it is worth mentioning no other cardanol-based species were found in the whole mass spectra. In the MALDI(+)-MS spectrum of the “monomer” fraction (Fig. 3a), in addition to the silverated cardanol at m/z 409 (+congeners) are detected two oxidized species adducted with Ag+ at m/z 425 + congeners (+16 Da = +O/OH) and at m/z 439 + congeners (+32 Da = +2O/OH). Structures of these two new species could be figured out by considering a cardanol moiety with one or two hydrogen atoms in alpha position of the unsaturations replaced by one or two O/OH groups. These oxidized products have been already proposed as photo-products of PB10 and vegetable oils.21 In the “dimer” mass spectrum (Fig. 3b), two species are readily detected at m/z 723 (+congeners) and m/z 739 (+congeners). Their elemental compositions are those of two cardanol moieties plus one or two O/OH groups, respectively. Structurally speaking, a dimer of cardanol with (a) an oxo bridge between the two side chains and (b) an oxo bridge and an additional O/OH group along one of the two side chains constitute satisfactory representations of these two species. By the way, the production of such dimers has involved a double bond of one cardanol moiety and their detection corroborates the consumption of the more unsaturated cardanol components highlighted by FTIR and MALDI(+)-MS (Fig. 1 and 2). The “trimer” mass spectrum (Fig. 3c) finally displays three species detected at m/z 1021 (+congeners), m/z 1037 (+congeners) and m/z 1053 (+congeners), readily seen as trimers of cardanol whose side chains are linked by one O atom, plus one or two O/OH groups along the side chains, respectively.
Incidentally, the UV/Vis spectra of the so-collected fractions have also been recorded to better estimate the contribution of each fraction (“monomer”, “dimer”, trimer” and “oligomer”) to the change in the UV/Vis spectrum of the UV-exposed sample (ESI†). The UV/Vis spectrum of the “monomer” fraction remains highly similar to the UV/Vis spectrum of pristine cardanol with a double maximum at λ = 273/280 nm and a huge decrease of the absorbance beyond 300 nm (relative absorbance at 300 nm: 0.05). The UV/Vis spectrum of the dimeric fraction exhibits a noticeable shouldering towards longer wavelengths (relative abundances at 300 nm: 0.1) while the double maximum tends to merge into a single peak at λ = 273 nm. UV/Vis spectra of “trimer” and “oligomer” fractions follow the same trend, displaying an even more pronounced shouldering towards visible wavelengths (relative abundances at 300 nm: 0.15 and 0.20, respectively). Accompanying the polymerization/cross-linking processes highlighted by the SEC chromatograms is also a strong yellowing of the material (from a light yellow to a dark orange color). From these SEC-UV/Vis spectra, it seems reasonable to conclude the dimers/trimers/oligomers account for this yellowing. The rather limited shouldering of their UV/Vis spectra is in accordance with C–O–C or C–C linkages between the C15 side chains (remote from the phenolic chromophore). However, possible coupling involving the phenol groups30 cannot be dismissed and would also lead to the production of polycardanol species, accounting for the noticeable modification of the double peak maximum at 273 and 280 nm merging into a single absorbance maximum. It is obvious several isomeric products constitute a given species detected in the SEC-MALDI(+)-MS and SEC-UV/Vis spectra owing to the number of unsaturations borne by the C15 side chains. For sake of clarity and following our proposal for the characterization of cardanol derivatives,25 a simple nomenclature is proposed in Fig. 3d to simply name the products formed upon UV exposure. This nomenclature would moreover be more accurate than a unique structure which would make other isomers implicitly not considered. A (x,y) denomination appears sufficiently precise, with x the number of cardanol moieties (C15H31−2nC6H3OH) and y the number of supernumerary oxygen atoms (either O or OH, linking the cardanol side chains or as hydroxy pendant groups) as compared to a pristine cardanol chemical composition. Two examples of structures found in the SEC-MALDI(+)-MS spectra are depicted in Fig. 3d and named with their (x,y) nomenclature: a cardanol moiety bearing two hydroxy groups in lieu of the hydrogen atoms in alpha positions named (1,2) and two cardanol moieties linked by an oxygen atom named (2,1). Despite several structures could be drawn for each (x,y) couple, this nomenclature allows the patterns found in a mass spectrum to be identified unequivocally. The monomeric, dimeric and trimeric photo-products found in the SEC-MALDI(+)-MS spectra of the 96 h UV-exposed cardanol have been subsequently named using this simple nomenclature (Fig. 3a–c). Interestingly, the (3,1) trimeric species found in Fig. 3c should contain either a C–C linkage between side chains10 and/or a phenol/phenol coupling (cf. the SEC-UV/Vis spectra, ESI†), in both cases with no additional oxygen atom as oxo bridge.
A side chain functionalization to reduce the photosensitivity
As profusely demonstrated above, cardanol is highly photo-sensitive, with a high propensity of its C15 polyunsaturated side chain to enter into polymerization and cross-linking until a fully insoluble material is produced. In order to reduce the UV sensitivity of cardanol, the functionalization of its side chain to replace unsaturations by other functional groups appears as a promising route. Several procedures have already been described in the literature.6,7 If the use of the saturated component only (n = 0, pentadecyl phenol, also known as hydrogenated cardanol HC31) would also limit the photosensitivity, its poor natural occurrence would make its extraction tedious and extremely time-consuming by preparative chromatography.32 In addition, its preparation by hydrogenation of cardanol over palladium catalyst33 would require expensive synthesis equipment. On the contrary and despite a multi-step route, modifying the side chain remains a cheap procedure and allows a consequent number of functional groups to be added, further improving the compatibility of cardanol with other chemicals or polymers in a composite system and authorizing unlimited applications.Synthesis and characterization of methoxylated cardanol
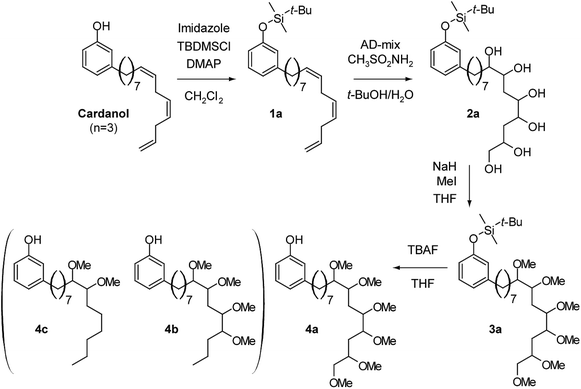
Methoxylation of the side chain has been specifically chosen in order to turn cardanol into a UV resistant derivative, the methoxy groups being expected to remain inert towards UV irradiation in the timeframe pristine cardanol would have turned into an insoluble wax. The synthesis procedure used for the functionalization of the C15 side chain with methoxy groups in lieu of the C![[double bond, length as m-dash]](https://www.rsc.org/images/entities/char_e001.gif) C unsaturations is summed up in Scheme 1 with the detail of all the steps exemplified for the tri-unsaturated congener (n = 3).
C unsaturations is summed up in Scheme 1 with the detail of all the steps exemplified for the tri-unsaturated congener (n = 3).
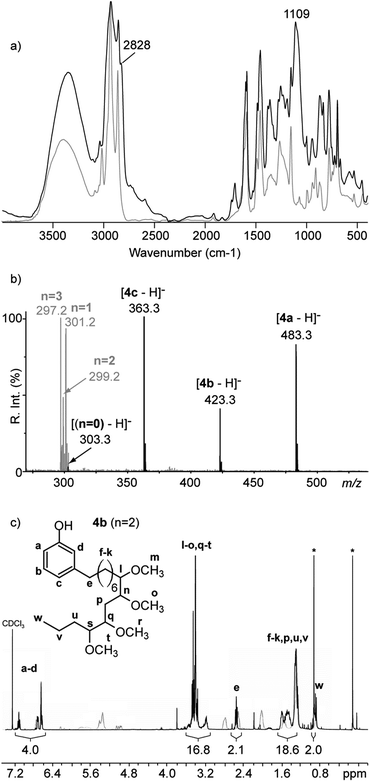
Starting from pristine cardanol, the phenol moiety was first protected with a silylated group using tert-butyldimethylsilyl chloride to yield the so-called cardoxy-tert-butyldimethylsilane 1 (ESI† for MALDI(+)-MS spectra along with additional comments). In the literature, the hydroxylation of the unsaturated side chain of cardanol is performed in two steps: (1) double bonds are first epoxidized and (2) polyols are obtained under acidic hydrolysis.34 Here is proposed a one-step dihydroxylation using AD-mix α35 as catalyst. The hydroxylated cardoxy-tert-butyldimethylsilane 2 was produced with a quantitative yield (ESI† for MALDI(+)-MS spectra). The methylation of the hydroxyl groups was performed using iodomethane and sodium hydride to yield the methoxylated cardoxy-tert-butyldimethylsilane 3 (ESI† for MALDI(+)-MS spectra). The deprotection of the phenol group was finally conducted using a 1 M tetrabutyl ammonium fluoride solution. The targeted methoxylated cardanol 4 was isolated and further submitted to FTIR, MS and NMR analyses before its exposure to UV irradiation and the subsequent analysis of the photo-products. Characterizations of the so-synthesized methoxylated cardanol are compiled in Fig. 4. As compared to the pristine cardanol, the occurrence of two strong bands at 2828 and 1109 cm−1 in the FTIR spectrum of 4 is in accordance with the expected methoxylation (Fig. 4a). To avoid the deleterious adduction of DCTB25 unexpectedly faced with this new cardanol derivative (ESI†) and since the phenol group has been left intact with its slightly acidic hydrogen, a mass analysis in the negative ion mode has been conducted and shown to provide satisfactory mass spectra. The SALDI(−)-MS spectrum of 4 is depicted in Fig. 4b. The targeted methoxylated constituents of cardanol are readily seen at m/z 363 (deprotonated 4c, n = 1), m/z 423 (deprotonated 4b, n = 2) and m/z 483 (deprotonated 4a, n = 3). Interestingly, the fully saturated congener is also slightly observed at m/z 303, bearing no methoxy groups along its side chain. It is finally worth mentioning hydroxylation and subsequent methoxylation of the C15 side chain leads to a degeneracy of the unsaturation pattern. While forming a narrow pattern with peaks spaced by ±2 Da in the mass spectrum of pristine cardanol (Fig. 4b, light grey line), with m/z n = 3 < m/z n = 2 < m/z n = 1, hydroxylated and methoxylated cardanol exhibit instead three distinct peaks spaced by 32 Da and 60 Da, with an inversion of the m/z order: m/z n = 1 (two OH or OMe) < m/z n = 2 (four OH or OMe) < m/z n = 3 (six OH or OMe) (Fig. 4b and ESI†). The 1H NMR spectrum of the methoxylated cardanol is finally depicted in Fig. 4c. The pattern at 3.3 ppm is of particular interest since it is arising from the protons of the so-added methoxy groups and protons of the CH groups from the C15 side chain. As compared to the 1H NMR spectrum of pristine cardanol8 depicted with light grey line in Fig. 4c, no more signal from the unsaturations along the side chain is found between 5.0 and 5.8 ppm, ensuring a quantitative yield. Residual tert-butyldimethylsilyl fluoride formed upon the deprotection of phenol is still found despite the purification step (two peaks at 0.9 and 0.1 ppm noted with asterisks). The tert-butyldimethylsilyl fluoride/methoxylated cardanol molar ratio does nevertheless not exceed 1![[thin space (1/6-em)]](https://www.rsc.org/images/entities/char_2009.gif) :
:![[thin space (1/6-em)]](https://www.rsc.org/images/entities/char_2009.gif) 3 (considering the peak areas) and owing to its inertness towards UV exposure, such impurity will not be further considered. For sake of clarity, the 4b congener (tetramethoxylated cardanol) is depicted in inset and the detected peaks assigned accordingly with letters. Theoretical integrations have been calculated by considering the proton amounts from the three components 4a–c convoluted by their relative abundance,13,14 while the measured integrations from the 1H NMR spectrum have been evaluated considering the four aromatic protons (at 6.7 and 7.1 ppm) as the reference value.
3 (considering the peak areas) and owing to its inertness towards UV exposure, such impurity will not be further considered. For sake of clarity, the 4b congener (tetramethoxylated cardanol) is depicted in inset and the detected peaks assigned accordingly with letters. Theoretical integrations have been calculated by considering the proton amounts from the three components 4a–c convoluted by their relative abundance,13,14 while the measured integrations from the 1H NMR spectrum have been evaluated considering the four aromatic protons (at 6.7 and 7.1 ppm) as the reference value.
UV exposure and characterization of the photo-products
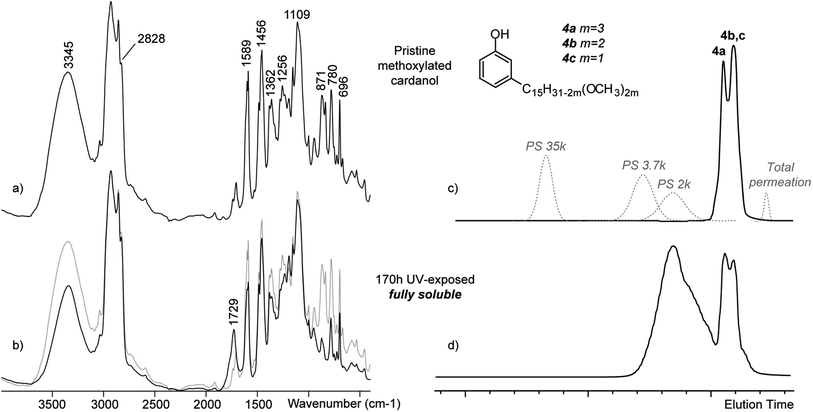
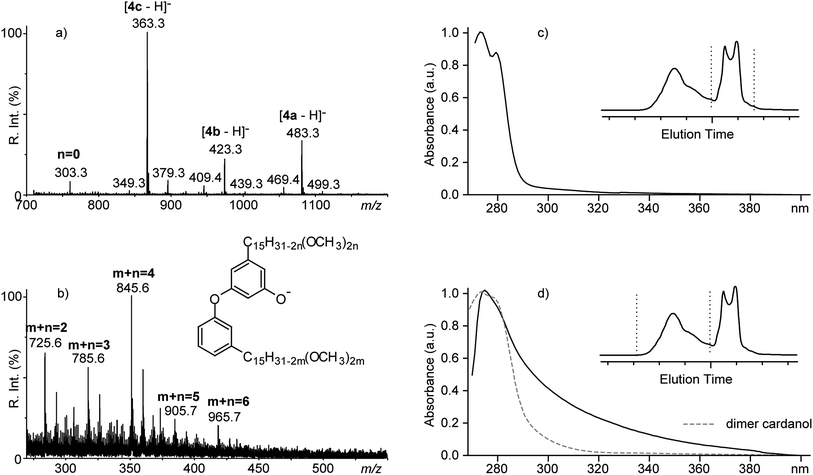
Methoxylated cardanol thick films (∼100 μm) remained fully soluble in THF even after 170 h of UV exposure (3.5 times longer than cardanol which turned into a 50% insoluble wax after 48 h of exposure), with a noticeable increase of its viscosity. However, if the cross-linking process has been considerably lowered no to say avoided by the methoxylation of the side chain, it did not prevent the yellowing of the sample (ESI†). Concomitantly, its UV/Vis spectrum also displays a prominent shouldering towards visible wavelength (ESI†). Echoing the characterizations done for cardanol, FTIR, SEC, SEC-SALDI(−)-MS and SEC-UV/Vis analyses have been conducted to better comprehend the ageing processes. The FTIR spectra of pristine and 170 h UV-exposed methoxylated cardanol 4 are depicted in Fig. 5a and b. Among the noticeable differences, one should notice a huge diminution of the –OH band at 3345 cm−1 which strongly differ from the FTIR fingerprints of aged vs. pristine cardanol (Fig. 1b). Relative abundance of the bands from the methoxy groups are very slightly decreasing, while a typical band at 1729 cm−1 associated with carbonyl photoproducts is appearing, indicating that methoxylated cardanol is rather resistant but not insensitive to UV irradiation. SEC analysis has been carried out to better understand the origin of the increase of the viscosity, probably due to unexpected oligomerization processes. The SEC chromatograms of pristine and 170 h UV-exposed methoxylated cardanol are depicted in Fig. 5c and d. A strong propensity for dimerization is readily found in the SEC chromatogram of the photopolymerized methoxylated cardanol. The so-called “dimer” peak is indeed not exceeding 4000 g mol−1 PS equivalent (Fig. 5c). Its broadness could be accounted for by considering the six dimers potentially produced from the three monomers constituting the methoxylated cardanol (dimethoxylated, tetramethoxylated and hexamethoxylated) and their radius of gyration which probably largely differ. The clear discrimination between the hexamethoxylated cardanol (4a, m = 3) and the two tetramethoxylated and dimethoxylated (4b&c, m = 2 and m = 1) in the “monomer” peak of pristine methoxylated cardanol (Fig. 5c) supports this assumption. The production of dimers only remains not clearly understood at the time of writing, but undoubtedly accounts for the full solubility of the UV-exposed sample in THF, and indirectly validates the oligomerization/cross-linking process through the double bonds for the native cardanol.Following the analytical methodology proposed for cardanol, “monomer” and “dimer” fractions from the SEC elution of the 170 h UV-exposed methoxylated cardanol have been subsequently mass analyzed in SALDI(−)-MS (Fig. 6a and b) and their associated UV/Vis spectra recorded separately and depicted in Fig. 6c and d. Collected fractions have been re-analyzed by SEC to ensure their purity (ESI†). The mass spectrum of the “monomer” peak (Fig. 6a) is highly similar to the SALDI(−)-MS spectrum of pristine methoxylated cardanol 4 prior to any UV irradiation (Fig. 4b). However, the detection of ions of very limited relative abundances at m/z 379 (+16 Da from 4c), m/z 439 (+16 Da from 4b) and m/z 499 (+16 Da from 4a) highlights the occurrence of oxidative processes during the irradiation. In addition, the production of hydroxy groups from methoxy groups through demethylation (as reported by Lachman et al. for the thermal ageing of polyphenols36) is shown by the detection of species of lower molecular weights at m/z 349 (−14 Da from 4c), m/z 409 (−14 Da from 4b) and m/z 469 (−14 Da from 4a). This could account for the slight decrease of the MeO bands in the FTIR spectrum of the UV-exposed methoxylated cardanol (Fig. 5b). The SALDI(−)-MS spectrum of the “dimer” fraction is depicted in Fig. 6b. Deprotonated dimers are readily observed with a varying number of methoxy groups (from 4 at m/z 725.6 to 12 at m/z 965.7). Based on their chemical composition and according to the nomenclature proposed in the previous section (Fig. 3d), those dimers should be noted (2,0) since they are formed of two (methoxylated) cardanol moieties but no additional (bridging) oxygen atoms. Considering that last point, and since no more unsaturation along the side chain could lead to carbon–carbon bonding, the dimerization process has been speculated to occur though a phenol group with a Ph–O–Ph ether linkage.30 This structural consideration nicely accounts for the dramatic decrease of the –OH band observed in the FTIR spectrum of the UV-exposed methoxylated cardanol (Fig. 5b). The UV/Vis spectrum of the “monomer” fraction (Fig. 6c) remains similar to the UV/Vis spectrum of pristine methoxylated cardanol (ESI†) with a double maximum at 273/280 nm and the absence of absorbance above 300 nm (relative absorbance at 300 nm: 0.04), thus indicating the photoproducts found in FTIR and SALDI(−)-MS do not constitute the main part of this “monomer” fraction. On the contrary, the UV/Vis spectrum of the “dimer” fraction depicted in Fig. 6d strongly deviate from the “monomer” fingerprint with the disappearance of the double maximum absorption at 273 and 280 nm – replaced by a unique maximum at 275 nm – and a highly pronounced shouldering towards higher wavelengths (relative absorbance at 300 nm: 0.42). Even dimers from the UV-exposed cardanol (ESI†) whose UV/Vis spectrum has been depicted with dashed line in Fig. 6d for sake of reminder and comparison do not exhibit such drastic change in their absorption property (relative absorbance at 300 nm: 0.10). This last experiment makes the Ph–O–Ph bridging – that is to say involving the phenolic chromophores – even more probable and meaningful, and indirectly validates the C15–O–C15 linkage proposed for cardanol.
Functionalization of the C15 polyunsaturated side chain of cardanol through methoxylation has been shown to prevent the cross-linking processes to occur, the cardanol derivative only dimerizing under UV exposure but remaining fully soluble and thus appearing of tremendously lower photosensitivity as compared to cardanol. Incidentally, its photoageing mechanism – namely a dimerization through a phenol–phenol linkage – also highlights another photopolymerization process potentially occurring for cardanol, which was not evidenced in the previous section owing to the predominance of the routes involving the side chains. By tailoring the structure of cardanol – a pristine side chain highly sensitive to UV photoageing or a methoxylated chain which does not undergo severe modification – one could then expect to monitor the UV sensitivity of a cardanol-based product with a tunable photocrosslinking ability.
Cardanol-based copolymers of tunable photosensitivity
Acrylated monomers have been prepared with cardanol and methoxylated cardanol and subsequently copolymerized with MMA by ATRP, mimicking the structures proposed by Suresh et al.12 Since the relative inertness of methoxylated cardanol has been observed in a timeframe cardanol would have turned into fully insoluble wax, it seems reasonable to expect a tunable propensity of copolymers whose co-monomeric composition has been properly monitored to photocrosslink under UV exposure. In the following section, poly(MMA-r-cardoxyethanol acrylate) (in lieu of acrylated cardanol) further noted poly(MMA-r-CEAcry), poly(MMA-r-methoxylated cardoxyethanol acrylate) noted poly(MMA-r-MCEAcry) and poly(MMA-r-methoxylated cardoxyethanol acrylate-r-cardoxyethanol acrylate) noted poly(MMA-r-MCEAcry-r-CEAcry) have been prepared and their UV sensitivity conveniently evaluated by SEC.Synthesis of acrylated cardanol derivatives and copolymers
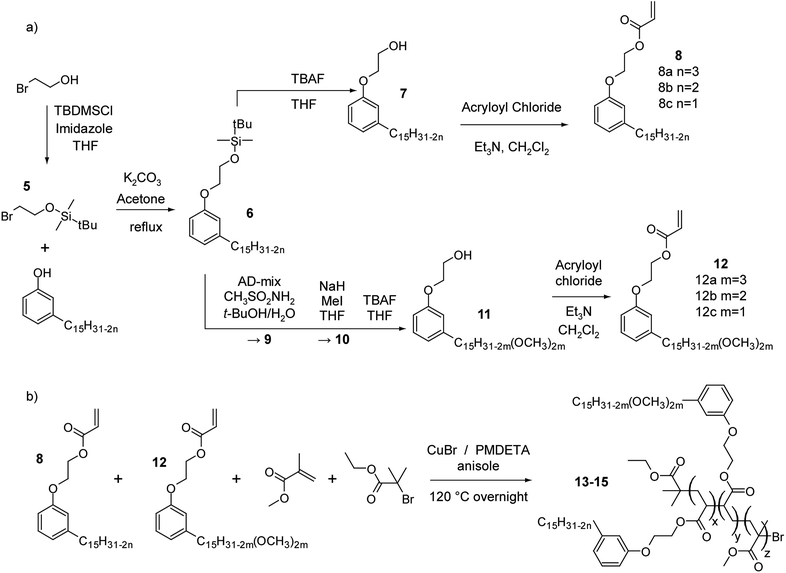
The synthesis routes followed to synthesize the so-called cardoxyethanol acrylate37 and methoxylated cardoxyethanol acrylate are detailed in Scheme 2a (ESI† for the characterization of the cardoxyethanol acrylate 8 and the methoxylated cardoxyethanol 12). In the ESI† is also briefly reported the characterization of a commercially available cardoxyethanol (7 in Scheme 2a). Despite its use in lieu of cardanol would allow a one step shorter synthesis route, this industrial grade chemical contains nevertheless a large amount of oligomers and side products (ESI† for an unsuccessful attempt of purification) which would be deleterious for the functionalization and subsequent polymerization steps. Random copolymers were further synthesized by ATRP using MMA and 8 or MMA and 12 to produce copolymers noted 13 and 14. A third terpolymer using MMA, 8 and 12 has finally been synthesized and noted 15. Co-monomer ratios were targeted to 90![[thin space (1/6-em)]](https://www.rsc.org/images/entities/char_2009.gif) :
:![[thin space (1/6-em)]](https://www.rsc.org/images/entities/char_2009.gif) 10, 90
10, 90![[thin space (1/6-em)]](https://www.rsc.org/images/entities/char_2009.gif) :
:![[thin space (1/6-em)]](https://www.rsc.org/images/entities/char_2009.gif) 10 and 90
10 and 90![[thin space (1/6-em)]](https://www.rsc.org/images/entities/char_2009.gif) :
:![[thin space (1/6-em)]](https://www.rsc.org/images/entities/char_2009.gif) 5
5![[thin space (1/6-em)]](https://www.rsc.org/images/entities/char_2009.gif) :
:![[thin space (1/6-em)]](https://www.rsc.org/images/entities/char_2009.gif) 5, respectively. Structures of the copolymers and the whole synthesis route are depicted in Scheme 2b.
5, respectively. Structures of the copolymers and the whole synthesis route are depicted in Scheme 2b.
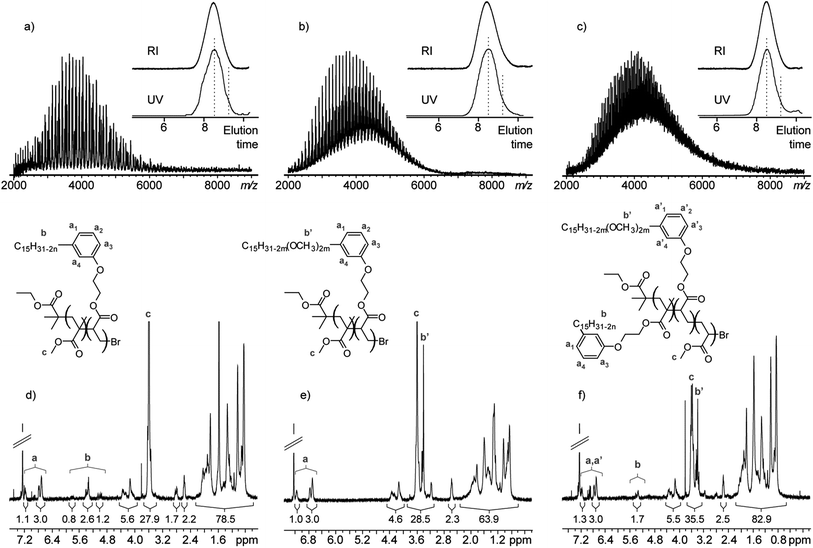
The SEC-MALDI(+)-MS and 1H NMR spectra of the so-synthesized three copolymers 13–15 are depicted in Fig. 7. The SEC chromatograms recorded from a refractive index (RI) and UV/Vis detectors are depicted in insets in Fig. 7a–c. Note that the great similarities of peak shapes and retention times from RI and UV ensure the (UV-active) cardanol moieties to be homogeneously distributed throughout the polymeric distribution, without any discrimination effect with regard to the MW. In all the three cases, a Gaussian-shaped polymeric distribution is readily detected in the SEC-MALDI(+)-MS spectra. Their richness in terms of peaks is accounted for by considering that three components actually constitute the so-called cardoxyethanol acrylate 8 (±2 Da, n = 1–3) and methoxylated cardoxyethanol acrylate 12 (±60 Da, m = 1–3), making 13, 14 and 15 to be formed of four, four and seven co-monomers, respectively. The 1H-NMR spectra of the copolymers/terpolymer are depicted in Fig. 7d–f. For 13, aromatic ring and unsaturations from cardanol are highlighted by protons at δ = 7 ppm (noted a) and at δ = 5.4 ppm (noted b) while the methoxy groups from MMA are highlighted by protons at δ = 3.6 ppm and noted c (Fig. 7d). For 14, aromatic ring and methoxy groups from methoxylated cardanol are highlighted by protons noted a at δ = 7 ppm and b’ at δ = 3.4 ppm, the methoxy groups from MMA are highlighted by protons c at δ = 3.6 ppm (Fig. 7e). The terpolymer structure of 15 is readily seen with protons from the unsaturations of cardanol b and protons from the methoxy groups of methoxylated cardanol b’ at δ = 5.4 ppm and δ = 3.4 ppm respectively (Fig. 7f) i.e. a combination of spectra of 13 and 14.
Highlighting a tailored photosensitivity by SEC
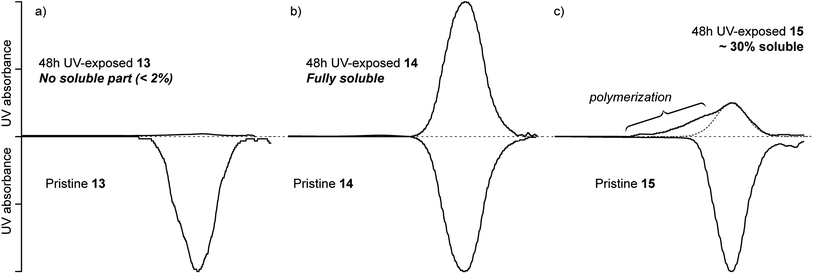
Thin films of the three copolymers have been deposited on a glass substrate by drop casting (∼6 μm measured by Nanoscratch) and submitted to UV irradiation for 48 h.Based on the previous results about the photosensitivity of cardanol and methoxylated cardanol, one should expect: (a) copolymer 13 should undergo extensive crosslinking under UV as pristine cardanol, (b) copolymer 14 should not undergo any modification in the timeframe of the experiment as methoxylated cardanol and (c) terpolymer 15 should exhibit an intermediate behavior. After 48 h, thin films were scrapped from the glass substrates and solubilized in THF. Both 13 and 15 were found not to fully solubilize but swell with solvent, while 14 fully dissolved in THF with no apparent residue. The SEC chromatograms recorded from the so-collected (soluble when relevant) fractions are depicted in Fig. 8a–c (top) with the SEC chromatograms of the native copolymers for sake of comparison (bottom). In good agreement with the hypothesized behaviors, a very limited (<2%) soluble part has been found for the cardanol-based copolymer 13, giving rise to a nearly inexistent signal in UV detection (Fig. 8a). On the contrary, the methoxylated cardanol-based copolymer 14, fully soluble, does not undergo any visible change in terms of molecular weight distribution, its SEC chromatogram remaining strictly similar to the pristine sample despite the photoageing (Fig. 8b). One should note that this inertness indirectly validates the dimerization process through the phenol group (phenol–phenol coupling) proposed for methoxylated cardanol 4. Indeed, the phenol group is naked in 4 but capped by a hydroxyethyl acrylate function in the MCEAcry co-monomer 12 and thus unavailable for dimerization. Finally, a soluble fraction evaluated at around 30% w/w has been collected from the terpolymer 15 (containing both cardanol and methoxylated cardanol), giving rise to a satisfactory SEC chromatogram but of lower relative abundance as compared to the pristine sample (Fig. 8c). In addition, a polymerization process is clearly occurring and highlighted by a shouldering of the SEC peak towards the shorter elution times, i.e. the larger MW. SEC analyses clearly show a discrimination in the UV sensitivity of the three copolymers depending on their co-monomeric composition, in accordance with the respective sensitivity of cardanol and methoxylated cardanol from which the co-monomers have been derived. This preliminary result is of promising interest for the development of bio-based photo crosslinkable polymers with a tunable curing rate.
Conclusion
Through the implementation of several analytical techniques ranging from FTIR to SEC-MS coupling, the bare bones of the behavior of cardanol under UV exposure have been deciphered. In particular, oligomerization processes implicating its polyunsaturated side chain have been highlighted, ultimately leading to its complete insolubility in a short term. Such photosensitivity could appear as a fast ageing drawback but also and mainly as a promising photocrosslinking property. A functionalization of the side chain by methoxylation has been proposed and found to drastically limit the UV sensitivity of this newly synthesized cardanol derivative. In particular, cross linking reactions have been successfully avoided, despite some oxidative processes and a dimerization were still observed – none the less in a relative longer timeframe as compared to pristine cardanol. The combination of these two bio-based compounds has further permitted the preliminary monitoring of copolymers curing propensity under UV activation by tailoring their composition, as a promising step towards tunable photo crosslinkable biobased polymers.Acknowledgements
Cardolite Specialty Chemical is gratefully acknowledged for the supply of cardanol used in this study.References
- B. Lochab, S. Shukla and I. K. Varma, RSC Adv, 2014, 4, 21712–21752 RSC.
- S. Kanehashi, K. Yokoyama, R. Masuda, T. Kidesaki, K. Nagai and T. Miyakoshi, J. Appl. Polym. Sci., 2013, 130, 2468–2478 CrossRef CAS PubMed.
- T. de Jesus Aguiar dos Santos Andrade, B. Quirino Araújo, A. Maria das Graças Lopes Citó, J. da Silva, J. Saffi, M. F. Richter and A. de Barros Falcão Ferraz, Food Chem., 2011, 123, 1044–1048 Search PubMed.
- W. Arayapranee and G. L. Rempel, J. Appl. Polym. Sci., 2007, 106, 2696–2702 CrossRef CAS PubMed.
- G. Scott, Degradable Polymers: Principles and Applications, Kluwer Academic Publishers, Dordrecht, 2nd edn, 2003, pp. 193–194 Search PubMed.
- V. S. Balachandran, S. R. Jadhav, P. K. Vemula and G. John, Chem. Soc. Rev., 2013, 42, 427–438 RSC.
- C. Voirin, S. Caillol, N. V. Sadavarte, B. V. Tawade, B. Boutevin and P. P. Wadgaonkar, Polym. Chem., 2014, 5, 3142–3162 RSC.
- S. Mohapatra and G. B. Nando, RSC Adv., 2014, 4, 15406–15418 RSC.
- S. Mohapatra and G. B. Nando, Ind. Eng. Chem. Res., 2013, 52, 5951–5957 CrossRef CAS.
- G. Mertz, Evolution des Propriétés physic chimiques et mecaniques de composites à base caoutchoucs lors du photo vieillissement, PhD dissertation, Ecole Nationale Supérieure des Mines de Nancy, 2011, pp. 24–27.
- C. Adam, J. Lacoste and J. Lemaire, Polym. Degrad. Stab., 1989, 24, 185–200 CrossRef CAS.
- K. I. Suresh and M. Jaikrishna, J. Polym. Sci., Part A: Polym. Chem., 2005, 43, 5953–5961 CrossRef CAS PubMed.
- P. Verge, T. Fouquet, C. Barrère, V. Toniazzo, D. Ruch and J. A. S. Bomfim, Compos. Sci. Technol., 2013, 79, 126–132 CrossRef CAS PubMed.
- L. Puchot, P. Verge, T. Fouquet, J. A. S. Bomfim, V. Toniazzo and D. Ruch, Appl. Clay Sci., 2014, 99, 35–41 CrossRef CAS PubMed.
- M. Strohalm, D. Kavan, P. Novák, M. Volný and V. Havlíček, Anal. Chem., 2010, 82, 4648–4651 CrossRef CAS PubMed.
- S. Trimpin, A. Rouhanipour, R. Az, H. J. Räder and K. Müllen, Rapid Commun. Mass Spectrom., 2001, 15, 1364–1373 CrossRef CAS PubMed.
- S. Trimpin, S. Keune, H. J. Räder and K. Müllen, J. Am. Soc. Mass Spectrom., 2006, 17, 661–671 CrossRef CAS PubMed.
- S. Li, T. Zou, L. Feng, X. Liu and M. Tao, J. Appl. Polym. Sci., 2013, 128, 4164–4171 CrossRef CAS PubMed.
- D. Tiwari, A. Devi and R. Chandra, Int. J. Drug Dev. Res., 2011, 3, 171–175 CAS.
- M. Piton and A. Rivaton, Polym. Degrad. Stab., 1996, 53, 343–359 CrossRef CAS.
- L. Fertier, H. Koleilat, M. Stemmelen, O. Giani, C. Joly-Duhamel, V. Lapinte and J.-J. Robin, Prog. Polym. Sci., 2013, 38, 932–962 CrossRef CAS PubMed.
- M. T. S. Trevisan, B. Pfundstein, R. Haubner, G. Wurtele, B. Spiegelhalder, H. Bartsch and R. W. Owen, Food Chem. Toxicol., 2006, 44, 188–197 CrossRef CAS PubMed.
- P. Cesla, L. Blomberg, M. Hamberg and P. Jandera, J. Chromatogr., A, 2006, 1115, 253–259 CrossRef CAS PubMed.
- R. Yadav, P. Awasthi and D. Srivastava, J. Appl. Polym. Sci., 2009, 114, 1471–1484 CrossRef CAS PubMed.
- T. Fouquet, L. Puchot, P. Verge, J. A. S. Bomfim and D. Ruch, Anal. Chim. Acta, 2014, 843, 46–58 CrossRef CAS PubMed.
- H. C. M. Byrd and C. N. McEwen, Anal. Chem., 2000, 72, 4568–4576 CrossRef CAS.
- M. W. F. Nielen and S. Malucha, Rapid Commun. Mass Spectrom., 1997, 11, 1194–1204 CrossRef CAS.
- M. W. F. Nielen, Mass Spectrom. Rev., 1999, 18, 309–344 CrossRef CAS.
- M. S. Montaudo, C. Puglisi, F. Samperi and G. Montaudo, Rapid Commun. Mass Spectrom., 1998, 12, 519–528 CrossRef CAS.
- S.-I. Kuroda, A. Nagura, K. Horie and I. Mita, Eur. Polym. J., 1989, 25, 621–627 CrossRef CAS.
- S. Santeusanio, O. A. Attanasi, R. Majer, M. Cangiotti, A. Fattori and M. F. Ottaviani, Langmuir, 2013, 29, 11118–11126 CrossRef CAS PubMed.
- I. E. Bruce, A. Long, P. B. Payne and J. H. P. Tyman, J. Liq. Chromatogr., 1990, 13, 2103–2111 CrossRef CAS PubMed.
- T. Gandhi, M. Patel and B. K. Dholakiya, J. Nat. Prod. Plant Resour., 2012, 2, 135–142 CAS.
- K. I. Suresh and V. S. Kishanprasad, Ind. Eng. Chem. Res., 2005, 44, 4504–4512 CrossRef CAS.
- A. B. Dounay, G. J. Florence, A. Saito and C. J. Forsyth, Tetrahedron, 2002, 58, 1865–1874 CrossRef CAS.
- J. Lachman, J. Dudjak, M. Orsák and V. Pivec, Plant, Soil Environ., 2003, 49, 1–7 CrossRef CAS PubMed.
- K. I. Suresh, G. Foerst, R. Schubert and E. Bartsch, J. Surfactants Deterg., 2012, 15, 207–215 CrossRef.
Footnote |
| † Electronic supplementary information (ESI) available: Structure of the cardanol components, UV/Vis spectra and SEC-UV/Vis spectra of UV-exposed cardanol, MALDI-MS spectra of intermediate products to the methoxylated cardanol, UV/Vis spectrum of UV-exposed methoxylated cardanol, MALDI-MS spectra of the CEAcry and MCEAcry monomers, SEC chromatograms, MALDI-MS spectra and SEC-MALDI-MS spectra of a commercially available cardoxyethanol. See DOI: 10.1039/c5ra02858b |
| This journal is © The Royal Society of Chemistry 2015 |

