Qingyang Lia,
Zhongbao Fenga,
Lihua Liub,
Hong Xub,
Wang Gea,
Fenghuan Lia and
Maozhong An*a
aState Key Laboratory of Urban Water Resource and Environment, School of Chemical Engineering and Technology, Harbin Institute of Technology, No. 92 West-Da Zhi Street, Harbin 150001, China. E-mail: mzan@hit.edu.cn; Tel: +86-451-86418616
bJiangsu Fasten Group, No. 165 Cheng-Jiang Zhong Street, Jiangyin 214434, China
First published on 1st April 2015
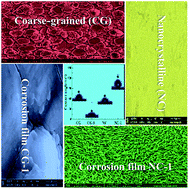
The corrosion resistance improvement of a zinc coating with the reduction of grain size from micro to nano-scale has long been attributed to the formation of better protection of the corrosion product layer. However, the formation mechanism of the protective corrosion product layer has rarely been studied. Here nanocrystalline zinc coatings are produced by pulse reverse electrodeposition in a sulfate bath with polyacrylamide as the only additive. The electrochemical and natural corrosion behaviors of an electrodeposited nanocrystalline zinc coating in comparison with a conventional coarse-grained zinc coating in simulated seawater are investigated. The nanocrystalline zinc coating exhibits distinctly enhanced corrosion resistance in the simulated seawater compared to the coarse-grained zinc coating. The enhanced corrosion resistance of zinc coatings with the reduction of grain size from micro (6 μm) to nano-scale (31 nm) is due to the fact that the nanocrystalline zinc coating is characterized by a high-volume fraction of grain boundaries, and the zinc atoms at grain boundaries possess a higher activity. This is beneficial for rapidly forming a protective corrosion product film with a hydrophobic nano-wire structure on the surface of the zinc coating during the exposure to simulated seawater, thereby contributing to the corrosion resistance enhancement. Based on analysis results, the possible formation mechanism of a protective corrosion product layer on the surface of the nanocrystalline zinc coating is discussed in detail.
Electrodeposition of nanocrystalline coatings possesses excellent wear resistance,4,5 corrosion resistance,6,7 ductility,8,9 hardness10,11 and electrochemical properties12 due to its grain size below 100 nm and high-volume fraction of grain boundary,13 when compared with conventional coarse-grained coatings. Therefore, it is of great significance to improve the corrosion property of conventional zinc coating through nano-electrodeposition technology, and it has become a future direction. So far, several nanocrystalline zinc coatings have been obtained through direct current or pulse current electrodeposition from various galvanizing bath (such as alkali,14 chloride,15 sulfate,16 acetate17 or citrate18 system) with two or more additives. Meanwhile, some related works have been done to investigate the corrosion behavior of nanocrystalline zinc coatings in various solutions by different techniques. For example, Youssef et al.3 investigated the corrosion behavior of nanocrystalline zinc deposit (56 nm grain size) in 0.5 M NaOH solution (pH = 13.6, 25 ± 1 °C) by potentiodynamic polarization and impedance measurements. Ramanauskas et al.14 investigated the corrosion behavior of nanocrystalline zinc coatings (30–120 nm) in 0.6 M NaCl + 0.2 M NaHCO3 solution (pH = 6.8, 25 ± 1 °C) using polarization measurements. G. Z. Meng et al.18 studied the pitting corrosion behavior of nanocrystalline zinc (21.5 nm grain size) in 0.5 M NaCl (pH = 12, 25 ± 1 °C) through statistical methods. M. C. Li et al.19 also demonstrated that the corrosion resistance of nanocrystalline zinc deposit (43 nm grain size) was greater than that of its coarse-grained counterpart in 3.5% NaCl solution (open to air at 25 ± 2 °C). There have been other studies on the corrosion resistance of nanocrystalline zinc coatings. Almost all of them suggest that the better corrosion resistance of nanocrystalline zinc coatings mainly results from their protective corrosion product layers.20–22 However, the formation mechanism of corrosion product film on the surface of nanocrystalline zinc coating has been scarcely studied to date.
In our previous work, the nanocrystalline zinc coatings were produced by pulse reverse electrodeposition and the tribological behavior of nanocrystalline zinc coating was investigated.23,24 In this paper, the electrochemical corrosion and natural corrosion behaviors of nanocrystalline zinc coating in simulated seawater are systematically investigated, and these behaviors are compared with those of conventional coarse-grained zinc coating. Specially, interests are focused on the formation mechanism of protective corrosion product film on the surface of nanocrystalline zinc coating.
Compositions | Electrodeposition parameters | ||
---|---|---|---|
Zinc sulfate | 100 g L−1 | Forward pulse current density | 3 A dm−2 |
Boric acid | 20 g L−1 | Reverse pulse current density | 0.3 A dm−2 |
Polyacrylamide | 1 g L−1 | Forward pulse duration | 100 ms |
pH | 1–2 | Reverse pulse duration | 10 ms |
Temperature | 23 ± 2 °C | Duty cycle | 20% |
Magnetically stirred | Mild | Time | 60 min |
Surface and cross-sectional morphologies of zinc coatings were characterized by field-emission scanning electron microscope (FESEM, Helios Nanolab 600i) with energy dispersive X-ray spectroscopy (EDS) and atomic force microscope (AFM, Bruker Multimode 8). X-ray diffraction (XRD, Rigaku Corporation Dmax-3B) was carried out using Cu Ka radiation in order to determine the crystalline texture, crystallographic preferred orientation and approximate average grain size of the coatings. The grain size was calculated by the Scherrer's formula according to eqn (1).25
![]() | (1) |
The wettability of zinc coatings was evaluated based on contact angles obtained by contact angle goniometer (CA, Dataphysics OCA20) with a droplet (3 μL) of water as an indicator. Typically, 3 different points were obtained for individual specimens, from which the average values were calculated. All results are reported as the mean number ± standard deviation.
EIS measurements were conducted at open-circuit potential with potential amplitude of 10 mV, and frequency range from 10−2 Hz to 105 Hz. Before conducting EIS experiments, the working electrode was kept in simulated seawater for 30 min in order to stabilize the corrosion potential. The equivalent circuit simulation program ZsimpWin was used for data analysis and fitting of the impedance data.
Potentiodynamic polarization curves were obtained by changing the electrode potential in the range of ±500 mV around the open-circuit potential (OCP) against SCE at a scan rate of 1.0 mV S−1. The corrosion potentials (Ecorr), anodic and cathodic Tafel slopes (βa and βc) were calculated from the polarization curves using linear extrapolation method. Then, the corrosion current (icorr) of zinc coatings was calculated by means of the Stern–Geary equation according to eqn (2).26
![]() | (2) |
The linear polarization resistance (Rp) was determined by the slope of current–potential plot in the range of ±2 mV about the corrosion potential according to eqn (3).3,27
![]() | (3) |
After potentiodynamic polarization test, the surface morphology and element composition of zinc coatings was analyzed by FESEM and EDS elemental mapping, respectively.
![]() | ||
Fig. 1 FESEM micrographs of coarse-grained (a and c) and nanocrystalline (b) zinc coatings, and AFM image of nanocrystalline (d) zinc coating. |
![]() | ||
Fig. 3 Bode plots of coarse-grained and nanocrystalline zinc coatings in simulate seawater: (a) Bode magnitude plots and (b) Bode phase plots. |
![]() | ||
Fig. 4 Nyquist plots of coarse-grained (a) and nanocrystalline (b) zinc coatings in simulate seawater and equivalent circuit. Symbols: measured data; lines: simulated data. |
It is obvious that surface nanocrystallization of zinc coatings results in an increase in the interface impedance and in the maximum phase angle in Fig. 3, indicating an improvement in the corrosion resistance.31,32 Moreover, from the Bode phase plots it can also be observed that the phase angle do not reach zero at high frequencies for both coatings, indicating the presence of defects in the coating surface.33
As seen from Fig. 4, both Nyquist plots exhibit single depressed capacitive semicircles at higher frequencies, which is attributed to the charge transfer in combination with the corrosion product layers.19,30 It is noteworthy that the diameter of the semicircle increases with the reduction of grain size to nanocrystalline, indicating the much larger impedance values of nanocrystalline zinc coating. This result is also confirmed by the fitted results (as shown in Table S1†), showing that the values of Rct are much larger for nanocrystalline zinc coating (Rct(NC) = 360.2 Ω cm2) than for coarse-grained zinc coating (Rct(CG) = 121.9 Ω cm2). These results all demonstrate that the corrosion resistance of zinc coatings is significantly improved with the reduction of grain sizes.
In order to verify the EIS results, the corrosion resistance properties of nanocrystalline and coarse-grained zinc coatings are also evaluated through potentiodynamic polarization curves in simulated seawater, as shown in Fig. 5. The corrosion processes of zinc coatings are in accordance with those reported by other investigators,34–36 which could be explained by two partial reactions:
![]() | ||
Fig. 5 Polarization curves of coarse-grained (a) and nanocrystalline (b) zinc coatings in simulated seawater at 25 ± 1 °C. |
The cathodic reaction is the reduction of oxygen and leads to an increase in pH.
O2 + 2H2O + 4e− → 4OH− | (4) |
The anodic reaction involves the dissolution of zinc and leads to a decrease in the sample weight.
Zn → Zn2+ + 2e− | (5) |
A notable difference is that the curve of nanocrystalline zinc coating shift to the left-hand side over the entire potential range in comparison with that of coarse-grained zinc coating, which means that nanocrystalline zinc coating has lower both anodic and cathodic reaction rates during corrosion process than coarse-grained zinc coating. A summary of electrochemical parameters calculated from the potentiodynamic polarization curves by Stern–Geary equation is listed in Table 2. It is evident that, although the corrosion potential (Ecorr) of coarse-grained zinc coating is more positive than that of nanocrystalline zinc coating, the nanocrystalline zinc sample exhibits a more protective coating than that of coarse-grained zinc sample. This is evidenced by the lower corrosion current density (icorr) of nanocrystalline zinc coating. The results fairly accorded with experimental results reported in Arthoba Naik's literatures,16,20,21 and reveal the same variation trend in corrosion resistance with the reduction of grain sizes. The corrosion resistance of zinc coating is heighted by more than 1 time with the reduction of grain sizes from micro (6 μm) to nano-scale (31 nm).
Sample | Ecorr mV | βa mV dec−1 | βc mV dec−1 | Rp Ω cm2 | icorr μA cm−2 |
---|---|---|---|---|---|
CG | −1055 | 60.2 | 289.2 | 450.4 | 48.1 |
NC | −1109 | 51.1 | 173.5 | 918.7 | 18.6 |
After potentiodynamic polarization test, FESEM observation and EDS analysis are carried out for coarse-grained and nanocrystalline zinc coatings and are shown in Fig. 6–8, respectively. Significant differences can be observed in the corroded surfaces of zinc coatings and are shown in Fig. 6. There are many cracks on the surface of coarse-grained zinc coating, and parts of the coating have been detached from the coating surface during the corrosion process (Fig. 6a–c), indicating that the corrosion sites are local and corroded badly. The EDS spectrum (Fig. 7) for the material detached from the surface of coarse-grained zinc coating confirms it is zinc. As for nanocrystalline zinc coating, some small and shallow etch-pits are discretely distributed over the corroded surface (Fig. 6d–f), which indicates a better protective surface film. Meanwhile, The EDS elemental mappings for the corroded surfaces of zinc coatings are also detected and are shown in Fig. 8. After potentiodynamic polarization test in simulated seawater, both corrosion products mainly consist of Zn, O and Cl elements. It is noteworthy that the chemical distribution on nanocrystalline zinc coating is relatively uniform than that on coarse-grained zinc coating, also indicating that the electrochemical corrosion of coarse-grained zinc coating is a local behavior. In this case, the improvement in corrosion resistance of zinc coatings with the reduction of grain sizes from micro to nano-scales is attributed to the fact that the nanomaterials are characterized by a high-volume fraction of grain boundary, and the zinc atoms that are at the grain boundaries possess a higher activity. For coarse-grained zinc coating, it only achieves the nanoscale in the thickness direction (as shown in Fig. 1c), so the zinc atoms that are in the thickness direction possess a higher activity. As for nanocrystalline zinc coating, it achieves the nanoscale in three-dimensional space, so zinc atoms that are exposed on the surface of the coating possess a higher activity. The reduction of grain sizes can lead to the number increase in active atoms of the surface, accelerating the formation of corrosion product layers on the surface of zinc coatings during the electrochemical corrosion process. Many authors have reported that zinc hydroxide chloride layer forms on the zinc coatings during exposure to NaCl solution,35–37 and the corresponding elements can also be found in the EDS elemental mapping (as shown in Fig. 8). This also explains the reason why nanocrystalline zinc coating exhibits more negative Ecorr than coarse-grained zinc coating (as shown in Fig. 5). Since there is no obvious passivation region in the polarization curves of zinc coatings, the zinc hydroxide chloride layer is always classified as a pseudo-passive layer.38 The insoluble zinc hydroxide chloride layers that cover the surface of corroded coatings can inhibit corrosion further, thereby decrease the rate of zinc dissolution.32,34 Moreover, these discrete etch pits on the surface of nanocrystalline zinc coating are also an indication that corrosion initiates from defect sites of the zinc hydroxide chloride film. In order to verify this relationship between corrosion resistance and corrosion product layer of zinc coatings, a corrosion product layer is synthesized on the surface of coarse-grained and nanocrystalline zinc coatings by an immersion test in simulated seawater, furthermore the formation mechanism and properties of corrosion product films are systematically investigated.
![]() | ||
Fig. 6 FESEM images with different magnifications of coarse-grained (a–c) and nanocrystalline (d–f) zinc coatings in simulated seawater after potentiodynamic polarization test. |
![]() | ||
Fig. 7 FESEM image and corresponding EDS pattern for the corrosion products on the surface of coarse-grained zinc coating. |
![]() | ||
Fig. 8 EDS elemental mappings for Zn, O and Cl on the surface of coarse-grained (a) and nanocrystalline (b) zinc coatings. |
![]() | ||
Fig. 9 XRD patterns for coarse-grained (CG) and nanocrystalline (NC) zinc coatings after 100 h of immersion in simulate seawater. |
Based on analysis results above, an isolated system of zinc coating, simulated seawater and air are used to simulate the natural corrosion behavior of zinc coatings (Fig. S1†). Since the environment is isolated, the oxygen content in the solution are lower than that in the air, indicating that the corrosion reaction of zinc coatings above the air/simulated seawater interface is more complete than that of zinc coatings below the interface under the same immersion time. Therefore, the coating and simulated seawater system below the air/simulated seawater interface can be used to simulate the earlier stage of corrosion; the coating and air system above the interface can be used to simulate the later stage of corrosion in the immersion test; and the coating and air system at the interface corresponds to the middle stage of corrosion.
After 100 h of immersion in this isolated system, the FESEM observation and the EDS analysis are carried out for coarse-grained and nanocrystalline zinc coatings, as shown in Fig. 10. Panels (a) and (d) are the surface morphologies of coarse-grained and nanocrystalline zinc coatings below air/simulated seawater interface, respectively; panels (b) and (e) are the surface morphologies of coarse-grained and nanocrystalline zinc coatings at the interface, respectively; and panels (c) and (f) are the surface morphologies of coarse-grained and nanocrystalline zinc coatings above the interface, respectively.
As shown in Fig. 10, both surfaces are covered with corrosion product layer. In the case of coarse-grained zinc coating, the corrosion behavior first takes place in the thickness direction of the coating (Fig. 10a) in the earlier stage of corrosion and gradually extends to most part of the coating surface (Fig. 10b), thereby forming a layer of complete corrosion product film on the surface of the coating (Fig. 10c) in the later stage of corrosion. It is noteworthy that there are some micro-cracks on the surfaces of corrosion product layer, as shown by the inset in Fig. 10c. As for nanocrystalline zinc coating, the surface has been completely covered with a uniform corrosion product layer, even in a very limited amount of oxygen environment (Fig. 10d). The corrosion product layer shows an approximate nano-pillars structure, as shown by the inset in Fig. 10d, and experiences the transition from nano-pillars to nano-wires with the progress of corrosion, thereby becomes more uniform, finer and denser in the middle and later stage of corrosion (as shown in Fig. 10e and f).
In order to verify the images displayed in Fig. 10c and f are true reflection of the surface morphologies of corrosion product layers in the later stage of corrosion and are not affected by oxidation reaction, the FESEM and EDS observations are also carried out for coarse-grained and nanocrystalline zinc coatings after 100 h of placement in the same isolate environment without any corrosive medium, as shown in Fig. S3.† Compared with the surface morphologies of freshly prepared coarse-grained and nanocrystalline zinc coatings (in Fig. 1), the surface morphologies of both coatings (Fig. S3a and S3c†) after 100 h of placement in this isolate environment have not significantly changed. The EDS results also indicate that both the coatings are almost no oxidation (Fig. S3b and S3d†). It implies that the surface morphologies displayed in Fig. 10c and f come from zinc coatings corrosion, and the results of FESEM observation are reliable.
A measurement of wetting property (Fig. 11) for the corrosion product films on the surface of coarse-grained and nanocrystalline zinc coatings in the later stage of corrosion indicates that, abovementioned morphology differences cause markedly larger contact angles for the corrosion product film of nanocrystalline zinc coating (d) than for the corrosion product film of coarse-grained zinc coating (b), coarse-grained zinc coating (a) and nanocrystalline zinc coating (c). According to the studies of Imaz et al.33 and Teschke et al.,40 materials with more hydrophobic character are typically more resistant against corrosion in aqueous environments. Hence, according to the correlation between the wettability of a given material and its anticorrosion performance, the corrosion product film of nanocrystalline zinc coating is more resistant against corrosion in aqueous environments.
The difference of formation mechanisms of corrosion product film between coarse-grained zinc coating and nanocrystalline zinc coating is attributed to the quantity and position variation of activity sites of zinc coatings with the reduction of grain size (as stated above). The volume fraction of grain boundary increases with the surface nanocrystallization of the coating, thus the number of the surface activity sites is increases, making the surface of nanocrystalline zinc coating rapidly form a protective corrosion product film compared to coarse-grained zinc coating during exposure to simulated seawater.
Moreover, EDS spectrums for corrosion product layer on the surface of zinc coatings (in Fig. 10) show that the films predominantly contain Zn and O. A summary of atomic oxygen content derived from EDS spectrums is also given in Fig. S4.† It can be seen that the atomic oxygen content of corrosion product film on the surface of nanocrystalline zinc coating is higher than that of corrosion product film on the surface of coarse-grained zinc coating below air/simulated seawater interface, indicating that corrosion reaction of nanocrystalline zinc coating is quicker than that of coarse-grained zinc coating in the earlier stage of corrosion. The surface of nanocrystalline zinc coating can rapidly form a protective corrosion product film compared to that of coarse-grained zinc coating, and inhibits the progress of corrosion reaction. Therefore the atomic oxygen content of coarse-grained zinc coating is higher than that of nanocrystalline zinc coating in the middle and later stages of corrosion.
To explain the natural corrosion behavior of coarse-grained and nanocrystalline zinc coatings in simulated seawater, EIS measurements are carried out at their respective open circuit potentials after 100 h of immersion. The impedance response of this system is presented in Fig. 12 and 13, respectively, which exemplify, the Bode (magnitude and phase angle plots) and Nyquist plots. Experimental data is also compared with the fitted results of equivalent circuit and shows good coincidence. The EIS spectrum of the corrosion product layer on nanocrystalline zinc coating is still fitted by the original equivalent circuit (as shown by the inset in Fig. 4). However, since micro-cracks appears on the corrosion product layer of coarse-grained zinc coating, the original equivalent circuit is not appropriate for simulate the zinc/solution corrosion system from the fitting results. Therefore, a new equivalent circuit is used to simulate the zinc/solution corrosion system of the corrosion product layer on coarse-grained zinc coating, as shown by the inset in Fig. 13. Here, Rs is the resistance corresponding to the ohmic resistance of the electrolyte, Rl1(Rl2) and Cl1(Cl2) represent the resistance and capacitance of porous corrosion product layer, Rct and Cdl represent the charge transfer resistance and double layer capacitance, and ZW is the Warburg impedance, respectively. Tables S2 and S3† give the fitted results of EIS spectra for the corrosion product layers of coarse-grained and nanocrystalline zinc coatings in simulated seawater, respectively.
![]() | ||
Fig. 12 Bode plots for the corroded surfaces of coarse-grained and nanocrystalline zinc coatings in simulated seawater after 100 h of immersion: (a) Bode magnitude plots and (b) Bode phase plots. |
Obviously, the impedance of the interface (Fig. 12a), the maximum phase angle (Fig. 12b) and the semicircle size (Fig. 13) of nanocrystalline zinc coating is bigger than that of coarse-grained zinc coating after 100 h of immersion in this system. Hence, it can be concluded that the corrosion product layer of nanocrystalline zinc coating exhibits higher resistance against corrosion than that of coarse-grained zinc coating. Different from preceding observation in Fig. 4, the Nyquist plot of coarse-grained zinc coating is composed of two depressed capacitive semicircles after 100 h of immersion in simulated seawater, suggesting that the corrosion mechanism of zinc coatings is changing. The high frequency semicircle is attributed to the charge transfer in combination with the corrosion products, while low frequency semicircle indicates a finite length diffusion process through a porous layer. This change is mainly ascribed to the formation of corrosion product layer during exposure to simulated seawater. As for nanocrystalline zinc coating, the Nyquist plot just exhibits single depressed capacitive semicircle at higher frequency, while low frequency semicircle evolves to a straight line with the reduction of grain sizes, indicating that the finite diffusion process of coarse-grained zinc coating gradually transforms into the semi-infinite diffusion process with the reduction of grain sizes. According to the fitted results of equivalent circuit (in Tables S2 and S3†), the Rct of corrosion product layers on the surfaces of coarse-grained and nanocrystalline zinc coatings are 47.14 and 86.89 Ω cm2, respectively, implying that the latter has higher resistance against corrosion than the former. Apparently, the corrosion product layer on the surface of nanocrystalline zinc coating should be more protective than that on the surface of coarse-grained zinc coating. The corrosion inhibition efficiency (η) of corrosion product layer on the surface of nanocrystalline zinc coating is calculated by the following equation:41
![]() | (6) |
The corrosion resistance of corrosion product layers on the surfaces of both zinc coatings is also evaluated through potentiodynamic polarization technique in simulated seawater, as shown in Fig. 14, with the electrochemical parameters (Ecorr, βa, βc, Rp and icorr) of samples presented in Table 3. These data clearly shows that the corrosion product layer of nanocrystalline zinc coating possesses higher resistance against corrosion than that of coarse-grained zinc coating. Compared to the polarization curves of zinc coating (in Fig. 5), a notable difference is that the corrosion potential (Ecorr) of corrosion product layer on the surface of nanocrystalline zinc coating is more positive than that on the surface of coarse-grained zinc coating. It implies that the corrosion product of nanocrystalline zinc coating is more stable than that of coarse-grained zinc coating in the same corrosion medium. From the above results, it is deduced that the corrosion product layer of nanocrystalline zinc coating has more effective corrosion inhibition than that of coarse-grained zinc in simulated seawater.
![]() | ||
Fig. 14 Polarization curves for the corroded surfaces of coarse-grained (a) and nanocrystalline (b) zinc coatings in simulated seawater after 100 h of immersion. |
Sample | Ecorr mV | βa mV dec−1 | βc mV dec−1 | Rp Ω cm2 | icorr μA cm−2 |
---|---|---|---|---|---|
CG | −1080 | 97.1 | 355.4 | 168.1 | 197.4 |
NC | −1040 | 100.4 | 334.9 | 320.0 | 105.0 |
(1) As for the electrochemical corrosion behavior of coarse-grained and nanocrystalline zinc coatings in simulated seawater, the better corrosion resistance of nanocrystalline zinc coating is attributed to the fact that grain refinement leads to the number increase in active atoms of the surface, accelerating the formation of zinc hydroxide chloride layer on the surface of nanocrystalline zinc coating. The insoluble pseudo-passive layers that cover the surface of corroded coatings inhibit corrosion further, thereby decrease the rate of zinc dissolution.
(2) The immersion test proves the corrosion product layer of nanocrystalline zinc coating has better corrosion resistance than that of coarse-grained zinc coating. The corrosion behaviors preferentially take place in the grain boundary of zinc coatings during exposure to simulated seawater. For the coarse-grained zinc coating, the corrosion behavior first takes place in the thickness direction of the coating and gradually extends to most part of the coating surface, thereby forms a layer of complete corrosion product film on the surface of the coating. In comparison with the natural corrosion behavior of coarse-grained zinc coating in simulated seawater, a relatively intact corrosion product layer is quickly formed on the surface of nanocrystalline zinc coating in the initial stage of the corrosion. The corrosion product layer experiences the transition from nano-pillars to nano-wires with the progress of corrosion reaction, thereby becomes finer, denser, more uniform, hydrophobic and corrosion resistive, inhibiting the coating from being corroded further.
(3) In summary, the corrosion behavior of zinc coating is dependent upon its crystalline texture, grain size and surface wetting property. Among these, grain size plays a more primary role in improving corrosion resistance property of the coating. The nanocrystalline structure enhances both the kinetics of passivation and the stability of corrosion product layer formed on zinc coating. It is hoped that the work could provide valuable information on corrosion and protection of steel and set the foundation for the further industrial application.
Footnote |
† Electronic supplementary information (ESI) available. See DOI: 10.1039/c5ra02777b |
This journal is © The Royal Society of Chemistry 2015 |