Single and double chain surfactant–cobalt(III) complexes: the impact of hydrophobicity on the interaction with calf thymus DNA, and their biological activities†
Selvakumar Veeralakshmia,
Selvan Nehruab,
Gopal Sabapathia,
Sankaralingam Arunachalam*a,
Ponnambalam Venuvanalingama,
Ponnuchamy Kumarc,
Chidambaram Anushad and
Vilwanathan Ravikumard
aSchool of Chemistry, Bharathidasan University, Tiruchirappalli 620024, Tamil Nadu, India. E-mail: arunasurf@yahoo.com; Fax: +91-431-2407043; Fax: +91-431-2407045; Tel: +91-431-2407053
bDepartment of Physical Chemistry, School of Chemical Sciences, University of Madras (Guindy Campus), Chennai 600025, Tamil Nadu, India
cDepartment of Environmental Biotechnology, School of Environmental Sciences, Bharathidasan University, Tiruchirappalli 620024, Tamil Nadu, India
dDepartment of Biochemistry, School of Life Sciences, Bharathidasan University, Tiruchirappalli 620024, Tamil Nadu, India
First published on 27th March 2015
Abstract
Developing surfactant based metal complexes as metallodrugs is a promising approach for which it is important to know the effect of their hydrophobic tail part on the interaction with biomacromolecules as well as on their biological activities. In this report we describe some surfactant–cobalt(III) complexes differing in their tail part and the effect of hydrophobicity of these complexes on their interaction with calf thymus DNA and on the cytotoxic activities. The obtained results along with molecular docking calculations show that the single chain surfactant–cobalt(III) complexes interact with DNA via groove binding and double chain surfactant–cobalt(III) complexes interact with DNA through partial intercalation. In tune with this, double chain systems show more anticancer activity as their hydrophobic tail part makes them effectively penetrate into the cell. So, this kind of tuning of the hydrophobicity of metallodrugs will lead to optimisation of the DNA binding and cytotoxicity behaviour.
Introduction
Spurred on by the success of platinum-based metallodrugs in chemotherapy, the market is still focusing on new advantageous metallodrugs that offer better viability and higher efficacy.1–4 In search of effective metallodrugs with reduced side effects against human diseases, researchers are attracted to cobalt based metallodrugs due to their behavior of lower toxicity and biological relevance to vitamin B12. Research on cobalt-based pharmaceuticals has a significant place in biomedical applications such as potential hypoxia-activated pro-drugs, chaperones of bioactive ligands to target tumours through bioreductive activation,5 higher inhibition of chymotrypsin-like activity in purified proteasomes as well as improved apoptotic induction in PC-3 cancer cells,6 artificial proteases, and HIV protease inhibitors.7Cobalamin is substituted together with folic acid in cancer chemotherapy because of proliferating cells require higher amounts of vitamin B12 than normal ones.8 Cobalt(III) complexes of the known antiulcer drug famotidine turned out to have greater antimicrobial activity against E. coli and M. lysodeikticus than the metal free drug.9 Moreover, several cobalt(II) 2-methylthionicotinate complexes of various N-heterocyclic ligands showed significant activity against bacterial strains and fungi.
Despite several approaches to design metallodrugs, surfactant based metallodrugs have a distinctive place due to their biologically relevant amphiphilic nature with inorganic function. To develop these types of metallosurfactants, primarily, it is important to know the effect of their hydrophilic and hydrophobic domains on the interactions with biomacromolecules along with the biological activities such as cytotoxicity, antimicrobial properties, antioxidant activities, etc., to address the optimisation of chemical entities to exert specific chemotherapeutic action in vitro and in vivo. In this category, hydrophilic domain is governed by nature of ligand and metal ion, charge on the complex, and similarly hydrophobic domain is governed by number of alkylamine chains, chain length, and overall shape of the metallosurfactants which is an important factor to the self-assembly behaviour.
In these aspects of drug designing, hydrophobicity of metallodrugs plays a major role in the process of penetration of cell membrane to precede cell death. Recently, it has been reported that cobalt complexes with optimum hydrophobicity penetrate the cell membrane easily prior to cell death.10 However, the impact of hydrophobicity of metallosurfactants on DNA binding and anticancer activities isn't still clear. Polymer–cobalt(III) complexes with hydrophobic ligands around the cobalt(III) metal centre favour the base stacking interactions via intercalation.11 Biimidazole containing cobalt(III) mixed ligand complexes interact with DNA through the groove via hydrogen bonding due to the presence of –NH in the ancillary ligand biimidazole, which favors hydrogen bonding with DNA base pairs.12 Cobalt(III) complexes could be candidates for DNA-binding reagents, as well as laying the foundation for the rational design of new useful DNA probes and effective inorganic complex nucleases. Complexes containing non-pyridyl ligands like bleomycin, mustard ligands etc., were also shown to be DNA photo cleavers.13,14 More recently, cobalt complexes of terpyridine ligands like bzimpy, ptpy cleave DNA photolytically.15
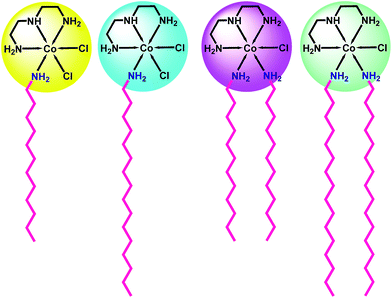
We aim to establish the structural foundation for the design of new surfactant metal complexes, which possess more potent DNA binding affinities and DNA cleaving tendencies. It is very important in biotechnological and biomedical applications, particularly for the possibility of using such systems for in vivo gene delivery and gene transfer.16 The interaction of DNA with surfactants mainly depends on surfactant features like size, charge, chain length, hydrophobicity, concentration, etc. Several reports have investigated the interaction of DNA with conventional surfactants but reports on surfactant–metal complexes are limited. Thus, the present study focuses on some single and double chain surfactant–cobalt(III) complexes (Fig. 1) and their interaction with DNA. The binding capability and nature of binding mode of interaction of surfactant–cobalt(III) complexes with CT-DNA was studied by UV-visible absorption, fluorescence, viscometry, circular dichroism techniques and measurement of zeta potential. In addition, the antiradical and anticancer properties of the complexes were studied in order to clarify the mechanism of biological activity.
Results and discussion
Interaction of surfactant–cobalt(iii) complexes with CT–DNA
The plot of percentage of relative absorbance of DNA in the absence and presence of complexes 1–4 are shown in Fig. 2. Generally, it is noted that the absorbance of DNA in the region of 200–300 nm decreases in the presence of surfactant–cobalt(III) complexes without shift in wavelength corresponds to 260 nm. The decreases in the absorption of DNA may be due to their helical stabilization whereas destabilization of DNA helix will result an increase in the absorption of DNA. The observed hypochromism with no shift in the absorbance maximum indicates absence of intercalation and it may be due to the existence of electrostatic, partial intercalation/groove binding between DNA and surfactant–cobalt(III) complexes.
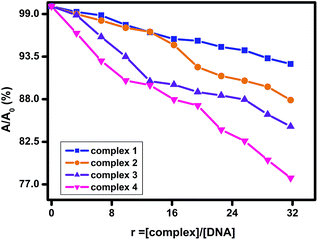 | ||
| Fig. 2 Plot of % relative absorbance of DNA (λmax = 269 nm) at various concentrations of complexes 1–4 (r = [complex]/[DNA]; [DNA] = 150 μM, [complex] = 48 μM), pH = 7.4. | ||
The equilibrium for the formation of complex between DNA and surfactant–cobalt(III) complexes is given by the following equation,
| DNA + Sur–Co(III) ⇌ DNA⋯Sur–Co(III) |
| Kapp = [DNA⋯Sur–Co(III)]/[DNA][Sur–Co(III)] |
| 1/[A − A0] = 1/[A∞ − A0] + 1/Kapp(A∞ − A0) [Sur–Co(III)] |
| Surfactant–cobalt(III) complexes | log![[thin space (1/6-em)]](https://www.rsc.org/images/entities/char_2009.gif) P65 P65 |
Kapp (103) (M−1) | KSV (103) (M−1) | Kapp (105) (M−1) | IC50 μM |
|---|---|---|---|---|---|
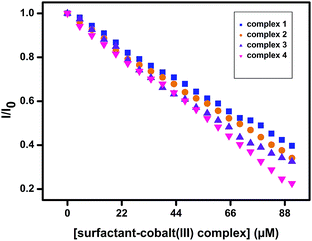
| Complex 1 | –1.23 | 3.1108 | 3.977 | 1.2771 | 296.88 |
| Complex 2 | –1.03 | 9.0052 | 4.597 | 1.4327 | 244.93 |
| Complex 3 | –0.94 | 14.318 | 4.835 | 1.5291 | 172.83 |
| Complex 4 | –0.86 | 58.743 | 5.813 | 1.7668 | 136.90 |
| I0/I = KSV[Q] + 1 |
 | ||
| Fig. 3 Stern–Volmer plot for the fluorescence quenching of EB–DNA by [surfactant–cobalt(III) complex] (1–4). | ||
Furthermore, the apparent binding constant (Kapp) values are obtained from the following equation,
| KEB[EB] = Kapp[Sur–Co(III)] |
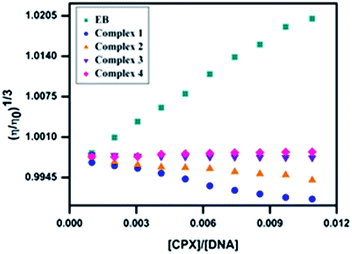 | ||
| Fig. 6 Effect of increasing the concentration of surfactant–cobalt(III) complexes 1–4 and EB on the relative viscosity of CT-DNA. | ||
Based on these changes in DNA viscosity it is clear that surfactant–cobalt(III) complexes interact with CT-DNA by groove binding/partial intercalation.
In the present study, the average hydrodynamic diameter of DNA in the absence and presence of surfactant–cobalt(III) complexes was investigated by DLS. Calf-thymus DNA shows narrow size distribution with an average hydrodynamic diameter of 354.1 nm. Upon addition of our surfactant–cobalt(III) complexes to DNA the average hydrodynamic diameter of the DNA was increased in the case of complexes 1–4 such as 588.2, 621.9, 977.2 and 1081 nm, respectively (Fig. S2†). Also, it exhibits bimodal distribution curve. These results suggest that addition of our surfactant–cobalt(III) complexes have changed the DNA from the elongated coil state to the compacted globule state, similar to the results were observed through viscosity studies. This indicates that the interaction between our surfactant complexes and DNA was not through intercalation but may be through partial intercalation/groove binding.
The docking significantly depends on the interaction between the ligand and DNA and so it will be useful to study the FMOs and band gaps (HOMO–LUMO gaps) of the surfactant–cobalt(III) complexes. To investigate the influence of the electron donating and withdrawing groups of the surfactant–cobalt(III) complexes, the molecular orbital energy levels for complexes 1–4 are used which are given in Table 1. The HOMO–LUMO gap mostly depends on nature of ligand coordinated to the metal atom. We observed the HOMO–LUMO energy gaps show over a range 3.211 eV–0.272 eV. The single chain surfactant–cobalt(III) complexes (1 and 2) show higher band gaps (3.211, 2.721 eV) than their corresponding double chain surfactant–cobalt(III) complexes (3 and 4) (0.898, 0.272 eV). The complex 4 has the lowest band gap (0.272 eV) due to longer double alkyl chain amine ligand coordinated to cobalt(III) atom. However the complex 1 shows higher band gap (3.211 eV), due to the presence of halogens coordinated to cobalt(III) metal atom. For complexes 3 and 4, one of the halogen atoms is replaced by alkyl amine ligand and the HOMO–LUMO energy gap decreases gradually due to metal–halogen π-back bonding. The frontier molecular orbitals of the complexes 1–4 are given in Fig. 8. It shows that the HOMO of the 1–4 are mainly localized on the single chain alkyl amine ligand, However the LUMO is eventually localized on cobalt, halogen and dien ligand. The nature of various segments of the complexes and their individual contributions towards HOMO and LUMO has been analysed using QMForge program.35 The whole molecule has been segmented into five fragments (cobalt atom, halogen, dien ligand and two alkyl amine ligand) and their corresponding percentage contributions are summarized in Table 2.
 | ||
| Fig. 8 Calculated highest occupied molecular orbital and lowest unoccupied molecular orbital of the complexes 1–4 at B3LYB/LAN2DZ (Co)/6-31g(d,p) level. | ||
| Complexes | HOMO − 3 | HOMO − 2 | HOMO − 1 | HOMO | LUMO | LUMO + 1 | LUMO + 2 | LUMO + 3 | Band gap (eV) |
|---|---|---|---|---|---|---|---|---|---|
| 1 | –10.014 | –9.878 | –9.715 | –9.361 | –6.150 | –5.85 | –3.646 | –2.966 | 3.211 |
| 2 | –9.578 | –9.524 | –9.415 | –8.871 | –6.150 | –5.850 | –3.646 | –2.966 | 2.721 |
| 3 | –10.721 | –10.694 | –10.476 | –10.476 | –9.578 | –9.578 | –9.388 | –6.748 | 0.898 |
| 4 | –10.204 | –10.177 | –9.769 | –9.769 | –9.497 | –9.285 | –6.694 | –6.231 | 0.272 |
The calculated values show that HOMO of the complexes 1–4 have main contribution from single alkyl amine chain (∼99.00%), While LUMO of the complexes 1–4 have main contribution from three fragments, namely ∼53.50% d(Co), ∼24.34% p(Cl) and ∼22.03% p(dien) (Table 3). The LUMO percentage contribution of cobalt is equal, but halogen and dien contribution is slightly different. Particularly the LUMO percentage contribution of the halogen fragment decreases (∼7.0%) upon replacing by one alkyl amine ligand.
| Complexes | Co | X | L1 | L2 | L3 | |
|---|---|---|---|---|---|---|
| a X = Cl, L1 = dien, L2 = L3 = alkyl amine chains. | ||||||
| 1 | HOMO | 0.07 | 0.03 | 0.05 | 99.84 | — |
| LUMO | 53.50 | 24.37 | 22.03 | 0.11 | — | |
| 2 | HOMO | 0.02 | 0.00 | 0.01 | 99.97 | — |
| LUMO | 53.51 | 24.34 | 22.04 | 0.11 | — | |
| 3 | HOMO | 0.16 | 0.01 | 0.06 | 99.30 | 0.47 |
| LUMO | 53.75 | 17.38 | 21.08 | 4.99 | 2.80 | |
| 4 | HOMO | 0.46 | 0.09 | 0.18 | 99.18 | 0.09 |
| LUMO | 53.92 | 17.16 | 20.90 | 3.15 | 4.87 | |
The molecular docking calculations were performed for complexes 1–4 with CT-DNA duplex of sequence d(CGCGAATTCGCG)2 dodecamer (PDB ID: 1BNA) and the most favourable docked poses are given in Fig. 9. As it can be seen from Fig. 9 complexes 1 and 2 could fit well into the minor groove of the CT-DNA with a binding site of three base pairs and the complexes 3 and 4 interact with CT-DNA through partial intercalation.
 | ||
| Fig. 9 Molecular docked model of complexes 1–4 with CT-DNA (PDB ID: 1BNA). | ||
The presence of a long alkyl chain in the complexes facilitates the stronger binding with CT-DNA. The complexes 3 and 4 have stronger binding energy when compared with the complexes 1 and 2, this is because the gain in additional stabilization is due to the presence additional alkyl chain. As a result the complexes 3 and 4 are well fitted with DNA via two extended hydrophobic alkyl chains.39,40 This excellently agrees with the outcome of the experiments. Thus, our molecular modeling studies throw light on the binding modes by which these complexes interact with CT DNA and complement the experimental observations.
| Complexes | EC50 concentration (mM) | ||
|---|---|---|---|
| DPPH | ABTS | NO | |
| Precursor | 12.06 ± 0.05 | 2.391 ± 0.03 | 2.817 ± 0.04 |
| Complex – 1 | 4.682 ± 0.03 | 1.091 ± 0.04 | 1.418 ± 0.03 |
| Complex - 2 | 2.694 ± 0.04 | 0.950 ± 0.05 | 1.069 ± 0.02 |
| Complex - 3 | 1.905 ± 0.02 | 0.711 ± 0.02 | 0.757 ± 0.04 |
| Complex – 4 | 1.476 ± 0.03 | 0.597 ± 0.03 | 0.603 ± 0.02 |
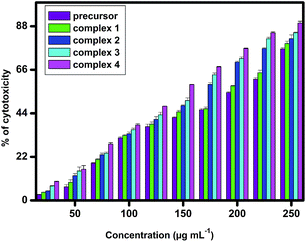 | ||
| Fig. 11 In vitro cytotoxicity against A549 cells using precursor and surfactant–cobalt(III) complexes 1–4. | ||
It is interesting to note that, the IC50 concentration of surfactant–cobalt(III) complexes 1–4 ranges between 296.88 μM for complex 1, 244.93 μM for complex 2, 172.83 μM for complex 3 and 136.90 μM for complex 4 respectively. However, the precursor complex (IC50 – 645.34 μM) showed a reduced activity against A549 lung cancer cell line. It is a clear evident from the study that, amphiphilic nature of surfactant–cobalt(III) complexes disrupts the cell membrane and eventually kills the cells.40 Moreover, the double chain surfactant–cobalt(III) complexes 4 & 3 hinder the growth of cancer cells effectively than single chain surfactant–cobalt(III) complexes 2 & 1. This infers the level of cellular damage inflicted by these complexes depending upon the number of alkyl chain and its length.39 Besides one of our complexes, complex 4 shows better activity against A-549 lung cancer cell line than that of cisplatin, as has been reported in the literature (cisplatin IC50 = 45.88 μg mL−1, i.e., 152.9 μM).53
However, an extensive study is required to demonstrate the progression of apoptosis induced by surfactant–cobalt(III) complexes.
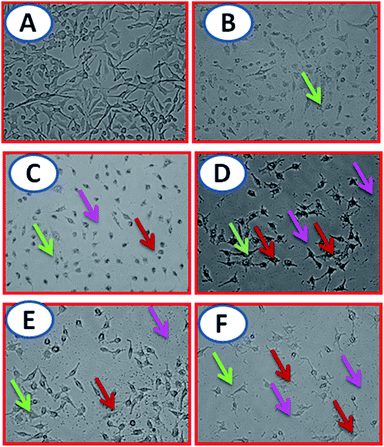
Phase-contrast microscopic study. Phase-contrast microscopic imaging was performed to differentiate the cells based on their morphology and structure using their refractive index.54 This experiment is fast, stable and accurate to validate anticancer compounds based upon cells morphology. In the present study, the untreated cells were normal and show no irregular morphology Fig. 12 (A-control). Meanwhile, surfactant–cobalt(III) complexes 1–4 treated A549 lung cell line showed cytomorphological changes inferring the loss of membrane integrity, cytoplasmic condensation and cell clumping55 Fig. 12 (B – precursor, C, D, E, F – surfactant–cobalt(III) complexes 1–4).
Trypan blue exclusion assay. Trypan blue exclusion assay was carried to differentiate viable and non-viable cells based upon the intake of trypan blue stain.56 Trypan blue selectively traverse the membrane of dead cells and appear distinctive blue color under a fluorescent microscope. Meanwhile, the live cells exclude trypan blue and appear normal without any morphological changes.57 In the present study, the control cells expel trypan blue without losing its membrane integrity Fig. 13 (A – control). However, surfactant–cobalt(III) complexes treated A549 lung cancer cell line uptake trypan blue selectively via cell membrane inferring the loss cell membrane integrity and thereby emit blue as shown in the Fig. 13 (B – precursor, C, D, E, F – surfactant–cobalt(III) complexes 1–4).58,59
 | ||
| Fig. 13 Cell death was measured by trypan blue staining (A = control, B = precursor & C, D, E, F – surfactant–cobalt(III) complexes (1–4)). | ||
Reactive oxygen species (ROS). The intracellular – reactive oxygen species are chemically important reactive molecules containing oxygen that regulates normal cellular process.60 However, disregulation of ROS generation dramatically affects cell structure and may result in cellular damage leading to a wide range of human diseases.61 Meanwhile, cancer cells are possessed to have decreased ROS levels as compared to untreated cells Fig. 14 (A – control). Hence, in the present study ROS levels in A549 lung cancer cell line are probed by using an oxidant sensitive fluorescent dye. Dichloro-dihydro-fluorescein diacetate (DCFH-DA) is a non-polar cell-permeable fluorescent dye that can be converted into polar DCFH by cellular esterase.62 However, this DCFH is undetectable under microscope and requires intracellular ROS to switch them into a highly fluorescence emitting DCF. Meanwhile, our results indicate that surfactant–cobalt(III) complexes treated cells are shown to fluorescence rather than no fluorescence was observed in untreated cells.
 | ||
| Fig. 14 Reactive oxygen species level in A549 cells against surfactant–cobalt(III) complexes 1–4 (A = control, B = precursor & C, D, E, F – surfactant–cobalt(III) complexes 1–4). | ||
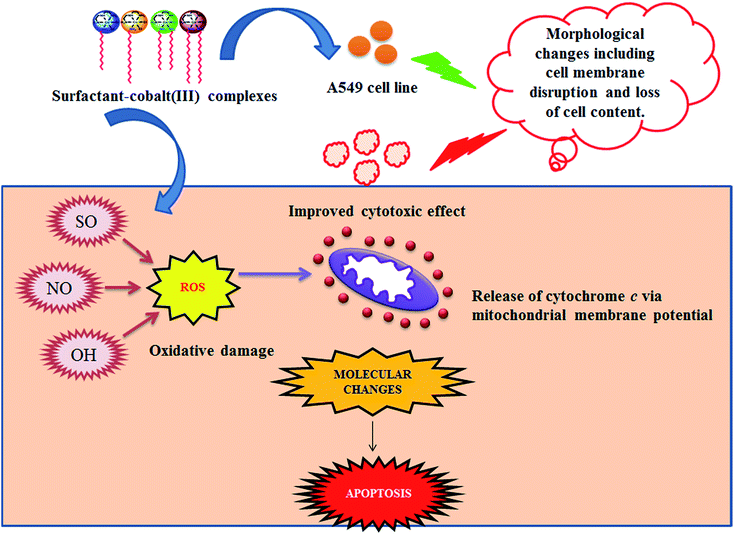
Altogether, ROS from mitochondria may oxidize mitochondrial membrane proteins by changing mitochondrial outer membrane permeabilization and thereby leads to disruption of mitochondrial membrane potential, which contributes towards the release of cytochrome c and apoptosis.63 This infers surfactant–cobalt(III) complexes stimulate ROS induced apoptosis in A549 lung cell line as the number of alkyl chain and its length increases Fig. 14 (B – precursor, C, D, E, F – surfactant–cobalt(III) complexes 1–4).
Mitochondrial membrane potential (MMP). The dysfunctions of mitochondria have been described to play a key role in the induction of apoptosis by disruption of mitochondrial membrane potential to release the mitochondrial apoptogenic factors and decreased ATP generation within the cell.64 Hence, the effect of surfactant–cobalt(III) complexes on the mitochondrial membrane potential of A549 lung cancer cell line was assessed by using Rhodamine 123 dye. This dye is a cationic fluorescent dye specifically label respiring mitochondria and uptake them by negative membrane potential.
However, the loss of mitochondrial membrane potential leads to the reduced uptake of dye inferring no fluorescence emission. As expected, surfactant–cobalt(III) complexes treated A459 lung cancer cell line showed no fluorescence Fig. 15 (B – precursor, C, D, E, F – surfactant–cobalt(III) complexes 1–4). Meanwhile, the untreated cells as control are well enough to emit fluorescent emission inferring healthy mitochondria Fig. 15 (A – control). This suggests that surfactant–cobalt(III) complexes are able to induce apoptosis against A549 lung cancer cell line (Fig. 16). Moreover, a detailed study will be performed in future to understand molecular mechanism involved in the killing effect of A549 cancer cell line.
Conclusion
In this work, difference in the hydrophobicity among some single and double chain surfactant–cobalt(III) complexes due to the presence of various chain length and number of chain, has been taken into account to analyse the impact on the DNA binding, antioxidant and anticancer properties of these complexes. The results show that hydrophobicity of surfactant metal complexes increases with increasing their chain length and number of chain, thereby increases the binding affinity with DNA and cell membrane. Further it is noted that, double chain surfactant–cobalt(III) complexes interact strongly with DNA than that of single chain surfactant–cobalt(III) complexes due to their more hydrophobic nature which leads to effective cell penetration into the cell membrane to show potent anticancer activities. The molecular docking results clearly show that the complexes 1 and 2 could fit well into the minor groove of the CT-DNA with a binding site of three base pairs and the complexes 3 and 4 interact with CT-DNA through partial intercalation. The presence of a long alkyl chain ligand in the complexes facilitates the stronger binding with CT-DNA. Hence, the present findings will create new avenues towards the use of hydrophobic metallodrugs for various therapeutic applications.Experimental section
Materials and methods
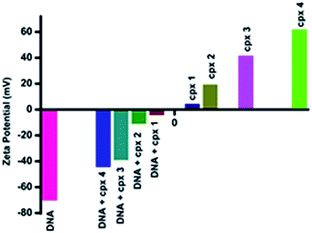
The single and double chain surfactant–cobalt(III) complexes (1–4) were available from our previous studies which we have reported.65 Calf thymus DNA was purchased from Sigma-Aldrich, Germany and was used as received. Spectroscopic titrations involving surfactant–cobalt(III) complexes with DNA were carried out in the phosphate buffer saline (PBS) at room temperature. Purity of the calf thymus DNA in buffer medium was checked by observing the ratio of UV absorbance at 260 and 280 nm as A260/A280 > 1.9, indicating that the DNA was adequately free from protein impurities.66,67 A549 cell line obtained from the National Centre for Cell Science, Pune, India. Cells were cultured in Dulbecco's modified Eagle's medium (DMEM: Hi Media Laboratories Mumbai, India), supplemented with 10% fetal bovine serum and 1% penicillin/streptomycin (Hi Media Laboratories Mumbai, India) in a 5% CO2 humidified atmosphere at 37°C.Absorption measurements were performed on Shimadzu UV-1800, UV-Vis spectrophotometer using cuvettes of 1 cm path length and fluorescence experiments were carried out on a thermostatic bath coupled JASCO FP650 spectrofluorometer using a 1 cm quartz cuvette. Circular dichroism spectra were recorded on a JASCO-J810 spectropolarimeter with a cylindrical cuvette of 0.1 cm path length. Viscosity measurements were carried out in an Ubbelohde viscometer maintained at a constant temperature of 29 ± 0.1 °C. The average size distribution of DNA and DNA–surfactant–cobalt(III) complexes have been characterized by means of dynamic light scattering measurements. Zeta potential measurements of DNA DNA–surfactant–cobalt(III) complexes were performed on a Zeta Sizer Nanosizer 90 ZS (Malvern Instruments, U.K) equipped with He–Ne laser beam at a wavelength of 633.8 nm and the data were analysed in an automatic mode.
DNA binding experiments
DNA binding experiments were carried out at the temperature of 25 ± 0.2 °C. The concentration of CT-DNA was determined by electronic absorption spectroscopy using its known molar extinction coefficient at 260 nm (6600 M−1 cm−1)67 DNA stock solutions were stored at 4 °C and employed after no more than 4 days. For spectroscopic studies, surfactant–cobalt(III) complex samples were dissolved in PBS (pH 7.4) and their concentration was fixed based on the cobalt analysis. Absorption titration experiments were performed at pH 7.4 by keeping the concentration of DNA (150 μM) while gradually increasing the concentration of complex (1 mM) (to give a final concentration of 48 μM). While measuring the absorption spectra, an equal amount of complex was added to both the sample solution and the reference solution to eliminate the absorption due to DNA itself. The resulting solutions were allowed to equilibrate for 5 min before the absorption spectra were recorded. For competitive binding studies, DNA was pre-treated with ethidium bromide (EB) for 10 min, which is used to investigate whether the compound could displace bound EB from the DNA–EB complex by the addition of the solution of the respective complexes to the phosphate buffer of the DNA–EB mixture. Emission spectra were recorded between 500 and 700 nm at room temperature on exciting samples at 450 nm, by the addition of surfactant–cobalt(III) complex solution (1 mM) (to give a final concentration of 48 μM) to a sample containing 10 μM EB and 150 μM CT-DNA in phosphate buffer, pH = 7.4. Before measurements were taken, the mixture was shaken up and allowed to stand for 5 min, and then the fluorescence emission spectra were recorded. CD spectra of CT-DNA (100 μM) before and after addition of surfactant–cobalt(III) complexes 1–4 (48 μM) were recorded in phosphate buffer. Each sample solution was scanned in the range of 200–320 nm, and its final CD spectra were generated after averaging three scans and subtracting the buffer background. Viscosity measurements were carried out in an Ubbelohde viscometer maintained at a constant temperature of 29 ± 0.1 °C. The viscosity of CT-DNA (100 μM) in the absence and presence of complexes was measured in phosphate buffer. Flow time was measured using a digital stopwatch, and each sample was measured in triplicated for accuracy, and an average flow time was calculated. Data were presented as (η/η0)1/3 versus the [surfactant–cobalt(III) complex]/[DNA], where η0 and η represent the viscosity of DNA solution in the absence and presence of the complexes, respectively.67,68 The relative specific viscosity was calculated according to the relation η = (t − t0)/t0, where t is the flow time of sample containing CT-DNA and t0 that of buffer alone.Computational details
The ground-state geometry of the molecules were fully optimized at the B3LYP level using the G09W program.69 The geometries of the complexes under study were optimized using standard 6-31g(d,p) basis set for N, C, Cl and H elements and LANL2DZ for cobalt.70,71 Docking calculations, and identification of binding sites of the biomolecules have performed using HEX 6.3 software.72 The coordinates of metal complexes were taken from their optimized structure as a mol file and were converted to pdb format using Gauss View 5.0 software. The crystal structure of B-DNA (PDB ID: 1BNA) has been retrieved from the protein data bank. All possible poses have been considered as starting points and the docking analysis was performed. The default parameters were used for the docking calculation. Visualization of the docked systems has been further analyzed with PyMOL software package.72Antioxidant assays
Reducing power
The reducing ability of the metal complexes was determined according to the methodology adopted by Oyaizu et al. 1986.76 To achieve this, various concentration (0–24 mM) of complexes/standard were made upto 0.5 mL using 20 mM phosphate buffer. To this mixture, 0.1% of potassium hexacyanoferrate (0.5 mL) was added and incubated at 50 °C for 20 min in a water bath. After incubation, 0.5 mL of 10% TCA was added to terminate the reaction followed by discarding the lower portion after centrifugation at 5000 rpm for 20 min. The upper portion of the reaction mixture was blended with distilled water (1 mL) and 0.01% of ferric chloride (0.1 mL) solution. The mixture was kept undisturbed for 15 min and the optical density at 799 nm was measured against the blank.In vitro anticancer activity
Morphological studies
Acknowledgements
The authors are grateful to the UGC-SAP & COSIST and DST-FIST programmes of the Department of Chemistry, Bharathidasan University. S.V. acknowledges the UGC-RFSMS for financial support (Junior Research Fellowship). SA thanks the sanction of research schemes from funding agencies; CSIR [grant no. 01(2461)/11/EMR-II] and UGC [grant no. 41-223/2012(SR)]. P.V. thanks the Council of Scientific and Industrial Research (CSIR) for the award of an Emeritus Scientistship (award letter no. 21(0936)/12/EMR-II) and the Department of Science and Technology (DST), India for a Major Research Project (ref. no. SB/S1/PC-52/2012). The authors thanks Dr K. Jeganathan, Professor and coordinator, Centre for Nanoscience and Nanotechnology, Bharathidasan University for DLS measurements. The author thanks Dr A. Antony Joseph Velanganni, Assistant Professor, Department of Biochemistry, Bharathidasan University for fluorescence microscope.References
- S. P. Fricker, Dalton Trans., 2007, 4903–4917 RSC.
- E. R. Jamieson and S. J. Lippard, Chem. Rev., 1999, 99, 2467–2498 CrossRef CAS PubMed.
- R. W.-Y. Sun, D.-L. Ma, E. L.-M. Wong and C.-M. Che, Dalton Trans., 2007, 4884–4892 Search PubMed.
- I. Kostova, Curr. Med. Chem., 2006, 13, 1085–1107 CrossRef CAS.
- S. Osinsky, I. Levitin, L. Bubnovskaya, A. Sigan, I. Ganusevich, A. Kovelskaya, N. Valkovskaya, L. Campanella and P. Wardman, Exp. Oncol., 2004, 26, 140–144 CAS.
- B. A. Teicher, M. J. Abrams, K. W. Rosbe and T. S. Herman, Cancer Res., 1990, 50, 6971–6975 CAS.
- M. D. Hall, T. W. Failes, N. Yamamoto and T. W. Hambley, Dalton Trans., 2007, 3983–3990 RSC.
- T. F. Silva, L. M. Martins, M. F. C. G. da Silva, A. R. Fernandes, A. Silva, P. M. Borralho, S. Santos, C. M. Rodrigues and A. J. Pombeiro, Dalton Trans., 2012, 41, 12888–12897 RSC.
- D. U. Miodragović, G. A. Bogdanović, Z. M. Miodragović, M. Đ. Radulović, S. B. Novaković, G. N. Kaluđerović and H. Kozłowski, J. Inorg. Biochem., 2006, 100, 1568–1574 CrossRef PubMed.
- S. Jagadeesan, V. Balasubramanian, P. Baumann, M. Neuburger, D. Häussinger and C. G. Palivan, Inorg. Chem., 2013, 52, 12535–12544 CrossRef CAS PubMed.
- S. Nehru, S. Arunachalam, R. Arun and K. Premkumar, J. Biomol. Struct. Dyn., 2013, 1–13 Search PubMed.
- R. Indumathy, T. Weyhermüller and B. U. Nair, Dalton Trans., 2010, 2087–2097 RSC.
- C. Sastri, D. Eswaramoorthy, L. Giribabu and B. G. Maiya, J. Inorg. Biochem., 2003, 94, 138–145 CrossRef CAS.
- E. T. Farinas, J. D. Tan and P. K. Mascharak, Inorg. Chem., 1996, 35, 2637–2643 CrossRef CAS PubMed.
- V. G. Vaidyanathan and B. U. Nair, J. Inorg. Biochem., 2003, 94, 121–126 CrossRef CAS.
- G. W. Walker, R. J. Geue, A. M. Sargeson and C. A. Behm, Dalton Trans, 2003, 2992–3001 RSC.
- S. Ramakrishnan, E. Suresh, A. Riyasdeen, M. A. Akbarsha and M. Palaniyandavar, Dalton Trans., 2011, 40, 3245–3256 RSC.
- Z. A. Siddiqi, P. K. Sharma, M. Shahid and M. Khalid, J. Photochem. Photobiol., B, 2013, 125, 171–178 CrossRef CAS PubMed.
- Z.-H. Xu, F.-J. Chen, P.-X. Xi, X.-H. Liu and Z.-Z. Zeng, J. Photochem. Photobiol., A, 2008, 196, 77–83 CrossRef CAS PubMed.
- E. C. Long and J. K. Barton, Acc. Chem. Res., 1990, 23, 271–273 CrossRef CAS.
- H. A. Benesi and J. Hildebrand, J. Am. Chem. Soc., 1949, 71, 2703–2707 CrossRef CAS.
- J. Olmsted III and D. R. Kearns, Biochemistry, 1977, 16, 3647–3654 CrossRef.
- B. C. Baguley and M. Le Bret, Biochemistry, 1984, 23, 937–943 CrossRef CAS.
- J. R. Lakowicz and G. Weber, Biochemistry, 1973, 12, 4161–4170 CrossRef CAS.
- G. Psomas, J. Inorg. Biochem., 2008, 102, 1798–1811 CrossRef CAS PubMed.
- K. D. Karlin, B. I. Cohen, J. C. Hayes, A. Farooq and J. Zubieta, Inorg. Chem., 1987, 26, 147–153 CrossRef CAS.
- N. Shahabadi, S. Kashanian and F. Darabi, Eur. J. Med. Chem., 2010, 45, 4239–4245 CrossRef CAS PubMed.
- K. Karidi, A. Garoufis, N. Hadjiliadis and J. Reedijk, Dalton Trans., 2005, 728–734 RSC.
- S. Mahadevan and M. Palaniandavar, Inorg. Chem., 1998, 37, 693–700 CrossRef CAS.
- J. M. Kelly, A. B. Tossi, D. J. McConnell and C. OhUigin, Nucleic Acids Res., 1985, 13, 6017–6034 CrossRef CAS PubMed.
- S. Satyanarayana, J. C. Dabrowiak and J. B. Chaires, Biochemistry, 1992, 31, 9319–9324 CrossRef CAS.
- D.-L. Ma, C.-M. Che, F.-M. Siu, M. Yang and K.-Y. Wong, Inorg. Chem., 2007, 46, 740–749 CrossRef CAS PubMed.
- R. S. Dias, J. Innerlohinger, O. Glatter, M. G. Miguel and B. Lindman, J. Phys. Chem. B, 2005, 109, 10458–10463 CrossRef CAS PubMed.
- C. Cheng and S.-Y. Ran, Sci. World J., 2014, 863049 Search PubMed.
- A. Tenderholt, QMForge: A Program to Analyze Quantum Chemistry Calculations, Version 2.3.2, http://qmforge.sourceforge.net Search PubMed.
- R. Rohs, I. Bloch, H. Sklenar and Z. Shakked, Nucleic Acids Res., 2005, 33, 7048–7057 CrossRef CAS PubMed.
- M. Baginski, F. Fogolari and J. M. Briggs, J. Mol. Biol., 1997, 274, 253–267 CrossRef CAS PubMed.
- E. M. Proudfoot, J. P. Mackay and P. Karuso, Biochemistry, 2001, 40, 4867–4878 CrossRef CAS PubMed.
- K. Nagaraj, G. Velmurugan, S. Sakthinathan, P. Venuvanalingam and S. Arunachalam, Dalton Trans., 2014, 43, 18074–18086 RSC.
- J. Lakshmipraba, S. Arunachalam, R. V. Solomon, P. Venuvanalingam, A. Riyasdeen, R. Dhivya and M. A. Akbarsha, J. Biomol. Struct. Dyn., 2014, 1–15 Search PubMed.
- C. A. Rice-Evans, N. J. Miller and G. Paganga, Free Radicals Biol. Med., 1996, 20, 933–956 CrossRef CAS.
- D.-S. Lee, Y.-S. Cho and J.-Y. Je, Fish. Aquat. Sci., 2013, 16(4), 229–235 CAS.
- M. R. Karekal, V. Biradar and M. B. H. Mathada, Bioinorg. Chem. Appl., 2013, 2013, 315972 Search PubMed.
- D. S. Raja, N. S. Bhuvanesh and K. Natarajan, Dalton Trans., 2012, 4365–4377 RSC.
- D. S. Raja, N. Bhuvanesh and K. Natarajan, Inorg. Chem., 2011, 50, 12852–12866 CrossRef CAS PubMed.
- E. R. Milaeva, D. B. Shpakovsky, Y. A. Gracheva, S. I. Orlova, V. V. Maduar, B. N. Tarasevich, N. N. Meleshonkova, L. G. Dubova and E. F. Shevtsova, Dalton Trans., 2013, 6817–6828 RSC.
- K. Ponnuchamy, S. Singaravelu and G. Munisamy, RSC Adv., 2014, 4, 26787–26795 Search PubMed.
- S. B. Kedare and R. Singh, J. Food Sci. Technol., 2011, 48, 412–422 Search PubMed.
- J. D. Aguirre, A. M. Angeles-Boza, A. Chouai, J.-P. Pellois, C. Turro and K. R. Dunbar, J. Am. Chem. Soc., 2009, 131, 11353–11360 Search PubMed.
- S. Moncada, R. Palmer and E. Higgs, Pharmacol. Rev., 1991, 43, 109–142 Search PubMed.
- K. H. D. Reddy, S.-M. Lee, K. Seshaiah and R. K. Babu, J. Serb. Chem. Soc., 2013, 78, 229–240 Search PubMed.
- P. Kumar, S. Senthamilselvi, M. Govindaraju and R. Sankar, RSC Adv., 2014, 4, 46157–46163 Search PubMed.
- M. D. Altıntop, A. Özdemir, G. Turan-Zitouni, S. Ilgın, Ö. Atlı, R. Demirel and Z. A. Kaplancıklı, Eur. J. Med. Chem., 2015, 92, 342–352 Search PubMed.
- B. Joshi, I. Barman, N. C. Dingari, N. Cardenas, J. S. Soares, R. R. Dasari and S. Mohanty, Sci. Rep., 2013, 3, 2822 Search PubMed.
- G. Popescu, Quantitative phase imaging of cells and tissues, McGraw Hill Professional, 2011 Search PubMed.
- G. I. Evan and K. H. Vousden, Nature, 2001, 411, 342–348 Search PubMed.
- R. A. Tobey, H. A. Crissman and P. M. Kraemer, J. Cell Biol., 1972, 54, 638–645 Search PubMed.
- J. R. Tennant, Transplantation, 1964, 2, 685–694 Search PubMed.
- S. A. Altman, L. Randers and G. Rao, Biotechnol. Prog., 1993, 9, 671–674 Search PubMed.
- P. Sharma, A. B. Jha, R. S. Dubey and M. Pessarakli, J. Bot., 2012, 2012, 217037 Search PubMed.
- M. Benhar, D. Engelberg and A. Levitzki, EMBO Rep., 2002, 3, 420–425 Search PubMed.
- R. P. Rastogi, S. P. Singh, D.-P. Häder and R. P. Sinha, Biochem. Biophys. Res. Commun., 2010, 397, 603–607 Search PubMed.
- J. M. Suski, M. Lebiedzinska, M. Bonora, P. Pinton, J. Duszynski and M. R. Wieckowski, in Mitochondrial Bioenergetics, Springer, 2012, pp. 183–205 Search PubMed.
- L. C. Green, D. A. Wagner, J. Glogowski, P. L. Skipper, J. S. Wishnok and S. R. Tannenbaum, Anal. Biochem., 1982, 126, 131–138 Search PubMed.
- S. Veeralakshmi, S. Nehru, S. Arunachalam, P. Kumar and M. Govindaraju, Inorg. Chem. Front., 2014, 1, 393–404 Search PubMed.
- Y. Gultneh, A. R. Khan, D. Blaise, S. Chaudhry, B. Ahvazi, B. B. Marvey and R. J. Butcher, J. Inorg. Biochem., 1999, 75, 7–18 Search PubMed.
- G. Cohen and H. Eisenberg, Biopolymers, 1969, 8, 45–55 Search PubMed.
- Y. Ma, G. Zhang and J. Pan, J. Agric. Food Chem., 2012, 60, 10867–10875 Search PubMed.
- M. J. Frisch, G. W. Trucks, H. B. Schlegel, G. E. Scuseria, M. A. Robb, J. R. Cheeseman, G. Scalmani, V. Barone, B. Mennucci, G. A. Petersson, H. Nakatsuji, M. Caricato, X. Li, H. P. Hratchian, A. F. Izmaylov, J. Bloino, G. Zheng, J. L. Sonnenberg, M. Hada, M. Ehara, K. Toyota, R. Fukuda, J. Hasegawa, M. Ishida, T. Nakajima, Y. Honda, O. Kitao, H. Nakai, T. Vreven, J. A. Montgomery Jr, J. E. Peralta, F. Ogliaro, M. Bearpark, J. J. Heyd, E. Brothers, K. N. Kudin, V. N. Staroverov, T. Keith, R. Kobayashi, J. Normand, K. Raghavachari, A. Rendell, J. C. Burant, S. S. Iyengar, J. Tomasi, M. Cossi, N. Rega, J. M. Millam, M. Klene, J. E. Knox, J. B. Cross, V. Bakken, C. Adamo, J. Jaramillo, R. Gomperts, R. E. Stratmann, O. Yazyev, A. J. Austin, R. Cammi, C. Pomelli, J. W. Ochterski, R. L. Martin, K. Morokuma, V. G. Zakrzewski, G. A. Voth, P. Salvador, J. J. Dannenberg, S. Dapprich, A. D. Daniels, O. Farkas, J. B. Foresman, J. V. Ortiz, J. Cioslowski and D. J. Fox, Gaussian 09, Revision B. 01, Gaussian, Inc., Wallingford CT, 2010 Search PubMed.
- D. Mustard and D. W. Ritchie, Proteins: Struct., Funct., Bioinf., 2005, 60, 269–274 Search PubMed.
- Y. Yang, M. N. Weaver and K. M. Merz Jr, J. Phys. Chem. A, 2009, 113, 9843–9851 Search PubMed.
- W. L. DeLano, The PyMOL Molecular Graphics System, 2002, http://www.pymol.org Search PubMed.
- Y. Zou, Z.-J. Qian, Y. Li, M.-M. Kim, S.-H. Lee and S.-K. Kim, J. Agric. Food Chem., 2008, 56, 7001–7009 Search PubMed.
- R. Re, N. Pellegrini, A. Proteggente, A. Pannala, M. Yang and C. Rice-Evans, Free Radicals Biol. Med., 1999, 26, 1231–1237 Search PubMed.
- J. S. Beckman and W. H. Koppenol, Am. J. Physiol.: Cell Physiol., 1996, 40, C1424 Search PubMed.
- M. Oyaizu, Jpn. J. Nutr., 1986, 44(6), 307–315 Search PubMed.
- T. Mosmann, J. Immunol. Methods, 1983, 65, 55–63 Search PubMed.
- J.-P. Yuan, G.-H. Wang, H. Ling, Q. Su, Y.-H. Yang, Y. Song, R.-J. Tang, Y. Liu and C. Huang, World J. Gastroenterol., 2004, 10, 2731–2734 Search PubMed.
- R. G. Azrak, C. L. Frank, X. Ling, H. K. Slocum, F. Li, B. A. Foster and Y. M. Rustum, Mol. Cancer Ther., 2006, 5, 2540–2548 Search PubMed.
- Z. Wang, Y. Liu and Y. Cui, Cell Biol. Int., 2005, 29, 489–496 Search PubMed.
- L. V. Johnson, M. L. Walsh and L. B. Chen, Proc. Natl. Acad. Sci. U. S. A., 1980, 77, 990–994 Search PubMed.
Footnote |
| † Electronic supplementary information (ESI) available. See DOI: 10.1039/c5ra02763b |
| This journal is © The Royal Society of Chemistry 2015 |

