Development of a novel nitrite electrochemical sensor by stepwise in situ formation of palladium and reduced graphene oxide nanocomposites

Li Fua, Shuhong Yub, Lachlan Thompsona and Aimin Yu*a
aDepartment of Chemistry and Biotechnology, Faculty of Science, Engineering and Technology, Swinburne University of Technology, Hawthorn, VIC 3122, Australia. E-mail: aiminyu@swin.edu.au
bDivision of Nanomaterials and Chemistry, Hefei National Laboratory for Physical Sciences at Microscale, Department of Chemistry, University of Science and Technology of China, Hefei, Anhui 230026, P. R. China

Received 11th February 2015 , Accepted 24th April 2015

First published on 24th April 2015


Abstract

In this paper, a novel and sensitive electrochemical nitrite sensor was prepared by in situ electroless deposition of Pd nanoparticles and reduced graphene oxide (RGO) stepwisely on a glassy carbon electrode. The deposition process was very fast and the amount of Pd/RGO deposited on the electrode was well controlled by the number of the deposition cycle. The fabrication process was monitored by UV-vis spectroscopy, and the as prepared composites were characterized by FTIR, Raman spectroscopy, XRD and SEM. The results confirmed the successful formation of Pd and the chemical reduction of graphene oxides. Moreover, the incorporation of Pd in between RGO sheets effectively prevented the agglomeration of RGO. The Pd/RGO modified electrode exhibited significant enhancement to the oxidation of nitrite with increased current response and reduced over-potential which was a result of the synergistic catalytic effect of RGO and Pd nanoparticles. The influence of various experimental parameters on the detection of nitrite was studied in detail. Under optimum conditions, the developed nitrite sensor had a linear response in the concentration range of 1–1000 μM and a detection limit of 0.23 μM. Additionally, the fabricated nitrite sensor showed excellent selectivity, reproducibility and stability.
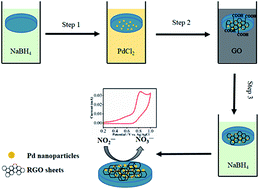

1. Introduction

Quantitative analysis and detection of nitrite (NO2) has attracted increasing attention in the past decades because nitrites can interact with amines to form carcinogenic nitrosamines and oxidize hemoglobin to methemoglobin, which causes health problems known as methemoglobinemia.1,2 It is worth noting that nitrite is a substance commonly used as a preservative, dyeing agent, fertilizer and food additive. Therefore, it is necessary to develop reliable methods for the detection and monitoring of nitrite. Till now, several techniques have been established for detecting nitrite, such as spectrophotometry,3 chemiluminescence,4 spectrofluorimetry and electrochemical methods.5–7 However, most techniques have drawbacks such as using toxic reagents, requiring time-consuming sample preparation process, and suffering from interference effect. Among them, the electrochemical method has attracted increasing attention due to its fast procedure, low cost, low detection limit and high accuracy.8,9 However, the electrochemical oxidation of nitrite at most common electrodes suffers large overpotentials. Therefore, the sensitivity and accuracy of the electrode could be inhibited by other electro-active interferences. In order to address this problem, electrode surface modification has been adopted for lowering the oxidation potential and increasing the current response.

Carbon materials are among the most widely-used materials for electrochemical sensing purpose.10–13 For example, multi-walled carbon nanotubes coupled with Au nanoparticles were used for the sensitive electro-determination of H2O2.14 Studies have shown that graphene based electrodes possess superior electrocatalytic property and conductivity than other carbon based materials.15,16 Many reports have demonstrated that coupling graphene with noble metal nanoparticles could further enhance its electrocatalytic performance.17–19 In particular, Pd nanoparticles have been extensively explored for the determination of various analytes because of its excellent electrocatalytic property.20 Pd nanoparticle modified electrodes are normally prepared by in situ electro-deposition from a Pd precursor solution or by immobilization of pre-synthesized Pd nanoparticles onto electrodes.

In this work, we propose a fast stepwise fabrication method for in situ depositing Pd nanoparticles and graphene oxide (GO) onto the electrode surface. During the fabrication process, Pd and reduced graphene oxide (RGO) nanocomposites are directly formed on the glassy carbon electrode surface with the aid of a chemical reducing agent. The amount of Pd/RGO is well controlled by the number of the deposition cycle. The fabrication procedure is extremely simple and fast. For example, three bilayers of Pd/RGO can be prepared within 3 minutes. The catalytic activity of the fabricated Pd/RGO modified electrode and its enhancement to the electrochemical oxidation of nitrite are studied in detail.

2. Experimental

2.1 Chemicals and materials

NaBH4, potassium hexacyanoferrate(III), L-ascorbic acid (99%), dopamine hydrochloride (DA), PdCl2, uric acid and glucose were purchased from Sigma-Aldrich. Graphene oxide (GO) powder was purchased from JCNANO, INC (China). All other chemicals used were analytical grade reagents without further purification. Phosphate buffer solutions (PBS) with various pHs were prepared by mixing 0.1 M KH2PO4 and K2HPO4 solution and adjusting to appropriate pHs using 0.1 M NaOH and HCl. Milli-Q water (18.2 MΩ cm) was used throughout the experiments.

2.2 Modification of glassy carbon electrode with Pd/RGO

A glassy carbon electrode (GCE, 3 mm diameter) was polished with 1.0, 0.3 and 0.05 μm alumina slurry, respectively. Then the GCE was cleaned through sonication in ethanol and water until a mirror-like surface was formed. The Pd/RGO was deposited onto GCE through a stepwise dipping process. A GCE was firstly dipped into a NaBH4 solution (0.5 M) for 10 s followed by a N2 blow drying process to remove any excess liquid. GCE was then dipped into a PdCl2 solution (0.01 M) for 10 s and dried with N2. After that, the GCE was dipped into a GO dispersion (1 mg mL−1) for another 10 s and dried with N2. Finally, the GCE was immersed into a NaBH4 solution again for 10 s and gently rinsed by water. The resulting electrode was denoted as G/Pd/RGO-1. These steps were repeated until a desired amount of material was deposited. The multi-cycle deposited electrode was defined as G/Pd/RGO-n. A schematic diagram of the stepwise procedure for electrode modification is shown in Fig. 1. GCE modified with only Pd (defined as G/Pd) or GCE modified with only RGO (defined as G/RGO) were prepared using the same procedure except for skipping the step of immersing electrode into GO dispersion (for G/Pd) or PdCl2 solution (for G/RGO).
image file: c5ra02661j-f1.tif
Fig. 1 Schematic illustration of the stepwise fabrication of G/Pd/RGO.

2.3 Characterization

The surface morphology of modified electrodes was analyzed by a field emission scanning electron microscope (FESEM, ZEISS SUPRA 40VP). The crystal structure of samples was collected from 5° to 80° in 2θ by a XRD with Cu Kα radiation (D8-Advanced, Bruker). Raman spectroscopy was performed at room temperature using a Raman microscope (Renishaw, inVia) with 514 nm laser light. UV-vis spectrophotometer of model CARY 3E was used to record the absorption spectra of samples fabricated using the same method except for using quartz slide instead of GCE. Fourier transform infrared (FTIR) spectroscopic studies were carried out with a Nicolet iS5 spectrometer. Samples for SEM, XRD, Raman and UV-vis spectroscopy characterizations were prepared using the same procedure except for using quartz slide instead of GCE. The sample for FTIR characterization was films scratched from the quartz slide.

2.4 Electrochemical measurements

Electrochemical measurements were performed on a CHI430a electrochemical workstation using a three electrode system at room temperature. A Pt wire was used as the counter electrode, and an Ag/AgCl (3 M KCl) served as the reference electrode. The modified GCE was used as the work electrode. The differential pulse voltammetry (DPV) was scanned from 0.6 to 0.9 V and the current was recorded as a function of the potential (pulse amplitude of 20 mV, a pulse width of 50 ms).

3. Results and discussion

3.1 Characterization of Pd/RGO modified electrodes

In this work, Pd/RGO modified GCE was fabricated by a stepwise electroless deposition process. As illustrated in the schematic diagram (Fig. 1), when a NaBH4 treated GCE is inserted into a PdCl2 solution, PdCl42− ions are reduced by the surface adsorbed NaBH4 to form Pd nanoparticles (NPs) on the electrode. GO sheets are then adsorbed onto the electrode surface mainly via the van der Waals interaction. At step 3, the reduction of GO sheets occurs when the electrode is immersed in a NaBH4 solution. The reduction process was evidenced by many tiny bubbles appeared on the GCE surface. As each deposition step only takes about 10 s, this electroless deposition process is fast and can be repeated to achieve the desired amount of materials deposited on an electrode.

In order to confirm the successful formation of Pd/RGO nanocomposites, UV-vis spectroscopy was used to monitor the fabrication process on a quartz slide. As shown in Fig. 2A, the GO dispersion exhibits a main absorption peak at 228 nm corresponding to the C[double bond, length as m-dash]C bond in an aromatic ring.21 After the dipping process, the spectrum of Pd/RGO shows an absorption peak at 262 nm, which belongs to the absorption of reduced GO sheets. The red-shift from 228 to 262 nm is due to the increase of π-conjugated domains and the formation of a highly conjugated graphite-like structure, which indicating the reduction of GO sheets.22,23 It is observed that the absorbance of Pd/RGO composites has a continuous elevation along with the increasing deposition cycle, indicating a regular stepwise growth of the multilayer coating. The plot of Fig. 2A inset shows that the absorbance at 262 nm increases linearly with the fabrication cycle number, proving that nearly equal amount of RGO was deposited at each cycle.


image file: c5ra02661j-f2.tif
Fig. 2 (A) UV-vis spectra of GO dispersion and Pd/RGO deposited quartz slide from 1 to 10 fabrication cycles. Inset shows the plot of absorbance at 262 nm versus the deposition cycle number. (B) Raman spectra of GO and the as prepared Pd/RGO nanocomposite.

Raman scattering is highly sensitive to the electronic structure change of carbon, Raman spectroscopy was thus employed to further characterize the reducing state of GO in the Pd/RGO composite. As shown in Fig. 2B, the spectra of GO and Pd/RGO composite both have two main Raman peaks at 1595 (G band) and 1348 cm−1 (D band). The intensity ratio of the D and G peaks (ID/IG) is usually used for analysing the defect concentration and the alignment of the graphitic planes of the carbon based materials.24 It can be seen that, the ID/IG ratio increases from 0.91 (GO) to 1.04 (Pd/RGO composite), which implies the reduction of GO.25,26 Moreover, the reduction of GO was further evidenced by FTIR analysis. Fig. S1 depicts the FTIR spectra of GO and Pd/RGO composite. The spectrum of GO displays several absorption peaks corresponding to the oxygen-containing groups. The broad band at 3390 cm−1 is corresponded to the stretching of O–H. The bands at 1716 and 1616 cm−1 are assigned to the stretching of C[double bond, length as m-dash]O of carbonyl and carboxylic groups, respectively.27 The bands at 1398 and 1047 cm−1 are assigned to the C–OH stretching vibrations and C–O vibrations from alkoxy groups, respectively.28 However, those peaks are significantly reduced or even vanished in the Pd/RGO composite, strongly indicating that the GO was reduced by dipping into NaBH4 solution.

Fig. 3 shows the top-view SEM images of Pd and Pd/RGO composites prepared by the stepwise dipping method. It can be observed that Pd nanoparticles do not have a defined spherical shape and show small cluster morphology (Fig. 3A). For Pd/RGO composite (Fig. 3B), well-defined RGO sheets could be observed in a wrinkled shape. Some Pd nanoparticles were embedded under the RGO sheets and exhibit various sized protuberances due to the stepwise fabrication sequence. Under higher magnification, the overlap junction of two fabrication cycles was observed. The RGO sheets did not show an agglomeration in the composite (which usually happens after the reduction of GO) due to the introduction of Pd between the RGO sheets. Therefore, the Pd/RGO composite prepared by stepwise dipping fabrication method has a higher surface area, which is beneficial for the electrochemical sensor development.


image file: c5ra02661j-f3.tif
Fig. 3 SEM images of Pd nanoparticles (A) and Pd/RGO composite at lower (B) and higher (C) magnification.

The crystalline nature of the Pd/RGO composite was investigated by XRD and the obtained XRD pattern is presented in Fig. S2. As seen in Fig. S2, the Pd/RGO composite exhibits characteristic diffraction peaks centered at 38.26°, 44.25°, 64.49° and 76.97°, which are assigned to the (111), (200), (222) and (311) crystal facets, indexing face centered cubic Pd (JCPDS 5-681). The small broad diffraction peak centered at 26.80° is related to the graphene sheets. The weak signal indicates that the RGO sheets presented in the composite are exfoliated due to the stepwise dipping fabrication method.

The electrochemical behavior of bare GCE, and G/Pd, G/RGO as well as G/Pd/RGO-3 deposited electrodes were investigated and compared using [Fe(CN)6]3− as an electrochemical probe. Fig. S3 depicts the cyclic voltammograms (CVs) of these electrodes in 1 mM [Fe(CN)6]3− solution containing 0.1 M KCl. Well-defined redox peaks were observed at all electrodes. However, the peak currents of modified electrodes were higher than that at bare GCE, indicating that the modification of either RGO sheets or Pd nanoparticles could enhance the redox reaction of [Fe(CN)6]3− by increasing the effective surface area and electrical conductivity. Moreover, among those electrodes, the G/Pd/RGO-3 showed the highest current response towards the redox of [Fe(CN)6]3− probably due to the synergetic effect of Pd nanoparticles and RGO sheets. The electrochemical behavior of bare GCE, G/Pd, G/RGO and G/Pd/RGO-3 were also characterized in pH 7.0 PBS. As shown in Fig. S4, no perceptible redox peaks are observed in CVs of G/RGO and bare GCE, indicating that RGO does not undergo redox reaction in the potential range from −0.7 to 0.7 V. In contrast, the CVs of G/Pd and G/Pd/RGO-3 exhibit a oxidation peak at −0.40 and a reduction peak at −0.04 V, corresponding to the redox process of Pd nanoparticles. Furthermore, the redox current of G/Pd/RGO-3 is higher than that of G/Pd, indicating a superior electrochemical activity of the G/Pd/RGO-3 nanocomposite. The enhanced electrochemical activity should be ascribed to the introduction of RGO sheets, which provide a higher surface area for loading Pd nanoparticles.

3.2 Electrochemical behavior of nitrite at Pd/RGO modified electrodes

Fig. 4A depicts the CVs of bare GCE, and G/RGO, G/Pd and G/Pd/RGO-3 modified electrodes towards the oxidation of 1 mM nitrite. In the potential range of 0.2–1.0 V, bare GCE does not show any redox peak. At the G/RGO, G/Pd and G/Pd/RGO-3 modified electrodes, a distinct anodic peak corresponding to the oxidation of nitrite is observed. The oxidation peak potentials of nitrite at G/RGO, G/Pd and G/Pd/RGO-3 electrodes were measured to be 0.906, 0886 and 0.829 V, slowly shifting to the more negative potential range. Moreover, the G/Pd/RGO-3 shows a much higher peak current compared to other electrodes. The shift of anodic peak to a more negative potential and the higher current response reveals that the G/Pd/RGO-3 is an effective promoter to enhance the kinetics of the electrochemical process of nitrite.29
image file: c5ra02661j-f4.tif
Fig. 4 Cyclic voltammograms of (A) bare GCE, G/RGO, G/Pd and G/Pd/RGO-3 (B) G/Pd/RGO-1 to G/Pd/RGO-6 modified electrodes in 1 mM nitrite solution at pH 7. Scan rate: 50 mV s−1. (C) Chronoamperometric response of G/Pd/RGO-3 electrode in 0.1 mM of nitrite solution at potential of 0.85 V. Inset: plot of I vs. t−1/2 derived from the chronoamperometric curve.

The influence of the layer number of Pd/RGO on the electrocatalytic activity of the electrode was investigated. Fig. 4B displays the CV profiles of nitrite oxidation at electrodes deposited with G/Pd/RGO from 1 to 6 fabrication cycles. It can be seen that the anodic peak current increases with increasing deposition cycle till three bilayers. After that, the current response decreases upon further increasing of the deposition cycle. As the reaction of nitrite at the electrode is a diffusion controlled process (see below), the current drop after three bilayers is probably due to the diffusion limit effect, that is, it takes longer for nitrite to transfer through the relatively thicker Pd/RGO layers to reach the electrode surface and some Pd nanoparticles inside the inner layers would become difficult to access.30,31 Therefore, stepwise dipping fabrication is an effective method for finding the balance between the amount of modification material and the diffusion barrier. Herein G/Pd/RGO-3 with three cycles of deposition had the best performance and was chosen for further experiments.

Fig. 4C shows the chronoamperometric response of G/Pd/RGO-3 in 0.1 mM of nitrite solution when a potential of 0.85 V was applied. A straight line plot of the current against minus square root of time was deduced (inset of Fig. 4C), confirming that the oxidation of nitrite is a diffusion controlled process.

The relationship between scan rate and current response of nitrite oxidation was investigated. Fig. 5A displays the CVs of G/Pd/RGO-3 at scan rate from 20 to 150 mV s−1 in pH 7.0 PBS containing 1 mM nitrite. The results shows that the oxidation current of nitrite is proportional to the square root of scan rate (inset Fig. 5A). The liner regression can be determined as: Ipa (mA) = 0.00529v−1/2 (mV1/2 s−1/2) − 0.00757 (R2 = 0.9867). It further confirmed that the overall electrochemical process is diffusion-controlled. It is noted that the oxidation potential of nitrite gradually shifts to the positive potential when the scan rate increases. A linear regression can be obtained between the oxidation potential and the logarithm of scan rate. It can be expressed as: Epa (V) = 0.10729[thin space (1/6-em)]log[thin space (1/6-em)]v (V s−1) + 1.02656 (R2 = 0.9882), which implying a kinetic limitation in the reaction between the redox sites of G/Pd/RGO-3 and nitrite.7 Based on this linear equation, the number of electron involved in the reaction can be determined by the Laviron's equation:32,33

Ep = E0′ + (2.303RT/αnF)log(RTko/αnF) + (2.303RT/αnF)log[thin space (1/6-em)]v
where E0′ is the formal redox potential; R is the gas constant; α is the electron transfer coefficient; F is the Faraday's constant and ko is the standard heterogeneous rate constant of the reaction. As the slope of Ep versus log[thin space (1/6-em)]v is 0.10729, the αn value can be calculated as 0.5512. The α can be determined from the following equation:
Ep/2Ep = 1.875(RT/αF)


image file: c5ra02661j-f5.tif
Fig. 5 (A) Cyclic voltammograms of G/Pd/RGO in 0.1 M PBS containing 1 mM nitrite at different scan rates. Inset (i) is the linear dependence of the anodic peak current on the square root of the scan rate. Inset (ii) is the plot of peak potential vs. logarithm of scan rate. (B) The effect of pH on the current response of 1 mM nitrite at G/Pd/RGO electrode.

From the equation, the value of α was calculated to be 0.4767. Therefore, the number of electron involves in the oxidation of nitrite was determined to be 1.15 ≈ 1, which is in good agreement with previous reports.7,34 Therefore, the mechanism for the electrocatalytic oxidation of nitrite on the G/Pd/RGO modified GCE can be deduced as follows:35–37 The interaction between nitrite and Pd/RGO to form a complex of Pd/RGO(NO2) (eqn (1)). The formation of NO2 by losing one electron (eqn (2)) is followed by the disproportionation of the nitrogen dioxide to give nitrite and nitrate (eqn (3) and (4)). Nitrate is the sole product.

 
Pd/RGO + NO2 ⇄ [Pd/RGO(NO2)] (1)
 
[Pd/RGO(NO2)] ⇄ Pd/RGO + NO2 + e (2)
 
2NO2 + H2O ⇄ 2H+ + NO3 + NO2 (3)
 
NO2 + H2O ⇄ 2H+ + NO3 + 2e (4)

3.3 Optimization of the performance of nitrite sensors

Fig. 5B depicts the influence of pH (in the range of 3.0–8.0) on the anodic peak current response. The results show that the peak current increases slowly with increasing pH and reaches a maximum at pH 7.0. Further increasing pH to 8.0 decreases the current response. This result is well in accordance with previous reports.1,38–40 The cause of relatively low current response at acidic medium may be due to the following transformation of nitrite to NO and NO3:41
2H+ + 3NO2 → 2NO + NO3 + H2O

On the other hand, the lack of proton at higher pH conditions will also affect the current response because the oxidation of nitrite is a proton dependent process.42 Moreover, some oxidation products formed at the electrode surface under high pH conditions would also inhibit the oxidation process.43 Therefore, pH 7.0 was chosen for measuring the nitrite.

3.4. DPV determination of nitrite

DPV is a more sensitive technique than cyclic voltammetry and has been widely used for electrochemical analysis.44 Fig. 6A depicts the DPV curves of the G/Pd/RGO-3 electrode in various concentrations of nitrite from 1 to 1500 μM. As shown in Fig. 6A, the DPV curves exhibit well-defined peaks corresponding to the oxidation of nitrite. The peak current increases linearly with the concentration of nitrite in the range of 1 to 1000 μM (Fig. 6B). The corresponding regression equation is: I (μA) = 0.02106C (μM) + 0.34236 (R2 = 0.9912). The detection limit was calculated to be 0.23 μM (S/N = 3). The analytical performances of G/Pd/RGO-3 are compared with other nitrite sensors in the literature and the results are shown in Table S1. Considering the simple electrode fabrication process, wide linear calibration range, high sensitivity and low detection limit, the G/Pd/RGO electrode can be used for practical detection of NO2.
image file: c5ra02661j-f6.tif
Fig. 6 (A) Differential pulse voltammograms of the G/Pd/RGO-3 electrode in pH 7.0 solutions containing 1, 2, 5, 15, 25, 45, 65, 85, 100, 150, 200, 300, 400, 500, 600, 700, 800, 900, 1000 and 1500 μM nitrite. (B) The plot of Ipa vs. the concentration of nitrite.

3.5. Selectivity, reproducibility and stability

The reproducibility of the proposed sensor towards the detection of nitrite was investigated. Fig. S5 shows the eight repetitive DPV measurements of 1 mM nitrite using a same G/Pd/RGO-3 electrode. The RSD of the measurements is 2.07%. For the same nitrite solution, the RSD of measurements using six different G/Pd/RGO-3 electrodes is determined to be 2.56% (Fig. S6). The results indicate that the stepwise fabrication method is very consistent for preparing Pd/RGO electrodes with reproducible results. The operational stability of proposed sensor was evaluated under hydrodynamic conditions. As shown in Fig. S7 inset, the G/Pd/RGO-3 remains more than 94% of its initial response after one hour continuous measurements, indicating the proposed sensor owing an excellent operational stability.

The selectivity of the nitrite sensor was investigated by the detection of nitrite in the presence of some common interferences including ions and biological molecules. Current was measured under a constant potential of 0.8 V. As shown in Fig. S7, no apparent interference was observed in the presence of 10-fold excess of K+, Na+, Zn2+, SO42−, CO32−, NH4+ and HPO42−, and 5-fold excess of biological interference including glucose, dopamine, uric acid and ascorbic acid, due to their low electro-activity at the applied potential. Thus, the stepwisely fabricated G/Pd/RGO electrode can be used for selective detection of nitrite in the presence of many common interference agents.

4. Conclusions

In this study, the RGO and Pd nanoparticles were successively deposited on a glassy carbon electrode via a novel stepwise electroless deposition method. This process is fast and can be repeated to achieve desired amount of nanocomposite deposited on the electrode. UV-vis spectra confirmed the successful stepwise deposition process and nearly equal amount of materials were deposited at each cycle. SEM images revealed that RGO sheets were well separated due to the insertion of Pd NPs. By combining the benefits of RGO and Pd nanoparticles, the resulting G/Pd/RGO composite electrode showed a much higher electrocatalytic performance towards the oxidation of nitrite than that of bare GCE, G/Pd and G/RGO. The proposed nitrite sensor exhibited a linear detection range between 1 to 1000 μM with a detection limit of 0.23 μM. Moreover, the constructed sensor was highly selective for nitrite determination, with excellent repeatability and stability.

Acknowledgements

Swinburne University Postgraduate Research Award (SUPRA) and the National Natural Science Foundation of China (21475033) are acknowledged for partially supporting this work.

Notes and references

  1. Y. Li, H. Wang, X. Liu, L. Guo, X. Ji, L. Wang, D. Tian and X. Yang, J. Electroanal. Chem., 2014, 719, 35–40 CrossRef CAS PubMed.
  2. K. Calfumán, M. J. Aguirre, P. Cañete-Rosales, S. Bollo, R. Llusar and M. Isaacs, Electrochim. Acta, 2011, 56, 8484–8491 CrossRef PubMed.
  3. N. Pourreza, M. R. Fat'hi and A. Hatami, Microchem. J., 2012, 104, 22–25 CrossRef CAS PubMed.
  4. Z. Lin, W. Xue, H. Chen and J.-M. Lin, Anal. Chem., 2011, 83, 8245–8251 CrossRef CAS PubMed.
  5. U. P. Azad, S. Turllapati, P. K. Rastogi and V. Ganesan, Electrochim. Acta, 2014, 127, 193–199 CrossRef CAS PubMed.
  6. B. Yuan, C. Xu, L. Liu, Y. Shi, S. Li, R. Zhang and D. Zhang, Sens. Actuators, B, 2014, 198, 55–61 CrossRef CAS PubMed.
  7. A. Afkhami, F. Soltani-Felehgari, T. Madrakian and H. Ghaedi, Biosens. Bioelectron., 2014, 51, 379–385 CrossRef CAS PubMed.
  8. J. R. C. da Rocha, L. Angnes, M. Bertotti, K. Araki and H. E. Toma, Anal. Chim. Acta, 2002, 452, 23–28 CrossRef.
  9. L. Fu, G. Lai, P. J. Mahon, J. Wang, D. Zhu, B. Jia, F. Malherbe and A. Yu, RSC Adv., 2014, 4, 39645–39650 RSC.
  10. R. L. McCreery, Chem. Rev., 2008, 108, 2646–2687 CrossRef CAS PubMed.
  11. S. N. Kim, J. F. Rusling and F. Papadimitrakopoulos, Adv. Mater., 2007, 19, 3214–3228 CrossRef CAS PubMed.
  12. L. Fu, J. Yong, G. Lai, T. Tamanna, S. Notley and A. Yu, Mater. Manuf. Processes, 2014, 29, 1030–1036 CrossRef CAS PubMed.
  13. L. Fu, G. Lai, H. Zhang and A. Yu, J. Nanosci. Nanotechnol., 2015, 15, 4325–4331 CrossRef CAS PubMed.
  14. A. Yu, X. Zhang, H. Zhang, D. Han and A. R. Knight, Electrochim. Acta, 2011, 56, 9015–9019 CrossRef CAS PubMed.
  15. Y. Wang, Y. Li, L. Tang, J. Lu and J. Li, Electrochem. Commun., 2009, 11, 889–892 CrossRef CAS PubMed.
  16. S. Alwarappan, A. Erdem, C. Liu and C.-Z. Li, J. Phys. Chem. C, 2009, 113, 8853–8857 CAS.
  17. S. Palanisamy, S. Ku and S.-M. Chen, Microchim. Acta, 2013, 180, 1037–1042 CrossRef CAS.
  18. H. Zhou, Y. Liu, W. Chi, C. Yu and Y. Yu, Appl. Surf. Sci., 2013, 282, 181–185 CrossRef CAS PubMed.
  19. L. Fu and A. Yu, Nanosci. Nanotechnol. Lett., 2015, 7, 147–151 CrossRef PubMed.
  20. Z. H. Chen, J. S. Jie, L. B. Luo, H. Wang, C. S. Lee and S. T. Lee, Nanotechnology, 2007, 18, 345502 CrossRef.
  21. D. Li, M. B. Muller, S. Gilje, R. B. Kaner and G. G. Wallace, Nat. Nanotechnol., 2008, 3, 101–105 CrossRef CAS PubMed.
  22. V. G. Plotnikov, V. A. Smirnov, M. V. Alfimov and Y. M. Shul'ga, High Energy Chem., 2011, 45, 411–415 CrossRef CAS.
  23. X.-L. Hou, J.-L. Li, S. C. Drew, B. Tang, L. Sun and X.-G. Wang, J. Phys. Chem. C, 2013, 117, 6788–6793 CAS.
  24. F. Tuinstra and J. L. Koenig, J. Chem. Phys., 1970, 53, 1126–1130 CrossRef CAS PubMed.
  25. X. Zhou, T. Shi and H. Zhou, Appl. Surf. Sci., 2012, 258, 6204–6211 CrossRef CAS PubMed.
  26. S. Stankovich, D. A. Dikin, R. D. Piner, K. A. Kohlhaas, A. Kleinhammes, Y. Jia, Y. Wu, S. T. Nguyen and R. S. Ruoff, Carbon, 2007, 45, 1558–1565 CrossRef CAS PubMed.
  27. P. Xi, F. Chen, G. Xie, C. Ma, H. Liu, C. Shao, J. Wang, Z. Xu, X. Xu and Z. Zeng, Nanoscale, 2012, 4, 5597–5601 RSC.
  28. X. Yan, J. Chen, J. Yang, Q. Xue and P. Miele, ACS Appl. Mater. Interfaces, 2010, 2, 2521–2529 CAS.
  29. M. A. Kamyabi and F. Aghajanloo, J. Electroanal. Chem., 2008, 614, 157–165 CrossRef CAS PubMed.
  30. W. Si, W. Lei, Y. Zhang, M. Xia, F. Wang and Q. Hao, Electrochim. Acta, 2012, 85, 295–301 CrossRef CAS PubMed.
  31. L. Chen, C. Yuan, H. Dou, B. Gao, S. Chen and X. Zhang, Electrochim. Acta, 2009, 54, 2335–2341 CrossRef CAS PubMed.
  32. E. Laviron, J. Electroanal. Chem., 1979, 101, 19–28 CrossRef CAS.
  33. E. Laviron, J. Electroanal. Chem., 1974, 52, 355–393 CrossRef CAS.
  34. A. Afkhami, M. Bahram, S. Gholami and Z. Zand, Anal. Biochem., 2005, 336, 295–299 CrossRef CAS PubMed.
  35. P. Li, Y. Ding, A. Wang, L. Zhou, S. Wei, Y. Zhou, Y. Tang, Y. Chen, C. Cai and T. Lu, ACS Appl. Mater. Interfaces, 2013, 5, 2255–2260 CAS.
  36. P. Tau and T. Nyokong, Electrochim. Acta, 2007, 52, 4547–4553 CrossRef CAS PubMed.
  37. Y.-Y. Wu, C. Li, Z.-Y. Dou, L.-L. Cui, D.-J. Liu and X.-Q. He, J. Solid State Electrochem., 2014, 18, 2625–2635 CrossRef CAS.
  38. D. Gligor and A. Walcarius, J. Solid State Electrochem., 2014, 18, 1519–1528 CrossRef CAS.
  39. D. Ning, H. Zhang and J. Zheng, J. Electroanal. Chem., 2014, 717–718, 29–33 CrossRef CAS PubMed.
  40. L. Zhou, J.-P. Wang, L. Gai, D.-J. Li and Y.-B. Li, Sens. Actuators, B, 2013, 181, 65–70 CrossRef CAS PubMed.
  41. O. Brylev, M. Sarrazin, L. Roué and D. Bélanger, Electrochim. Acta, 2007, 52, 6237–6247 CrossRef CAS PubMed.
  42. A. Afkhami, T. Madrakian, A. Shirzadmehr, M. Tabatabaee and H. Bagheri, Sens. Actuators, B, 2012, 174, 237–244 CrossRef CAS PubMed.
  43. B. Piela and P. K. Wrona, J. Electrochem. Soc., 2002, 149, E55–E63 CrossRef CAS PubMed.
  44. L. Wu, L. Feng, J. Ren and X. Qu, Biosens. Bioelectron., 2012, 34, 57–62 CrossRef CAS PubMed.

Footnote

Electronic supplementary information (ESI) available. See DOI: 10.1039/c5ra02661j

This journal is © The Royal Society of Chemistry 2015
Click here to see how this site uses Cookies. View our privacy policy here.