DOI:
10.1039/C5RA02643A
(Paper)
RSC Adv., 2015,
5, 32256-32262
Microwave-assisted optimization of the manganese redox states for enhanced capacity and capacity retention of LiAlxMn2−xO4 (x = 0 and 0.3) spinel materials†
Received
10th February 2015
, Accepted 30th March 2015
First published on 31st March 2015
Abstract
Microwave irradiation at the pre- and post-annealing steps of the synthesis of LiAlxMn2−xO4 (x = 0 and 0.3) spinel cathode materials for rechargeable lithium ion batteries is a useful strategy to optimize the average manganese valence number (nMn) for enhanced capacity and capacity retention. The strategy impacts on the lattice parameter, average manganese valence, particle size and morphology, reversibility of the de-intercalation/intercalation processes, and capacity retention upon continuous cycling. Microwave irradiation is able to shrink the particles for improved crystallinity. The XPS data clearly suggest that microwave irradiation can be used to tune the manganese valence (nMn), and that the LiAlxMn2−xO4 with nMn ≈ 3.5+ gives the best electrochemical performance. These new findings promise to revolutionize how we use microwave irradiation in the preparation of energy materials and various other materials for energy storage and conversion materials for enhanced performance.
Introduction
Rechargeable lithium ion batteries (RLIBs) have proved themselves as the most attractive advanced battery technologies for electric vehicles and portable electronics.1–8 Perhaps, the lithium manganese oxide, LiMn2O4 (LMO) spinel material needs little or no introduction as it has proved itself as one of the most attractive cathode materials for RLIBs due to its high operating voltage (4 V), low cost, environmental compatibility, and stability at low temperature compared to other cathode materials.5,9–11 LMO has begun to show some commercial success; it is the cathode material that drives Nissan Leaf (a pure electric vehicle) and Chevrolet Volt (a plug-in hybrid electric vehicle). Despite the advantages of LMO, one of its major challenges that still conspire against its full utilization is capacity fading upon continuous cycling. The capacity loss is caused by two main factors, the so-called Jahn–Teller distortion and slow dissolution of manganese in the electrolyte.12,13 The Jahn–Teller effect is the reduction of the crystal symmetry from cubic to tetragonal structure, and it is this structural transition that deteriorates its cycle life and is said to occur when the average manganese valence number (nMn) is equal or less than 3.5.14,15 The stress generated by this phenomenon leads to cracking of particles and loss of electric contact upon cycling. The manganese ions in LMO are believed to exist as 50% Mn3+ and 50% Mn4+ (i.e., nMn = 3.5+). High content of Mn3+ ions causes capacity fading, and leads to the dissolution of the cathode material into the electrolyte.
There are three known strategies for improving the cycling performance of LMO; (i) making the spinel structure lithium-rich (Li-excess),16–18 (ii) doping with cations19–21 and (iii) coating with metal oxides. Aluminium is a preferred dopant for LMO16–18 since it is abundant, non-toxic, less expensive and lighter than transition metal elements. Reports on the application of microwave irradiation (MWI) in the preparation of LMO have focussed on reducing the synthesis time,22–28 there is no report on the strategic utilisation of MWI aimed at curbing the recalcitrant capacity fading. We have found that microwave irradiation can enhance cycling behaviour by controlling the manganese valence state, structure, and morphological integrity of the LMO and Al-doped LMO. In a nutshell, the MWI is a viable ‘curative’ treatment to LMO powder to enhance its capacity retention.
Experimental procedure
Chemicals and materials
Lithium nitrate (LiNO3), manganese nitrate tetrahydrate (Mn (NO3)2·4H2O), urea (CO (NH2)2) and aluminum nitrate nonahydrate (Al(NO3)2·9H2O), carbon black, N-methyl-2-pyrrolidone (NMP), polyvinylidene fluoride (PVDF), lithium metal (50 μm thick), lithium hexafluorophosphate (LiPF6), ethylene carbonate (EC), diethyl carbonate (DEC), and dimethyl carbornate (DMC) were purchased from Sigma-Aldrich and used without further purification. Aluminum foil (50 μm thick) was obtained from MTI Corporation, USA.
Synthesis of LMO and Al-doped LMO powders
LMO-based powders were obtained from the nitrate salts of Li and Mn via the combustion method with urea as the fuel. LiNO3 (1.10 g, 0.016 mol), Mn(NO3)2·4H2O (8.00 g, 0.032 mol) and urea (2.87 g, 0.047 mol) were dissolved in deionised water (20.00 ml) and stirred until the starting materials were completely dissolved. The resultant solution was heated in the furnace at 550 °C for ∼7 min to yield a black powder product. This sample was divided into three portions. The first portion was annealed at 700 °C for 10 h using a tube furnace (50 mm, MTI Corporation). The LMO powder obtained by this conventional annealing process is abbreviated as LMO-a. The second portion was subjected to microwave irradiation at 600 W for 20 min (using the Anton Paar Multiwave 3000 system, λ = 0.12236 m) and then annealed at 700 °C for 10 h (abbreviated as LMO-ma). The third portion was first annealed at 700 °C for 10 h and then subjected to microwave irradiation as described above (abbreviated as LMO-am). The aluminum-doped LMO (LiMn1.7Al0.3O4) were prepared using the same procedure as for the LMO-based samples. The LiMn1.7Al0.3O4 powders were prepared using 1.10 g LiNO3, 6.80 g Mn(NO3)2·4H2O, 1.80 g Al(NO3)2·9H2O and 2.87 g urea. The powders were similarly named LMOA-a, LMOA-am and LMOA-ma. The schematic of the procedure is summarized in Fig. 1. We attempted 10 and 20 min duration at 600 W treatments for LMO-ma and got better XRD pattern for the 20 min duration than for the 10 min, hence 20 min was used for all subsequent microwave experiments.
 |
| Fig. 1 Schematic representation of the microwave-assisted combustion synthesis of LiMn2O4 (LMO) and LiMn1.7Al0.3O4 (LMOA). The abbreviations are as described in the experimental section. | |
Materials characterization
Scanning electron microscopic micrographs were acquired using a LEO 1525 field emission scanning microscope (FE-SEM) with the acceleration voltage of 200 kV. HRTEM measurements were carried out on a Joel HRJEM-2100 microscopy using LAB6 filament as an electron source. The measurements were carried out using electron beam at 200 kV. Powder XRD data were acquired using a PANalytical X'Pert Pro diffractometer with CuKα radiation, λ = 1.5046 Å as a radiation source operating at 45 kV and 40 mA, scan range between 5 and 90°. XPS measurements were carried out using Kratos Axis Ultra-DLD system (Shimadzu) with Al Kα radiation (1486.6 eV). The binding energy was calibrated with reference to the C 1s level of the carbon (284.6 eV). The FTIR spectra were recorded using a Perkin Elmer Spectrum 100 FTIR spectrometer in the range 400–4000 cm−1. The analysis was carried out using a diamond crystal probe and air was used as a background. Pellets of the samples were mixed with KBr in the ratio 1
:
3 and prepared by the disk method. The pellets were made using a thickness that provided good transparency for IR radiation. Raman measurements were carried out in air using a Horiba Jobin Yvon spectrometer equipped with 10× objective lens to focus the laser beam on a small selected area of the sample, a 30 mW green argon laser (λ = 514 nm) an excitation source, and a 1800 lines per mm grating monochromator with an air-cooled CCD detector. Raman spectra were measured up to 1000 cm−1 on the stokes side, with a spectral resolution of about 3 cm−1.
Fabrication of coin cells and electrochemical characterization
The cathodes for the electrochemical studies were prepared by making up of slurry which contained 80% of the LMO powders mixed with 10% carbon black and 10% polyvinylidene fluoride (PVDF) binder in N-methyl-2-pyrrolidone (NMP) as the solvent. The slurry was applied using a doctor-blade method onto an aluminium foil as a current corrector. The coated aluminium foil was dried under vacuum at 110 °C for 12 h, then pressed to form a uniform layer. The electrodes were heated at 80 °C under vacuum for at least 6 h, and then kept in the glovebox (MBRAUN MB10 compact) for 2 h before the fabrication of the coin cells. The coin cells (type CR 2032) composed of the positive electrode (cathode) made from the required spinel LMO powder, lithium metal as the negative electrode (anode) and a Celgard polypropylene-based membrane separator soaked in non-aqueous electrolyte. A 1 M LiPF6 in EC/DC/DMC in 1
:
1
:
1 volume ratio solution was used as the electrolyte. LiPF6 in EC–DMC–DEC has increased ion mobility and high ionic conductivity compared to a commercial electrolyte with LiPF6 in EC/DEC. High conductivity of the electrolyte will minimize the internal resistance of the cell.
The coin cells also contained a stainless steel spacer to provide an electrical connection from the electrode to the case, and a spring to exert pressure on the components to allow maximum contact of the cathode and anode when the coin cell is sealed. The coin cells were assembled in a glovebox filled with ultra-high purity argon gas with the concentration of H2O and O2 maintained at <0.5 ppm. The electrolyte was left in the glove box overnight before being used to fabricate the coin cells. After all components of the coin cells were aligned, the coin cell was sealed with a Compact Hydraulic Crimping Machine (MSK-110). The pressure on the crimper was set at 750 psi to seal the coin cells. After fabrication, the coin cells were allowed to stand for 24 h before the electrochemical measurements were performed. Cyclic voltammetry (CV) was conducted at a scan rate of 0.1 mV s−1 over a range of 3.5–4.3 V using a Bio-Logic science VMP3-based instrument using the EC-lab V10.32 software. The charge–discharge capacity and cycle performance (rate capability) were measured at different C-rates (charge–discharge rates) between 3.5 and 4.3 V using a Maccor 4000 battery tester. All of the electrochemical performance measurements were carried at room temperature.
Results and discussion
Morphological and structural characterization
The FESEM images of the spinel materials at low magnification are shown in Fig. 2 (also see ESI, Fig. S1† for high magnification). The LMOA samples are smaller in size (10–130 nm) than the LMO samples (80–250 nm) or the commercial LMO sample (LMO-comm, ≥1 μm, ESI, Fig. S2†). From the comparative TEM images of the LMO-based samples (Fig. 3) and the LMOA-based samples (ESI, Fig. S3†), the spinels are crystalline, with well-defined lattice fringes, and an average d-spacing of 0.473 ± 0.04 nm which confirm the (111) plane in the lattice structure. The TEM image of LMO-ma (Fig. 3e) seems to show some ultrathin coating of the particles. Considering that we did not do any coating, we can speculate that this ‘coating-like’ structure may be due to surface segregation due to microwave, or due to the difference in the crystallinity of the surface and bulk materials. Further experiments are necessary to confirm this observation.
 |
| Fig. 2 Typical FE-SEM micrographs of LMO powders at low magnifications (100 nm). The abbreviations are as described in Fig. 1. | |
 |
| Fig. 3 Typical TEM and HRTEM images of LMO-based powders. | |
The powder XRD patterns for the LMO and LMOA (Fig. 4) showed well-developed diffraction peaks of pure spinel LiMn2O4 and LiAl0.3Mn1.7O4 materials. The peaks were indexed to the characteristic diffractions of spinel LiMn2O4 (JCPDS File no. 88-1749) with space group Fd
m, corresponding to the (111), (311), (222), (400), (331), (551), (440), and (531) planes. The lattice parameter values were determined by Rietveld analysis using the Expo2013 software. Table 1 summarises the values of the lattice parameter with some interesting information when compared to commercial LMO and literature.29 First, the LMO-a shows the largest lattice parameter, which decreased upon microwave irradiation and/or doping with aluminium. The lattice contraction means a decrease in the Mn3+ and increase in the Mn4+ ion (since the radius of Mn3+ (0.66 Å)) is greater than that of Mn4+ (0.60 Å).30 Second, there is a dramatic contraction of the lattice parameters for the LMOA samples which is due to the fact that the radius of Mn3+ is greater than that of Al3+ (0.53 Å), and the bond length of Mn–O (1.90 Å) is longer than that of Al–O (1.62 Å); as Al3+ substitutes Mn3+ in the 16d site of spinel structure, the unit cell shrinks. In general, the lattice contraction increases the structural stability of the spinel, which is beneficial to the suppression of Jahn–Teller distortion.
 |
| Fig. 4 Typical powder XRD patterns of the LMO- and LMOA-based powders. | |
Table 1 XRD, XPS (Mn-2p3/2 spectra) and electrochemical data of the LMO and LMOA based samples
Sample |
XRD data |
Binding energy position (eV) |
Cation distribution |
Coin cell data |
Lattice parameter (Å) |
Mn4+ |
Mn3+ |
Mn4+ (%) |
Mn3+ (%) |
Mn valence (nMn) |
Initial capacity (mA h g−1) |
Capacity loss after 50 cycles |
LMO-a |
8.2565 ± 0.0010 |
644.5 |
642.2 |
16.5 |
83.5 |
3.165 |
127.5 |
22.0% |
LMO-am |
8.2441 ± 0.0012 |
645.8 |
642.7 |
49.7 |
50.3 |
3.498 |
94.3 |
9.0% |
LMO-ma |
8.2403 ± 0.0012 |
646.5 |
644.6 |
54.2 |
45.8 |
3.541 |
131.5 |
5.0% |
LMO-comm |
8.2161 ± 0.0012 |
644.1 |
642.6 |
40.1 |
59.9 |
3.400 |
— |
— |
LMO29 |
8.2404 ± 0.0013 |
— |
— |
51 |
49 |
3.503 |
118.6 |
66.8% |
LMOA-a |
8.1701 ± 0.0011 |
644.4 |
642.4 |
31.0 |
69.0 |
3.310 |
95.3 |
7.2% |
LMOA-am |
8.1671 ± 0.0011 |
644.5 |
642.8 |
49.2 |
50.8 |
3.493 |
103.6 |
0.4% |
LMOA-ma |
8.1696 ± 0.0011 |
644.3 |
642.6 |
31.2 |
68.8 |
3.312 |
73.6 |
0.7% |
XPS is a well-known surface-sensitive technique for the quantification of cations in oxide materials including spinels.31–39 From the Mn 2p3/2 spectra of the spinel materials (Fig. 5), the Mn3+/Mn4+ ratio and valence number (Table 1) corroborate the lattice contraction observed in the XRD. Interestingly, the increased valence states for LMO-ma (nMn = 3.541+) and LMOA-am (nMn = 3.493+) are consistent with the slight positive shifts of their Mn-2p3/2 binding energies compared to un-microwaved samples. Note that the nMn values for LMO-a and LMO-comm are less than 3.5+ (i.e., amount of Mn3+ is higher than that of the Mn4+) contradicting the general notion that LMO powders should be nMn ≈ 3.5+ (i.e., that the amount of Mn3+ is always equal to that of the Mn4+). Perhaps, more interesting is that when the LMO-a was subjected to microwave irradiation to obtain the LMO-am, we observed a lattice shrinkage (from 8.256 to 8.244 Å) leading to nMn ≈ 3.5+. This result strongly proves that our microwave irradiation strategy is able to convert excess Mn3+ to Mn4+ to generate the expected nMn ≈ 3.5+ value. The microwave-treated samples with nMn ≈ 3.5+ (LMO-ma and LMOA-am) exhibited the strongest Raman and IR peaks (ESI, Fig. S4†), confirming the effect of the microwave irradiation in strengthening the Mn–O bonding for enhanced electrochemistry. The LMOA samples showed positive peak shifts (≥20 cm−1), which indicates a relatively stronger bonding in the Mn(Al)O6 octahedra due to Al-doping and the microwave irradiation.
 |
| Fig. 5 XPS Mn 2p3/2 spectra of LMO- and LMOA-based samples. | |
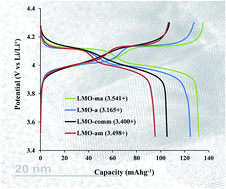
The electrochemistry of the coin cells was studied as shown in Fig. 6. The cyclic voltammetric evolutions of the LMO and LMOA-based coin cells (Fig. 6a and b) showed two redox couples (I/I′ and II/II′), indicating an expected two-step lithium ion insertion/extraction reactions.40 The shoulder peak ca. 3.874 V (peak III) of the LMO-ma is attributed to the ‘formation cycle’ during initial cycles whereby minor structural rearrangement of the lattice takes occur.41 From the CV data (summarised in ESI, Table S1†) clearly indicate reversibility of the redox processes, with the microwave-treated samples showing enhanced reaction kinetics compared to the un-microwaved samples. The discharge capacities (Fig. 6c and d) for the LMOA based coin cells are lower than that of un-doped LMO sample due to the replacement of the redox-active Mn3+ with redox-inactive Al3+ in the spinel structure. From the rate capability studies (Fig. 6e and f) the microwave-treated samples (LMO-am, LMOA-am and LMOA-ma) gave higher capacities at high C-rates and showed almost the same capacity when returned to the initial 0.1 C-rate compared to the standard LMO and LMOA-based coin cells.
 |
| Fig. 6 Cyclic voltammograms of LMO (a) and LMOA (b) coin cells at 0.1 mV s−1; galvanostatic charge–discharge of LMO (c) and LMOA (d) coin cells at 0.1 C; plots of discharge capacity vs. cycle number for the LMO (e) and LMOA (f) coin cells at different current densities (0.1–2 C) between 3.5 and 4.3 V range. | |
There are critical findings from the coin cell data in Table 1 (also from discharge capacity vs. cycle number vs. coulombic efficiency curves in ESI, Fig. S5†) that should be emphasized. First, the LMO obtained by a short microwave exposure prior to annealing (i.e., LMO-ma materials with nMn ≈ 3.5+) gave the highest initial capacity (131.5 mA h g−1) and best capacity retention (95% even after 50 cycles) compared to a similar LMO obtained from microwave-assisted sysnthesis29 (also with nMn ≈ 3.5+) that gave poor performance (initial capacity of 118.6 mA h g−1, and 33.2% capacity retention after 50 cycles). Thus, the high-performance of our LMO-ma stems solely from the strategic microwave synthesis protocol. Second, the best-performing LMO and LMOA are those with nMn ≈ 3.5+ which were obtained by a pre- or post-annealing microwave irradiation step. Third, all the LMOA samples showed lower discharge capacity but, interestingly, exhibited excellent capacity retention, the microwaved samples giving the highest performance. Fourth, LMO-a (with nMn = 3.165+, capacity retention of 88%) can be optimized or tuned to give nMn = 3.5+ and thus enhanced capacity retention (91%) by subjecting the powder to microwave irradiation. The same phenomenon is also observed for the LMOA-a (with nMn = 3.310+, capacity retention of 92.8%) which gave nMn = 3.5 with enhanced capacity and capacity retention (99.6%). Finally, LMOA-a and LMOA-ma with lower average manganese oxidation state (nMn ≈ 3.31+) gave better capacity retention than LMO-am and LMO-ma with higher nMn values of ca. 3.50+ and 3.54+, respectively. Our results largely contradict various reports that predicted that higher capacity retention could be obtained only at nMn > 3.50+.14,15,42,43 Also, Zhang et al.29 reported that the best performing dual-doped LMO was with nMn = 3.571+. We can infer from our findings that LMO and doped-LMO with nMn ≈ 3.5+ with excellent capacity retention can be obtained if microwave irradiation is strategically used in the synthesis step, pre or post-annealing steps. Microwave irradiation at the pre- or the post-annealing steps of the synthesis has different effects on LMO and LMOA. This should be expected since Al-doping inherently changes the chemistry and electrochemistry of the LMO. For example, from the XRD data, there was lattice contraction upon Al-doping (replacement of the redox-active Mn3+) and hence the lower capacities obtained for LMOA compared to LMO.
Conclusions
Hitherto, the average valence (nMn) of manganese has been known to be the determining factor for capacity retention in LiMn2O4 and doped-LiMn2O4 spinel cathode materials for rechargeable lithium ion battery; when the concentration of Mn3+ ions exceeds that of Mn4+ ions (nMn < 3.5+) capacity fade/loss becomes prominent, but when nMn > 3.5+ capacity retention is improved. We report, for the first time, the application of microwave irradiation at the pre- and post-annealing steps of the synthesis of LiAlxMn2−xO4 (x = 0 and 0.3) spinel cathode materials with the view to understanding and optimizing the manganese valence number for enhanced capacity retention. We showed that this strategic microwave irradiation can be used to shrink the spinel particles and lattice parameters for improved crystallinity, and tune the Mn3+/Mn4+ ratio to obtain nMn ≈ 3.5+ for enhanced electrochemical performance. From the results, two parameters, crystal size (as observed by SEM) as well as Mn oxidation state change simultaneously and therefore it still seems difficult to assign the improvement to one of the effects. Simply put, the electrochemistry of LMO and LMOA can be enhanced by tuning the crystal size and manganese valence to ca. 3.5+ by strategic microwave irradiation steps, pre- or post-annealing. If microwave irradiation prior to annealing fails to achieve the nMn ≈ 3.5+, one can still obtain the nMn ≈ 3.5+ by microwave irradiation after annealing. Clearly, microwave irradiation cannot just be used as a mere heat source to achieve fast chemical reaction, but can be used to tune the physico-chemical properties of electrode materials. Thus, this study has the potential to revolutionize how we use microwave irradiation in the preparation of spinel materials and a plethora of materials for energy storage and conversion systems for enhanced performance. One of the important questions that should be answered is: to what extent can the lattice parameters be shrunk and the particle size be controlled by microwave irradiation to provide the optimum average manganese valence for enhanced electrochemical performance? To answer this question and others, the process is being optimized at our laboratory for pilot-scale production.
Acknowledgements
We thank the CSIR and the NRF for supporting this work. FPN thanks the CSIR for studentship.
References
- B. Scrosati, Electrochim. Acta, 2000, 45, 2461–2466 CrossRef CAS.
- T. Ohzuku and R. J. Brodd, J. Power Sources, 2007, 174, 449–456 CrossRef CAS PubMed.
- J. Amarilla, K. Petrov, F. Pico, G. Avdeev, J. Rojo and R. Rojas, J. Power Sources, 2009, 191, 591–600 CrossRef CAS PubMed.
- B. Dunn, H. Kamath and J. M. Tarascon, Science, 2011, 334, 928–935 CrossRef CAS PubMed.
- J. Tarascon and M. Armand, Nature, 2001, 414, 359–367 CrossRef CAS PubMed.
- M. Armand and J. Tarascon, Nature, 2008, 451, 652–657 CrossRef CAS PubMed.
- G. Amatucci and J. Tarascon, J. Electrochem. Soc., 2002, 149, K31–K46 CrossRef CAS PubMed.
- K. Kang, Y. S. Meng, J. Breger, C. P. Grey and G. Ceder, Science, 2006, 311, 977–980 CrossRef CAS PubMed.
- P. Ragupathy, RSC Adv., 2014, 4, 670–675 RSC.
- N. Choi, Z. Chen, S. A. Freunberger, X. Ji, Y. Sun, K. Amine, G. Yushin, L. F. Nazar, J. Cho and P. G. Bruce, Angew. Chem., Int. Ed., 2012, 51, 9994–10024 CrossRef CAS PubMed.
- S. Lee, Y. Cho, H. Song, K. T. Lee and J. Cho, Angew. Chem., Int. Ed., 2012, 51, 8748–8752 CrossRef CAS PubMed.
- M. M. Thackeray, Y. Shao-Horn, A. J. Kahaian, K. D. Kepler, E. Skinner, J. T. Vaughey and S. A. Hackney, Electrochem. Solid-State Lett., 1998, 1, 7–9 CrossRef CAS PubMed.
- M. Qian, J. Huang, S. Han and X. Cai, Electrochim. Acta, 2014, 120, 16–22 CrossRef CAS PubMed.
- S. Martinez, I. Sobrados, D. Tonti, J. Amarilla and J. Sanz, Phys. Chem. Chem. Phys., 2014, 16, 3282–3291 RSC.
- Q. Tong, Y. Yang, J. Shi, J. Yan and L. Zheng, J. Electrochem. Soc., 2007, 154, A656–A667 CrossRef CAS PubMed.
- R. Gummow, A. De Kock and M. Thackeray, Solid State Ionics, 1994, 69, 59–67 CrossRef CAS.
- M. Reddy, M. S. Raju, N. Sharma, P. Quan, S. H. Nowshad, H. Emmanuel, V. Peterson and B. Chowdari, J. Electrochem. Soc., 2011, 158, A1231–A1236 CrossRef CAS PubMed.
- F. Jiao, J. Bao, A. H. Hill and P. G. Bruce, Angew. Chem., Int. Ed., 2008, 47, 9711–9716 CrossRef CAS PubMed.
- Y. Shin and A. Manthiram, Chem. Mater., 2003, 15, 2954–2961 CrossRef CAS.
- W. Choi and A. J. Manthiram, J. Electrochem. Soc., 2007, 154, A614–A618 CrossRef CAS PubMed.
- M. A. Kebede, M. J. Phasha, N. Kunjuzwa, L. J. Le Roux, D. Mkhonto, K. I. Ozoemena and M. K. Mathe, Sustainable Energy Technologies and Assessments, 2014, 5, 44–49 CrossRef PubMed.
- M. Nakayama, K. Watanabe, H. Ikuta, Y. Uchimoto and M. Wakihara, Solid State Ionics, 2003, 164, 35–42 CrossRef CAS PubMed.
- H. Yan, X. Huang and L. Chen, J. Power Sources, 1999, 81–82, 647–650 CrossRef CAS.
- S. Bao, Y. Liang and H. Li, Mater. Lett., 2005, 59, 3761–3765 CrossRef CAS PubMed.
- P. Ragupathy, H. N. Vasan and N. Munichandraiah, Mater. Chem. Phys., 2010, 124, 870–875 CrossRef CAS PubMed.
- Y. Fu, C. Lin, Y. Su, J. Jean and S. Wu, Ceram. Int., 2004, 30, 1953–1959 CrossRef CAS PubMed.
- B. He, W. Zhou, S. Bao, Y. Liang and H. Li, Electrochim. Acta, 2007, 52, 3286–3293 CrossRef CAS PubMed.
- H. Liu, C. Hu, X. Zhu, H. Hao, J. Luo, J. Zhou and S. Ouyang, Mater. Chem. Phys., 2004, 88, 290–294 CrossRef CAS PubMed.
- H. Zhang, Y. Xu, D. Liu, X. Zhang and C. Zhao, Electrochim. Acta, 2014, 125, 225–231 CrossRef CAS PubMed.
- S. Bao, Y. Liang, W. Zhou, B. He and H. Li, J. Power Sources, 2006, 154, 239–245 CrossRef CAS PubMed.
- S. H. Chang, K. S. Ryu, K. M. Kim, M. S. Kim, I. K. Kim and S. G. Kang, J. Power Sources, 1999, 84, 134–137 CrossRef CAS.
- H. Chen and D. J. Hsu, J. Alloys Compd., 2014, 598, 23–26 CrossRef CAS PubMed.
- H. Chen and D. Hsu, Characterization of crednerite-Cu1.1Mn0.9O2 films prepared using sol–gel processing, Appl. Surf. Sci., 2014, 290, 161–166 CrossRef CAS PubMed.
- E. Elbadraoui, J. Baudour, F. Bouree, B. Gillot, S. Fritsch and A. Rousset, Cation Distribution and Mechanism of Electrical Conduction in Nickel–Copper Manganite Spinels, Solid State Ionics, 1997, 93, 219–225 CrossRef CAS.
- C. J. Jafta, M. K. Mathe, N. Manyala, W. D. Roos and K. I. Ozoemena, ACS Appl. Mater. Interfaces, 2013, 5, 7592–7598 CAS.
- J. F. Marco, J. R. Gancedo, M. Gracia, J. L. Gautier, E. I. Ríos, H. M. Palmer, C. Greaves and F. J. Berry, J. Mater. Chem., 2001, 11, 3087–3093 RSC.
- V. Mittal, P. Chandramohan, S. Bera, M. Srinivasan, S. Velmurugan and S. Narasimhan, Solid State Commun., 2006, 137, 6–10 CrossRef CAS PubMed.
- J. Töpfer, A. Feltz, D. Gräf, B. Hackl, L. Raupach and P. Weissbrodt, Phys. Status Solidi A, 1992, 134, 405–415 CrossRef.
- T. Yamashita and P. Hayes, Appl. Surf. Sci., 2008, 254, 2441–2449 CrossRef CAS PubMed.
- M. Reddy, A. Sakunthala, S. SelvashekaraPandian and B. Chowdari, J. Phys. Chem. C, 2013, 117, 9056–9064 CAS.
- X. Zhao, M. Reddy, H. Liu, S. Ramakrishna, G. S. Rao and B. Chowdari, RSC Adv., 2012, 2, 7462–7469 RSC.
- Y. Shin and A. Manthiram, J. Electrochem. Soc., 2004, 151, A204–A208 CrossRef CAS PubMed.
- R. J. Gummow, A. de Kock and M. M. Thackeray, Solid State Ionics, 1994, 69, 59–67 CrossRef CAS.
Footnote |
† Electronic supplementary information (ESI) available. See DOI: 10.1039/c5ra02643a |
|
This journal is © The Royal Society of Chemistry 2015 |
Click here to see how this site uses Cookies. View our privacy policy here.