A new sensing platform based on electrospun copper oxide/ionic liquid nanocomposite for selective determination of risperidone

Majid Arvand*, Masoomeh Sayyar Ardaki and Mohammad Ali Zanjanchi
Electroanalytical Chemistry Laboratory, Faculty of Science, University of Guilan, Namjoo Street, P.O. Box: 1914-41335, Rasht, Iran. E-mail: arvand@guilan.ac.ir; Fax: +98 131 33233262; Tel: +98 131 33233262

Received 9th February 2015 , Accepted 27th April 2015

First published on 28th April 2015


Abstract

A new synthetic method for the fabrication of copper oxide nanoparticles and its applications towards the electrochemical sensing of risperidone (Ris) are reported. The synthesized nanoparticles were characterized by different methods such as transmission electron microscopy (TEM), scanning electron microscopy (SEM) and energy dispersive X-ray analysis (EDX). The copper oxide nanoparticle/ionic liquid (CuO-NPs/IL) nanocomposite modified electrode exhibits excellent electrocatalytic activity towards the oxidation of Ris compared to a carbon paste electrode (CPE) and CuO-NP/CPE. The dependence of the oxidation peak current on the pH of the solution, amount of modifier, scan rate and concentration of the analyte was studied to optimize the experimental conditions. The detection limit of 0.016 μM and two linear calibration ranges of 0.1–1 and 1–100 μM were obtained for Ris determination at CuO-NP/IL/CPE. The proposed modified electrode was successfully applied for the determination of Ris in human blood serum samples without separation or pretreatment.

1 Introduction

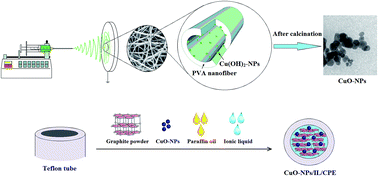
Inorganic nanostructures have attracted considerable interest in recent years because of their outstanding properties and potential applications.1 Metal oxide nanoparticles are very important in inorganic material research and have attracted much attention due to their special properties such as high activity, special electronic properties, large surface area, and chemical and optical properties.2–4 Copper oxide (CuO) is an important p-type metal oxide semiconductor and has been widely studied because of its applications as a material for heterogeneous catalysts, gas sensors, lithium ion batteries, solar cells, magnetic storage media, electrochemical sensors, etc.5–13 CuO nanoparticles have been prepared by a variety of methods such as microwave irradiation, laser ablation, sonochemical decomposition, alcohothermal, fast precipitation and so on.14–18 Recently, Khalil et al. developed a new method to prepare CuO nanoparticles by electrospinning technique, but expensive ultrasonic equipment was needed in this method.19 In contrast, we prepared well dispersed CuO nanoparticles via electrospinning technique in two steps: electrospinning of a polymeric solution containing very small amounts of copper acetate and calcination of the composite nanofibres, subsequently. Its basic principle is combining electrospinning technique with the traditional sol–gel method to prepare precursor nanofibres, and then calcining the as-prepared composite nanofibers to prepare nanoparticles.

Electrospinning is a simple, economical and versatile method to produce ultrathin nanofibers, nanowires and nanorods from a rich variety of materials that include polymers, composites and ceramics.20 With this method, different kinds of metal, metal oxide and their carbon composite nanofibres have been prepared.21 This technique involves the use of a high voltage electrostatic field to charge the surface of a polymer solution droplet and thus to induce the ejection of a liquid jet through a spinneret.20

CuO nanoparticles have been extensively used in electrochemical sensors as a sensing material, due to its properties such as good electrochemical activity, high stability and low material cost. In order to improve the performance of these sensors, they are typically fabricated by pasting a mixture of electrochemically active material and conducting binders. It is known that the addition of an ionic liquid effectively improves conductivity and prevents aggregation.

Ionic liquids (ILs) are the salts having very low melting temperature and exhibit many virtues, such as high chemical and thermal stability, high conductivity, almost negligible vapor pressure, and wide electrochemical windows.22,23 Therefore, ILs hold a great promise for green chemistry applications in general and for electrochemical applications in particular.24

Risperidone is a psychotropic agent belonging to the chemical class of benzisoxazole derivatives. The chemical designation is 3-[2-[4-(6-fluoro-1,2-benzisoxazol-3-yl)-1-piperidinyl]ethyl]-6,7,8,9-tetrahydro-2-methyl-4H-pyrido[1,2-a]pyrimidin-4-one.25 In vitro studies have shown that Ris acts as a serotonin (5-HT2) and dopamine (D2) antagonist and binds to alpha-1 and alpha-2 adrenergic and histamine (H1) receptors. These peculiar properties make it useful in a wide range of psychotic diseases with a reduced risk of inducing extrapyramidal sideeffects.26,27 Due to its widespread use, efficient analytical methods are required to quantify this compound in pharmaceutical formulations and biological fluids. There are various methods to quantify Ris in biological fluids, including HPLC combined with capillary electrophoresis, LC-MS/MS and HPLC-MS/MS.28–30 Most of the methods reported are time consuming, expensive and need complicated preconcentration. Compared with other methods, electrochemical techniques have several advantages such as simplicity, low-cost and relatively short analysis time.31–33

The aim of this work is to develop a new, simple and cheap nanocomposite with multifunctional properties benefitting from CuO nanoparticles and hydrophobic ionic liquid 1-ethyl-3-methylimidazolium hexafluorophosphate (EMIMPF6) with good electrocatalytic activity for the electro-oxidation of Ris.

2 Experimental

2.1 Reagents and solutions

Polyvinyl alcohol (PVA, Mw ∼ 72[thin space (1/6-em)]000 g mol−1) and copper acetate (Cu(CH3COO)2·H2O, 99%) were purchased from Merck (Darmstadt, Germany). 1-Ethyl-3-methylimidazolium hexafluorophosphate (EMIMPF6, 98%) was the product of Fluka Chemical Company (Fluka, Buchs, Switzerland). Risperidone and other drugs were from Sobhan Darou Company (Rasht, Iran). Phosphate buffer solution (PBS, 0.1 M, pH 7) was prepared by mixing solutions of 0.1 M Na2HPO4·12H2O and 0.1 M NaH2PO4·H2O. The stock solution of the Ris (1 mM) was prepared by dissolving appropriate amount of it in 0.1 M HCl and stored at 4 °C darkly. All solutions were prepared and diluted using high quality deionized water.

2.2 Apparatus

The electrochemical measurements were performed with an Autolab PGSTAT 30 electrochemical analyzer (Eco Chemie BV, Utrecht, the Netherlands). A conventional three-electrode cell was used at 25 ± 1 °C. A saturated Ag/AgCl electrode, a platinum wire and a modified CPE was used as the reference, auxiliary and working electrodes, respectively. The amperometry analysis was carried out by PalmSens analyzer at the potential of 0.88 V under continuous stirring. The pulse amplitude of 0.025 V, pulse interval time of 0.5 s and scan rate of 0.01 V s−1 were selected as optimum instrumental parameters for differential pulse voltammetry (DPV). All the pH values were measured with a Metrohm pH meter (model 827, Swiss made). Scanning electron microscope (SEM) images were obtained with Electroanalyzer Sama 500. Transmission electron microscope (TEM) images were carried out on a CM10 Philips instrument. The chemical composition was obtained using energy dispersive X-ray spectroscopy (EDX) (ESEM, Philips, XL30). All UV-Vis absorption spectra of the samples were recorded using a Biochrom WPA Biowave II UV-Vis spectrophotometer in the range of 200–900 nm. A homemade electrospinning device with controllable feeding rate and DC voltage range of −5 kV to 25 kV was used to fabricate composite nanofibers.

2.3 Electrospinning process

In order to prepare the composite nanofibres, the PVA aqueous solution (10 wt%) was first prepared by dissolving appropriate amount of PVA powder in distilled water at 60 °C under magnetic stirring for 4 h. Twenty grams of the PVA solution was dropped slowly into the Cu(CH3COO)2 aqueous solution (0.06 g Cu(CH3COO)2·H2O and 21 g H2O) under vigorous stirring in a water bath at 80 °C. After stirring for 5 h, the mixture was loaded into a plastic syringe and connected to high-voltage power supply. 12 kV was provided between the steel needle and a flat aluminum foil at a distance of 12 cm. The formed mat was initially peeled off from the aluminum foil and put into oven under 80 °C for 12 h, and then calcined at 500 °C for 4 h with a heating rate of 12 °C min−1.34

2.4 Preparation of modified electrodes

Prior to the surface modification, the glassy carbon electrode was polished with alumina powder, and then ultrasonically cleaned in ethanol and water for 2 min to remove the physically adsorbed substances. The prepared electrode was dried at room temperature and used immediately for modification. The nanocomposite modified electrode (CuO-NPs/IL/CPE) was prepared by hand mixing 0.073 g of graphite powder, 0.012 g of CuO-NPs, 0.01 g of IL and 0.005 g of paraffin oil. The paste was packed into a Teflon cap and placed on the GCE surface. For comparison, CuO-NPs modified carbon paste electrode (CuO-NPs/CPE) without ionic liquid and unmodified carbon paste electrode (CPE) in the absence of both CuO-NPs and ionic liquid were also prepared in the same way.

2.5 Samples preparation

The proposed procedure for the determination of the Ris was applied to recovery study from human serum. Serum samples of patients were received from Shafa Educational & Remedial Center in Rasht. These samples were originally obtained from four patients (patient 1: male, 45 years, patient 2: male, 38 years, patient 3: male, 38 years and patient 4: female, 35 years) who underwent the treatment with Risperdal® (6 mg per day). The serum samples were collected 1 h after intake of tablet and stored frozen until assay. A 0.1 mL of each one them were transferred into the 10 mL volumetric flask and diluted to the volume with the selected supporting electrolyte.

3 Results and discussion

3.1 Characterization of CuO nanoparticles

Fig. 1A shows the FT-IR spectra of the PVA and composite nanofibers. The spectrum of the PVA nanofibers shows a strong absorption around 3350 cm−1, which is assigned to O–H stretching vibration of PVA. However, in the curve of composite nanofibers, this peak was broader and changed to 3320 cm−1. These data demonstrate that there is coordination link between –OH and Cu2+, which prevents the nanoparticles from aggregation in the nanofibers.34,35 The EDX spectrum of the nanoparticles is given in Fig. 1B. It can be concluded that the prepared CuO-NPs mainly consist of CuO.
image file: c5ra02554k-f1.tif
Fig. 1 (A) FT-IR spectra of (a) pure PVA and (b) Cu(CH3COO)2/PVA composite nanofibers (inset shows shift of O–H stretching vibration peak at higher magnification); (B) EDX spectra of CuO nanoparticles.

The morphologies of the Cu(CH3COO)2/PVA composite nanofibers (Fig. 2A) and CuO-NPs (Fig. 2B) were observed directly by SEM. It can be seen from Fig. 2A that the morphology of the nanofibers is smooth and they are interconnected to form network like structures. The diameters of the as-prepared nanofibers are ranging from 50 to 100 nm, and the lengths are up to several micrometers. Fig. 2C illustrates typical TEM images of CuO-NPs with different magnifications. It is apparent that CuO-NPs are composed of spherical particles with good dispersion. The size of the particles estimated from the TEM image of CuO-NPs is in the range of 15–40 nm. Fig. 2D and E show SEM images of the carbon paste with and without CuO-NPs/IL nanocomposite, orderly. The presence of CuO-NPs is clearly evident in Fig. 2D. The Nanoparticles are well-dispersed all over the carbon paste substrate, which increase the surface area of the modified electrode. Furthermore, compared with the bare carbon paste, on the modified carbon paste a more uniform surface could be observed without the separated carbon layers. Since ILs have high viscosity, the addition of IL in the carbon paste can adhere graphite particles together and fill into the void spaces.


image file: c5ra02554k-f2.tif
Fig. 2 SEM images of (A) Cu(CH3COO)2/PVA composite nanofibers and (B) Cu-NPs, orderly; (C) TEM images of CuO-NPs (a) and (b) in scale of 100 and 70 nm, orderly; SEM images of (D) carbon paste containing CuO-NPs/IL nanocomposite and (E) bare carbon paste.

3.2 Electrochemical performance of modified electrodes

The electrochemical behavior of an electroactive species such as a [Fe(CN)6]3−/4− couple is a useful tool for evaluating the kinetic barrier of the electrode/solution interface. Therefore, the voltammetric behaviors of the CuO-NPs/IL/CPE (dotted line), CuO-NPs/CPE (dashed dotted line) and CPE (dashed line) were investigated in 0.1 M KCl solution containing 5.0 mM [Fe(CN)6]3−/4− by cyclic voltammetry (CV). As shown in Fig. 3, all curves exhibit a pair of reversible redox peaks of [Fe(CN)6]3−/4−. However, compared with the CuO-NPs/CPE and CPE, the redox peaks show the best reversibility and the highest peak currents at the CuO-NPs/IL/CPE. This result indicates that the CuO-NPs/IL nanocomposite modified electrode exhibits faster electron transfer kinetics and larger electroactive surface area. The effective surface area of the CuO-NPs/IL/CPE was also determined by CV in above [Fe(CN)6]3−/4− solution at different sweep rates (ν) according to the Randles–Sevcik equation:36
 
Ip = (2.69 × 10⁵)AD01/2n3/2ν1/2C0 (1)
where the number of transferred electrons (n) is 1 and the standard diffusion coefficient (D0) of K3[Fe(CN)6] at 25 °C is 7.6 × 10⁻⁶ cm2 s−1.31 The effective surface area of the CuO-NPs/IL/CPE is estimated to be 0.057 cm2, which is higher than the surface area of CPE (0.031 cm2). These results indicate that presence of CuO-NPs and IL together causes the increase of the electroactive surface.

image file: c5ra02554k-f3.tif
Fig. 3 Cyclic voltammograms of the CPE (dashed line), CuO-NPs/CPE (dashed dotted line) and CuO-NPs/IL/CPE (dotted line) in 5 mM K3[Fe(CN)6] containing 0.1 M KCl (scan rate: 0.1 V s−1).

3.3 Electrochemical behavior of Ris

In the first step, some important features of the modified electrode such as the binder/graphite powder ratio and the amount of the CuO-NPs and IL used were optimized to increase the sensitivity of the CuO-NPs/IL/CPE. The peak current was increased by increasing the amount of the CuO-NPs and IL up to 12 and 10 wt%, orderly. Thus, the ratio of 12/10/5/73 CuO-NPs/IL/paraffin oil/graphite powder (wt%) was selected as the optimum ratio in this work.

The electrochemical behavior of Ris at CuO-NPs/IL/CPE, CuO-NPs/CPE and CPE was studied using CV. Fig. 4 shows CV responses in the presence of 100 μM Ris in 0.1 M PBS (pH 7.0) at the scan rate of 0.1 V s−1. It was clear that the current response of CPE toward Ris was weak, whereas CuO-NPs/CPE exhibited an obviously increased anodic peak current, indicating the CuO-NPs played an important role in the electrocatalytic performance of the modified electrode. In contrast, the current increased more than 2 fold for CuO-NPs/IL/CPE over CuO-NPs/CPE, which indicated that the presence of IL could enhance the peak current. On the other hand, the anodic peak potential at the CuO-NPs/IL/CPE was about 927 mV, while at the CuO-NPs/CPE and CPE, the peaks potential were about 956 and 1042 mV, respectively. From these results, it was concluded that the presence of CuO-NPs and IL in modified electrode had great improvement on the electrochemical response. This might be related to the synergistic effect of IL and CuO-NPs. The high specific surface area of CuO-NPs and the unique properties of IL such as high ionic conductivity were helpful for promoting the electrochemical signals. Note that none of these electrodes showed electrochemical response in the absence of Ris.


image file: c5ra02554k-f4.tif
Fig. 4 Cyclic voltammograms of the CPE (a), CuO-NPs/CPE (b) and CuO-NPs/IL/CPE (c) in a 0.1 M PBS (pH 7.0) containing Ris 100 μM (scan rate: 0.1 V s−1).

3.4 Effect of solution pH

In general, it is important for organic compounds to choose buffer solution and the pH of buffer solution. The pH of the supporting electrolyte has a significant influence on the electro-oxidation of organic compounds because protons are always involved in the electrochemical reactions and exert a significant effect on the peak current and the potential. To check the effect of supporting electrolyte, three different kinds of buffer solutions (0.1 M PBS, 0.1 M acetate buffer solution and 0.1 M citrate buffer solution) were tested. The results showed that the largest peak current and the best peak shape for Ris were obtained in PBS solution and it was selected as the electrolyte for further experiments. The pH effect on the electrode reaction was investigated by DPV in the pH ranging from 3.3 to 8.0 (Fig. 5). No peak was observed from pH = 3.3 to 4.0, while at pH = 4.6 a symmetrical peak was obtained. As can be seen from the inset of Fig. 5 (inset a), the anodic peak current was increased by increasing pH up to 7. This can be due to the fact that the nano-CuO is alkaline-oxide and its stability is improved by decreasing the solution acidity.37 Then, the peak current was decreased and became unsymmetrical when the pH value increased from 7.0 to 8.0. Thus, in this study, all of the measurements were carried out at pH = 7.0 that it is similar to physiological pH. In addition, the relationship between the peak potential and pH was also investigated. The anodic peak potential shifted toward less positive potential values with increasing the pH, which indicates that protons are directly involved in the oxidation process (Fig. 5). The Epa–pH plot (Fig. 5, inset b) shows that the dependence of Epa on pH can be expressed by the following relation: Epa = −0.0423pH + 1.131(R2 = 0.9916). The slope of −0.0423 V pH−1 indicates that the number of protons in the process is equal to the number of the transferred electrons. In the potential–pH profile there is only one linear plot indicating that the pKa of Ris is out of this range. It is reported in the literature that Ris has two pKa values, one at 3.11 and the other at 8.27.38
image file: c5ra02554k-f5.tif
Fig. 5 DPVs for CuO-NPs/IL/CPE in 0.1 M PBS containing 100 μM Ris at different pH values of 4.6, 5.1, 5.6, 6, 7, 7.4 and 7.9 (scan rate: 0.1 V s−1); inset a: Ipa vs. pH and inset b: Epa vs. pH plot of Ris.

3.5 Effect of scan rate

In the electrochemical studies, useful information such as the electrochemical reaction mechanisms and kinetic parameters usually can be found from the potential scan rate. Therefore, the effect of scan rate on the electrochemical behavior of Ris was investigated in the presence of 100 μM Ris (Fig. 6A). The cyclic voltammograms recorded revealed that the peak current increased by increasing scan rate from 0.02 to 0.21 V s−1. A linear relationship was obtained by plotting anodic peak currents vs. scan rates (Fig. 6B) and the corresponding equation can be expressed as Ipa(μA) = 33.637ν(V s−1) + 0.3076(R2 = 0.9895). As shown in the inset of Fig. 6B (inset a), a linear relationship was also obtained for the logarithmic peak currents vs. the logarithmic scan rate, and it can be expressed as log[thin space (1/6-em)]Ipa(μA) = 0.9169[thin space (1/6-em)]log[thin space (1/6-em)]ν(V s−1) + 1.4856(R2 = 0.9869). The value of its slope (0.9169) is close to the theoretical value of 1.0, which clearly indicates a adsorption controlled electrode process.39 These results indicate that the oxidation of Ris on the CuO-NPs/IL/CPE is an adsorption controlled process. Moreover, as scan rate was increased, the peak potential shifted to higher positive potentials, which confirms the irreversibility of the oxidation process. The dependence of the peak potential and the logarithmic scan rate (ln[thin space (1/6-em)]ν) showed a linear relationship with a regression equation of Epa(V) = 0.0233[thin space (1/6-em)]ln[thin space (1/6-em)]ν(V s−1) + 0.9319(R2 = 0.9935) (Fig. 6, inset b). For an irreversible electrode process, according to Laviron equation,40 Epa is defined by the following equation:
 
image file: c5ra02554k-t1.tif(2)
where α is the transfer coefficient, ks is the rate constant of the electrochemical reaction, n is the number of electron transferred, ν is the scan rate and E°′ is the formal potential. Other symbols have their usual meanings. According to above equation, the value of (1 − α)n can be easily calculated from the slope. In our system, the slope is 0.0233, taking T = 298.15 K, F = 96[thin space (1/6-em)]485 C mol−1 and R = 8.314 J mol−1 K−1, the (1 − α)n was calculated to be 1.1027. According to Bard and Faulkner,34 α can be calculated using the following equation:
 
image file: c5ra02554k-t2.tif(3)
where Ep/2 is the potential where the current is at half the peak value. Thus, from this, we obtained the value of α to be 0.49 that is close to 0.5 in a totally irreversible electron process. Further, the number of electrons (n) involved during Ris oxidation in PBS at CuO-NPs/IL/CPE was calculated to be 2.16. Also, if the value of E°′ is known, the ks value can be determined from the intercept of the straight line of Ep vs. ln[thin space (1/6-em)]ν. The E°′ value can be deduced from the intercept of Ep vs. ν plot by extrapolating the line to the vertical axis at ν = 0, when ν was approached to zero, then Ep was approached to E°′.41 In this system, E°′ was obtained as 0.8538 V and the ks was calculated to be 1.5 s−1. These results represent that the CuO-NPs/IL nanocomposite as a modifier, considerably facilitates the electron transfer kinetics and assists the electrochemical oxidation of Ris. An estimate of the electrode surface coverage was made approximately by adopting the method used by Sharp et al.42 According to this method, the peak current is related to the surface concentration of the electroactive species, Γ, by the following equation:
 
image file: c5ra02554k-t3.tif(4)
where n represents the number of electrons involved in the oxidation process of Ris, A is the effective surface area (0.057 cm2) of the modified electrode, Γ (mol cm−2) is the surface coverage, ν is the scan rate and the other symbols have their usual meanings. From the slope of Ip vs. ν plot in Fig. 6B, the calculated surface concentration is 1.57 × 10⁻⁴ μmol cm−2 for n = 2.

image file: c5ra02554k-f6.tif
Fig. 6 (A) Cyclic voltammograms of 100 μM Ris in 0.1 M PBS (pH 7.0) on the surface of CuO-NPs/IL/CPE at different scan rates; (B) plot of the oxidation peaks current vs. scan rate. Inset a: relationship between the logarithmic peak currents and the logarithmic scan rate; inset b: dependence of the anodic peak potential on the logarithmic scan rate.

3.6 Proposed Ris oxidation mechanism

As mentioned in the above section, the number of electrons transferred in electrode reaction was 2. Combining the former result that the identical number of protons and electrons were transferred in the oxidation process, the oxidation reaction of Ris belonged to a two electron and two proton process. Based on the results reported in the ref. 27, a significant conformational change was evident for Ris when passing from the ground state to the radical cation. In detail, the C–N–C angle of the piperidine changes from 112° in the ground state to 123° in the radical cation. It is due to the removal of one electron from the lone pair of piperidine nitrogen. For the electrochemical oxidation of the piperidinic ring in aqueous solution, a simile behavior has been reported in previous studies.43–45 Other considerations that can further support the proposed mechanism can be found in literature. The imide groups are reducible but not oxidizable in the usual conditions and the lactone moiety is not oxidizable at the applied potentials. The fluorobenzene ring present in the molecule is reducible,46 while the oxazole cannot be oxidized in the usual conditions.47 Therefore, the possible reaction pathways for electro-oxidation of Ris on the CuO-NPs/IL/CPE can be proposed as shown in Scheme 1. At first, the one electron abstraction from piperidine nitrogen of Ris forms the radical cation that, after deprotonation, forms the neutral radical.27,48,49 Because no hydrogen is directly bonded to the piperidine nitrogen atom, the loss of proton from the radical cation could proceed involving one of the six alpha hydrogen atoms.27,50 Both radicals formed by loss of the hydrogen atom are stabilized by resonance. The iminium products are formed directly by loss of a second electron from the neutral radicals. The enamines are formed after deprotonation of iminium ions.45
image file: c5ra02554k-s1.tif
Scheme 1 The proposed mechanism of the electrochemical oxidation of Ris.

3.7 Effect of accumulation parameters

Given the fact that Ris was able to be adsorbed at the surface of the electrode, the effect of two parameters of accumulation step, i.e., accumulation time and potential on the oxidation peak of Ris was investigated. Open circuit accumulation is widely used in electroanalytical chemistry to accumulate analyte and improve the determining sensitivity. The current increased gradually as accumulation time increased from 0 to 60 s. However, after 60 s, it remained almost unchanged, which indicates saturated surface adsorption. Therefore, the optimal accumulation time of 60 s was chosen for further experiments. The effect of accumulation potential on the peak intensity was also investigated over the range of 0–0.6 V. With the change of accumulation potential, the peak current varied slightly. So, the accumulation potential had no such effect on the peak intensity. Therefore the accumulation was carried out at open circuit conditions.

3.8 Analytical performance

In order to test the feasibility of this method for the quantitative analysis of Ris, the relationship between anodic peak current and concentration of Ris was studied using DPV (Fig. 7). Under the optimized conditions, the calibration curve was linear in the range of 0.1 to 100 μM with two different equations (inset of Fig. 7). The regression equations were Ipa(μA) = 0.0712C + 0.088(R2 = 0.9968) for the range of 0.1–1 μM and Ipa(μA) = 0.0182C + 0.1748(R2 = 0.9965) for the range of 1–100 μM. The limit of detection (LOD) (S/N = 3) and quantification (LOQ) (S/N = 10) were 0.016 and 0.053 μM, respectively. To estimate the repeatability of the proposed electrode, the RSD of five times successful measurement of the peak current of 1 μM Ris solution at the CuO-NPs/IL/CPE was calculated to be 1.53%, which demonstrated the good repeatability of the proposed electrode. The reproducibility and stability of the proposed electrode were also explored. The reproducibility, RSD between electrodes, was investigated at above concentration by preparation of three similar CuO-NPs/IL/CPE electrodes. The RSD was less than 3% which demonstrated excellent reproducibility. The stability of the modified electrode was good. When the modified electrode was kept at a room temperature for three weeks, no obvious changes were observed in the peak currents for the same sample concentration after several runs of the DPV. A comparison analysis on Ris electrochemical sensors based on different modified electrodes reported in previous published literatures was shown in Table 1, in which it can be seen that the present method can provide a sensitive method with comparable LOD and a wide linear range for determination of Ris in PBS (pH 7.0).
image file: c5ra02554k-f7.tif
Fig. 7 DPVs obtained at the CuO-NPs/IL/CPE for Ris (PBS, pH = 7.0) at different concentrations from 0.1 to 100 μM; inset: the calibration curve of Ris.
Table 1 Comparison of the proposed electrode with other electrodes for the determination of Ris
Electrode Method DR (μM) LOD (μM) Sample Ref.
SWCNTs–COOH CME DPV 1.46–3.65 0.97 Risperidone tablet 27
MWCNT–CPE DPV 0.04–10.0 0.012 Pharmaceutical preparations, spiked human serum 32
HMDE SWCAdSV 1.5–150 0.0052 Pharmaceutical preparations, spiked human serum and urine 51
HMDE CV 2.0–16 1.0 Risperidone tablets 33
HMDE SWV 0.23–7.5 0.013 Pharmaceutical preparations, spiked human urine and serum 52
CuO-NPs/IL/CPE DPV 0.1–100 0.016 Human serum samples of patients treated by risperidone This work


3.9 Interference effect

It is well known that some electroactive species in serum and the other structural related drugs may influence the performance of a sensor; therefore, the selectivity of the proposed electrode toward Ris was investigated by introducing some foreign species such as arginine (Arg), alanine (Ala), olanzapine (Olz), clozapine (Clz), ascorbic acid (AA), uric acid (UA) and some ions. These species were consecutively added into continuously stirred 0.1 M PBS (pH 7.0) at an applied potential of 0.88 V. It can be seen from Fig. 8 that there is nearly no current response for all the interferents, compared to the response for 20 μM Ris. Additionally, after the first addition of Ris, 20 μM Ris was again added into the solution. The nearly equal current response for Ris at the first and second time injection demonstrates the reproducibility of the measurement. After addition of the interfering species, 20 μM Ris was again added into the solution. It was observed that the current response still reached the similar value for the first addition of Ris, despite the previous additions of the interferents. The influence of the foreign species on the determination of Ris was also investigated by DPV method. The tolerable limit was defined as the concentrations of foreign substances, which gave an error in the range of ±10% in the determination of Ris. The DPV results indicated that K+, I, SO42−, NO3, Na+, Ca2+, Fe2+ and Cl showed no change in Ipa of Ris until a 500-fold excess. Arg, Ala, Olz and Clz did not interfere up to a 100-fold excess while AA and UA interfered beyond 20-fold excess. In agreement with the results obtained with amperometric method, DPV results showed high selectivity of CuO-NPs/IL/CPE for Ris detection.
image file: c5ra02554k-f8.tif
Fig. 8 Amperometric response of CuO-NPs/IL/CPE to the sequential addition of 0.0005 mmol Ris, 0.05 mmol Fe2+, Na+, K+, Ca2+, Arg, Ala, Olz, Clz, 0.01 mmol of AA and UA into the 25 mL stirring PBS (0.1 M, pH 7.0) at an applied potential of 0.88 V.

3.10 Application

In order to evaluate the validity of the proposed method, four human blood serum samples of patients treated by Ris were directly analyzed using standard addition method. Under the optimal conditions, the representative DPVs for the serum sample of patient 1 are depicted in Fig. 9. It is clearly shown that the observed oxidation peak at 0.88 V is assigned to the oxidation of Ris since this peak increases while adding Ris standard solutions. The obtained results for serum samples, before and after spiking, are presented in Table 2. By evaluation of these results, it can conclude that the values obtained by the voltammetric method agree well with those acquired by the spectrophotometric method. The statistical calculations indicate good agreement between the mean values (t-test) and precision (F-test) for the two methods (for P = 0.05).
image file: c5ra02554k-f9.tif
Fig. 9 DPVs of serum samples of patient 1 undergoing treatment with Risperdal® (6 mg per day): (a) before and after spiking with (b) 0.1, (c) 0.2, (d) 0.4 and (e) 0.6 μM of Ris standard solution in PBS at pH 7.0 on the CuO-NPs/IL/CPE.
Table 2 Results of Ris determination in patients' serum samples by DPV compared with spectroscopic method
Patient Ris contenta (μM) F-testb t-testc
Proposed method Reference method
a x = x ± sx for n = 5 and sx denotes standard deviation.b Tabulated F-value for 4, 4° of freedom at P value of 0.05 is 6.39.c Tabulated t-value for 8° of freedom at P value of 0.05 is 2.31.
1 0.24 ± 0.02 0.22 ± 0.01 4.0 2.0
2 0.27 ± 0.04 0.30 ± 0.03 1.78 1.34
3 0.25 ± 0.02 0.24 ± 0.02 1.0 0.79
4 0.19 ± 0.03 0.22 ± 0.02 2.25 1.86


4 Conclusion

In this article we introduced a new, low cost and time saving method to synthesize CuO nanoparticles by electrospinning technique. The synthesized CuO-NPs and ionic liquid were combined to make a novel nanocomposite and utilized for modification of CPE. The electrochemical behavior of an atypical antipsychotic, Ris, was investigated on the CuO-NPs/IL/CPE in PBS (pH = 7.0). Compared with the CuO-NPs/CPE and CPE, the anodic peak of Ris showed the highest peak current and the lowest peak potential at the CuO-NPs/IL/CPE surface. The combination of CuO-NPs and ionic liquid shows synergistic effect, due to the special properties of each of them. Under the optimized conditions, the anodic peak current was linear to Ris concentration in a wide linear range (0.1–100 μM), and the detection limit was about 0.016 μM. The results obtained are promising and demonstrate the utility of the proposed method for the determination of Ris content in biological fluids without complex sample pretreatment.

Compliance with ethical standards

Ethical approval: All procedures performed in studies involving human participants were in accordance with the ethical standards of the institutional and/or national research committee and with the 1964 Helsinki declaration and its later amendments or comparable ethical standards. This article does not contain any studies with animals performed by any of the authors. Informed consent: Informed consent was obtained from all individual participants included in the study.

Acknowledgements

The authors are thankful to the post-graduate office of Guilan University for the support of this work.

References

  1. G. Bozkurt, A. Bayrakçeken and A. K. Özer, Appl. Surf. Sci., 2014, 318, 244–250 CrossRef CAS PubMed.
  2. Z. Fei, P. Lu, X. Feng, B. Sun and W. Ji, Catal. Sci. Technol., 2012, 2, 1705–1710 CAS.
  3. P. K. Khanna, S. Gaikwad, P. V. Adhyapak, N. Singh and R. Marimuthu, Mater. Lett., 2007, 6, 14711–14714 Search PubMed.
  4. B. Pal, S. S. Mallick and B. Pal, Colloids Surf., A, 2014, 459, 282–289 CrossRef CAS PubMed.
  5. F. Teng, W. Q. Yao, Y. F. Zheng, Y. T. Ma, Y. Teng, T. G. Xu, S. H. Liang and Y. F. Zhu, Sens. Actuators, B, 2008, 134, 761–768 CrossRef CAS PubMed.
  6. S. A. Patil, L. A. Patil, D. R. Patil, G. H. Jain and M. S. Wagh, Sens. Actuators, B, 2007, 123, 233–239 CrossRef CAS PubMed.
  7. J. Y. Xiang, J. P. Tu, X. H. Huang and Y. Z. Yang, J. Solid State Electrochem., 2008, 12, 941–945 CrossRef CAS PubMed.
  8. M. Vaseem, A. Umar, Y. B. Hahn, D. H. Kim, K. S. Lee, J. S. Jang and J. S. Lee, Catal. Commun., 2008, 10, 11–16 CrossRef CAS PubMed.
  9. J. Chen, S. Z. Deng, N. S. Xu, W. X. Zhang, X. G. Wen and S. H. Yang, Appl. Phys. Lett., 2003, 83, 746–748 CrossRef CAS PubMed.
  10. H. B. Wang, Q. M. Pan, H. W. Zhao, G. P. Yin and P. J. Zuo, J. Power Sources, 2007, 167, 206–211 CrossRef CAS PubMed.
  11. X. G. Zheng, C. N. Xu, Y. Tomokiyo, E. Tanaka, H. Yamada and Y. Soejima, Phys. Rev. Lett., 2000, 85, 5170–5173 CrossRef CAS.
  12. L. C. Jiang and W. D. Zhang, Biosens. Bioelectron., 2010, 25, 1402–1407 CrossRef CAS PubMed.
  13. T. Alizadeh and S. Mirzagholipur, Sens. Actuators, B, 2014, 198, 438–447 CrossRef CAS PubMed.
  14. H. Wang, J. Z. Xu, J. J. Zhu and H. Y. Chen, J. Cryst. Growth, 2002, 244, 88–94 CrossRef CAS.
  15. K. Suzuki, N. Tanaka, A. Ando and H. Takagi, J. Nanopart. Res., 2012, 14, 1–11 CrossRef.
  16. R. V. Kumar, Y. Diamant and A. Gedanken, Chem. Mater., 2000, 12, 2301–2305 CrossRef CAS.
  17. Z. Hong, Y. Cao and J. Deng, Mater. Lett., 2002, 52, 34–38 CrossRef CAS.
  18. J. Zhu, D. Li, H. Chen, X. Yang, L. Lu and X. Wang, Mater. Lett., 2004, 58, 3324–3327 CrossRef CAS PubMed.
  19. A. Khalil, M. Jouiad, M. Khraisheh and R. Hashaikeh, J. Nanomater., 2014, 2014, 1–7 CrossRef PubMed.
  20. I. S. Chronakis, J. Mater. Process. Technol., 2005, 167, 283–293 CrossRef CAS PubMed.
  21. C. L. Zhang and S. H. Yu, Chem. Soc. Rev., 2014, 43, 4423–4448 RSC.
  22. X. S. Guan, H. Zhang and J. Zheng, Anal. Bioanal. Chem., 2008, 391, 1049–1055 CrossRef PubMed.
  23. M. Galiński, A. Lewandowski and I. Stępniak, Electrochim. Acta, 2006, 51, 5567–5580 CrossRef PubMed.
  24. R. T. Kachoosangi, M. M. Musameh, I. Abu-Yousef, J. M. Yousef, S. M. Kanan, L. Xiao, S. G. Davies, A. Russell and R. G. Compton, Anal. Chem., 2009, 81, 435–442 CrossRef CAS PubMed.
  25. D. Healy, Psychiatric Drugs Explained, Churchill Livingstone, Edinburgh, 2009 Search PubMed.
  26. L. L. Brunton, D. K. Blumenthal, N. Murri, R. H. Dandan, B. C. Knollmann and Goodman & Gilman's The Pharmacological Basis of Therapeutics, McGraw-Hill, New York, 12th edn, 2011 Search PubMed.
  27. D. Merli, D. Dondi, M. Pesavento and A. Profumo, J. Electroanal. Chem., 2012, 683, 103–111 CrossRef CAS PubMed.
  28. C. Danel, N. Azaroual, A. Brunel, D. Lannoy, G. Vermeersch, P. Odou and C. Vaccher, J. Chromatogr. A, 2008, 1215, 185–193 CrossRef CAS PubMed.
  29. R. S. Tomar, T. J. Joseph, A. S. R. Murthy, D. V. Yadav, G. Subbaiah and K. V. S. R. Krishna Reddy, J. Pharm. Biomed. Anal., 2004, 36, 231–235 CrossRef CAS PubMed.
  30. M. Huang, J. Shentu, J. Chen, J. Liu and H. Zhou, J. Zhejiang Univ., Sci., B, 2008, 9, 114–120 CrossRef CAS PubMed.
  31. M. Arvand and A. Pourhabib, J. Chin. Chem. Soc., 2013, 60, 63–72 CrossRef CAS PubMed.
  32. A. Afkhami and H. Ghaedi, Anal. Methods, 2012, 4, 1415–1420 RSC.
  33. Z. Meng, J. Zheng and X. Zhu, Chin. J. Chem., 2005, 63, 827–833 CAS.
  34. H. Wang, X. Lu, Y. Zhao and C. Wang, Mater. Lett., 2006, 60, 2480–2484 CrossRef CAS PubMed.
  35. M. Xiao, J. M. Lu and Z. B. Zhang, Polym. Mater. Sci. Eng., 2004, 4, 103–106 Search PubMed.
  36. A. J. Bard and L. R. Faulkner, Electrochemical Methods: Fundamentals and Applications, John Wiley & Sons, 2nd edn, 2004 Search PubMed.
  37. X. Liang, X. Zhang, F. Wang, M. Xu and X. Bao, J. Solid State Electrochem., 2014, 18, 3453–3461 CrossRef CAS PubMed.
  38. http://druginfosys.com.
  39. D. K. Gosser, Cyclic Voltammetry: Simulation and Analysis of Reaction Mechanisms, VCH, New York, 1993 Search PubMed.
  40. E. Laviron, J. Electroanal. Chem., 1974, 101, 19–28 CrossRef.
  41. J. I. Gowda and S. T. Nandibewoor, Asian J. Pharm. Sci., 2014, 9, 42–49 CrossRef PubMed.
  42. M. Sharp, M. Petersson and K. Edström, J. Electroanal. Chem., 1979, 95, 123–130 CrossRef CAS.
  43. K. Bodmann, T. Bug, S. Steinbeisser, R. Kreuder and O. Reiser, Tetrahedron Lett., 2006, 47, 2061–2064 CrossRef CAS PubMed.
  44. Z. Rappoport and J. F. Liebman, The Chemistry of Hydroxylamines Oximes and Hydroxamic Acids, John Wiley & Sons, 2009 Search PubMed.
  45. T. J. Mali'n, L. Weidolf, N. Castagnoli Jr and U. Jurva, Rapid Commun. Mass Spectrom., 2010, 24, 1231–1240 CrossRef PubMed.
  46. O. Hammerich and H. Lund, Organic Electrochemistry, Marcel Dekker, New York, 4th edn, 2001 Search PubMed.
  47. T. Ogamino, Y. Ishikawa and S. Nishiyama, Heterocycles, 2003, 61, 73–78 CrossRef CAS PubMed.
  48. M. Jin, Z. Yu and Y. Xia, Russ. J. Electrochem., 2006, 42, 964–968 CrossRef CAS.
  49. R. G. Barradas, M. C. Giordano and W. H. Sheffield, Electrochim. Acta, 1971, 16, 1235–1249 CrossRef CAS.
  50. E. S. Kagan, I. Y. Zhukova, V. V. Yanilkin, V. I. Morozov, N. V. Nastapova, V. P. Kashparova and I. I. Kashparov, Russ. J. Electrochem., 2011, 47, 1199–1204 CrossRef CAS.
  51. I. H. Taşdemir, O. Çakirer, N. Erk and E. Kiliç, Collect. Czech. Chem. Commun., 2011, 76, 159–176 CrossRef.
  52. O. Çakirer and I. H. Taşdemir, Asian J. Chem., 2010, 22, 6353–6365 Search PubMed.

This journal is © The Royal Society of Chemistry 2015