Niraj Kumar and
H. S. Panda*
Department of Materials Engineering, Defence Institute of Advanced Technology, Girinagar, Pune-411025, India. E-mail: himanshusp@diat.ac.in; Tel: +91-20-24304205
First published on 24th February 2015
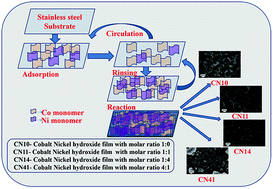
Amorphous Co/Ni hydroxide films were prepared by using a successive ionic adsorption and reaction method (SILAR) on a stainless steel substrate and their electrochemical properties were examined for supercapacitor application. The amorphous nature of the film was confirmed by powder X-ray diffraction. The vertically aligned interconnected nano sheet array morphology with uniform distribution was observed using scanning electron microscopy and atomic force microscopy. Their electrochemical properties were measured by performing cyclic voltammetry, galvanostatic charge–discharge and electrochemical impedance spectroscopy studies in an aqueous electrolyte. The specific capacitance was calculated to be 720 F g−1 at 5 mV s−1 for Co/Ni hydroxide, which shows a substantial improvement in electrochemical capacitance as compared to the pure cobalt hydroxide. The result suggested that the template free deposition method is a promising method for achieving next generation electrode materials.
Among transition metal hydroxides, Co(OH)2 and Ni(OH)2 are appealing for use as electrode materials for supercapacitor applications due to their high specific capacitance16,17 (theoretical specific capacitance is around 3460 and 2584 F g−1 for Co(OH)2 and Ni(OH)2, respectively), low cost, and well-defined electrochemical redox activity.18,19 But the reported specific capacitance is much lower than their theoretical capacitance. Therefore, this encouraged us to synthesize carbon free bimetal hydroxides of Co and Ni by using a new method for achieving better electrochemical properties. It is believed that a bimetal hydroxide matrix will increase the electrochemical reversibility, and hence increase the specific capacitance and stability.
In recent years, many synthesis methods such as electro-deposition,20 sputter deposition,21 chemical bath deposition,22 hydrothermal synthesis,23 the sol–gel method24,25 etc. were adopted to develop various transition metal hydroxides. However, the successive ionic layer adsorption and reaction (SILAR) method has received considerable attention as a soft chemical solution method to deposit a film on various substrates at room temperature. Advantages of the SILAR method are its robust process, excellent material utilization efficiency, control over film thickness, environmentally friendly aspects, flexibility and low cost. In this method, films are deposited on a substrate by alternate immersion in a cationic and an anionic solution numerous times to obtain the desired thickness. Uniform deposition is possible by this method because the basic building blocks are ions instead of atoms. Recently, Dubal et al.26 reported the deposition of sponge like β-Ni(OH)2 on a stainless steel substrate by using the SILAR method, and the specific capacitance was calculated to be 428 F g−1 at 5 mV s−1. Further, Kandalkar et al.27 investigated a Co–Ni thin film on a copper substrate by applying a chemical bath deposition method. They observed irregular shape nano platelets having a specific capacitance of 324 F g−1. Chen et al.28 fabricated a three-dimensional macroporous nickel foam and within that cultivated one dimensional Ni–Co layered double hydroxides by using a hydrothermal co-deposition method. They used cetyl trimethyl ammonium bromide as a nanostructure growing template and the specific capacitance was found to be 2682 F g−1 at 3 Ag−1 for an asymmetrical supercapacitor. Jokar et al.29 synthesized a Ni–Co binary oxide by using a solvo-thermal method and the specific capacitance was saturated at 600 F g−1. Xihong et al.30 synthesized a porous Ni–Co nano sheet array on a fluorine doped tin oxide (FTO) substrate using an electrochemical method and the specific capacitance was measured to be 453 F g−1 at 5 mV s−1. In summary, several attempts have been made to improve the morphology, film thickness, porosity and specific capacitance of transition metal oxides/hydroxides. On the other hand, amorphous metal hydroxides offer unique electrochemical behaviours.31,32 Li et al. showed an improvement in the electrochemical efficiency of amorphous Co(OH)2 due to the disordered structure, which is responsible for providing more transportation channels compared to a highly crystalline structure.33 However, there is no report on amorphous Co/Ni hydroxide films for application as electrode materials. Further, the SILAR method has not yet been implemented to prepare Co/Ni hydroxides. This observation prompted us to standardize the SILAR method as an alternative process to prepare Co/Ni hydroxide, which would improve the electrochemical properties.
In this work, in a fast time we prepared amorphous Co/Ni hydroxide films on a stainless steel (SS) substrate by using the facile and effective SILAR method. The effect of the molar ratios of cobalt and nickel on the structure, morphology and electrochemical properties was investigated. The amorphous Co/Ni hydroxide film with a uniform and porous morphology was confirmed by scanning electron microscopy. The specific capacitance was calculated by performing cyclic voltammetry and charge–discharge electrochemical studies which proved the improvement in capacitive behavior (720 F g−1) with excellent cyclic stability.
Prior to the deposition, the substrate was washed with deionized water, ethanol and acetone, respectively, in an ultrasonic bath for 10 minutes. Three beaker systems were used for depositing the Co/Ni hydroxide film on a substrate. The first beaker contained the different molar ratios of CoSO4·7H2O and anhydrous NiCl2 as the cobalt and nickel source, maintaining the total molar ratio at 0.1. Into that, ammonium hydroxide (NH4OH) was added with constant stirring to adjust the pH (∼12) for making an alkaline solution. When an aqueous ammonia solution was added to the salt solution, the ionic product of nickel and cobalt was insoluble and the solution turned turbid due to the corresponding hydroxide precipitation according to the following reaction:
NiCl2 + 2NH4OH → Ni(OH)2 + 2NH4+ + Cl22− | (1) |
CoSO4 + 2NH4OH → Co(OH)2 + 2NH4+ + SO42− | (2) |
Further addition of more ammonium hydroxide reduces the Ni2+ and Co2+ ion concentration by dissolving the precipitate and forming amminonickel(II) and amminocobalt(II) complexes. The mechanism can be expressed by the following reaction:
Ni(OH)2 + 4NH4+ → [Ni(NH3)4]2+ + 2H2O + 2H+ | (3) |
Co(OH)2 + 4NH4+ → [Co(NH3)4]2+ + 2H2O + 2H+ | (4) |
The substrate was immersed in the above solution for 10 seconds for absorption of the metal complexes onto the substrate to occur due to electrostatic force attraction between the complex ions and the substrate. After that, the substrate was rinsed with deionized water and then placed in the hot water–H2O2 solution (90 °C) for another 10 seconds. As a result, metal complexes were converted to metal hydroxides, and the mechanism is shown below:
[Co(NH3)4]2+ + [Ni(NH3)4]2+ + 2OH− → CoNi(OH)2 + 8NH3 | (5) |
The cycle was repeated 80 times to attain an optimum thickness. Finally, the film deposited substrate was immersed in deionized water to remove loosely bound ions/particles and dried at room temperature. The process was followed to prepare different molar ratios of cobalt to nickel as follows: 1:
0, 1
:
1, 1
:
4 and 4
:
1, labeled as CN10, CN11, CN14 and CN41, respectively for Co/Ni hydroxide films on SS. The mass loading of the deposited material on the substrate (5 × 1 cm2) is 1.7, 2.0, 2.2 and 1.8 mg for samples CN10, CN11, CN14 and CN41, respectively. The schematic representation of the synthesis and the nucleation and growth process is shown in Fig. 1 and 2, respectively.
![]() | ||
Fig. 1 The schematic representation of the SILAR method for the synthesis of Co/Ni hydroxide films on the SS substrate. |
![]() | ||
Fig. 2 Schematic representation of the nucleation and growth process of Co/Ni hydroxide films on the SS substrate. |
The FESEM micrographs of the developed films are shown in Fig. 4. Fig. 4a shows the spherical morphology of film CN10. The average size of the deposited Co nanoparticles is around 43 nm. However, incorporation of nickel into cobalt hydroxide and vice versa causes a change in the morphology from spherical to vertically aligned porous interconnected nanosheet arrays. Further, it is clearly evidenced that the size and thickness of nanosheets array changes by changing the molar ratio of the precursor. The percentage porosity was calculated by using a fast and effective total optical porosity method by using Image J software.34,35 It was calculated by generating a porosity threshold image and was found to be 27, 62, 63 and 71% for CN10, CN11, CN14 and CN41, respectively. The obtained amorphous hydroxide film (CN41) showed a highly hierarchical porous nanosheet array with cavities, which is beneficial to the enhancement of capacitive properties by providing easy charge transport, fast ion/electron transfer, and a short diffusion path for electrochemical reactions.36 With a cobalt to nickel molar ratio of 4:
1 (CN41), the porous nanosheets were distributed evenly and hence improve the electrochemical properties (Fig. 4d).
Again, the impact of porosity on wettability was studied by measuring the contact angle of the developed films. The contact angle was calculated to be 75°, 36°, 32° and 23° for CN10, CN11, CN14 and CN41 films, respectively (Fig. 4, inserts). The measurement suggested that the wettability was increased by changing the molar ratio of Co to Ni which supported the increase in porosity. This might be due to the increase in surface roughness, porosity and strong polar interactions between the water droplets and hydroxide present in the deposited film. Increased wettability37 is a desired feature of electrochemical supercapacitors because of the close interactions at the electrode/electrolyte interface and it also decreases the evolution of oxygen and hydrogen.38
Fig. 5 shows the elemental mapping of the thin films, which provided the information about the distribution of the elements. The elements are homogeneously distributed in the deposited amorphous hydroxide films according to the feeding of precursors, and also, the color of the mapping demonstrates qualitatively the presence of elements in the films.
Further, EDX analysis provides information on the quantitative elemental percentages and an estimation of their relative abundance on the surface. It is clearly seen that the oxygen percentage increased significantly with increase in molar ratio of Ni. This is due to (i) the formation of an amorphous type NiOOH film39 and (ii) the larger interlayer spacing40 of nickel hydroxides and oxyhydroxides facilitates the adsorption and crystallization of water molecules in the interlayer. Further, the increased percentage of oxygen revealed the non-stoichiometric formation of the deposited materials due to their hydrous nature.9 Table 1 shows the weight percentage of different elements in the developed films.
Name of sample | Element (weight%) | ||
---|---|---|---|
Co | Ni | O | |
CN10 | 57 ± 0.9 | 0.00 | 42 ± 0.1 |
CN11 | 27 ± 0.8 | 17 ± 0.4 | 54 ± 0.7 |
CN14 | 8 ± 0.4 | 26 ± 0.7 | 64 ± 0.9 |
CN41 | 38 ± 0.5 | 6 ± 0.2 | 55 ± 0.3 |
Fig. 6 shows the two dimensional (2D) and three dimensional (3D) atomic force microscopy images of the CN14 and CN41 films. To the right of each image, a color scale is shown indicating the height profile of the grains. The color contrast in the images points out the surface roughness of the deposited films. It is seen from the image that the particles in CN14 (Fig. 6a) and CN41 (Fig. 6b) self-assemble with an elevated hill-like distribution and mountain-like vertical distribution, respectively, with prominent roughness profiles. Further, 3D micrographs of the films suggested the relatively greater surface roughness of CN41 compared to CN14, which resulted in more active sites available for electrode/electrolyte interaction.
![]() | ||
Fig. 6 Two dimensional (2D) AFM images of films CN14 (a) and CN41 (b) and three dimensional (3D) AFM images of films CN14 (c) and CN41 (d). |
Cyclic voltammetry (CV) studies were carried out to study and compare the capacitive behavior of the material deposited on the substrate. Fig. 7 shows the CV curves of CN10, CN11, CN14 and CN41 at various scan rates with a potential window of −0.1 to +0.6 V. The shapes of the curves are not rectangular, which indicates that the material has a strong pseudocapacitive behavior. The shape of the curve for the composites of different molar ratios is different due to the different nanostructures and morphologies, and the dissimilar mass loading on the substrate. The CV curves for the films (CN14 and CN41) show a redox reversible peak suggestive of the strong redox behavior of the materials.
The redox peak indicated the quasi reversible transfer process as a result of pseudocapacitive capacitance and also showed the symmetrical positive and negative sweep. The anodic peak occurred due to oxidation of Co/Ni hydroxide and the cathodic peak appeared because of the reverse process. This process can be expressed by following the reversible equations (6) and (7).
Ni(OH)2 + OH− ↔ NiOOH + H2O + e− | (6) |
Co(OH)2 + OH− ↔ CoOOH + H2O + e− | (7) |
The figure also suggested the effect of increasing the scan rate (5 to 100 mV s−1) on the supercapacitive behavior of the amorphous hydroxides. The current under the CV curve slowly increases with increasing the scan rate. The specific capacitance CS was calculated by using the following relation:41
![]() | (8) |
Fig. 9 gives the galvanostatic discharge curves of the developed electrodes at different current densities. The nonlinear and linear shape of the discharge curves indicated the pseudo and double layer capacitance behavior of the electrode materials, respectively. The specific capacitance from the discharge curves was evaluated by using the following equation.41
![]() | (9) |
![]() | ||
Fig. 9 Galvanostatic discharge curves of CN10 (a), CN11 (b), CN14 (c) and CN41 (d) at different current densities. |
The calculated values of the specific capacitance at different current densities is shown in Fig. 10. The calculated specific capacitance of CN41, CN14 and CN11 is significantly higher than that of the pristine CN10 sample. Incorporation of nickel hydroxide into the cobalt hydroxide nanostructure increased the capacitive behavior by improving the morphology, surface area, accessibility of the electrolyte, contribution of their redox pseudocapacitance, and efficient usage of active sites. The cyclic stability study is an important test to understand the electrochemical reversibility and long-term utility of the supercapacitor. The cyclic stability of samples CN14 and CN41 for 2000 cycles at a scan rate of 50 mV s−1 is shown in Fig. 11. Sample CN41 retains 85% and sample CN14 retains 78% of its specific capacitance even after 2000 cycles. A Ragone plot is illustrated in Fig. 11d, which is a plot between energy density and power density. A Ragone plot is an efficient way of evaluating the operational performance of the supercapacitor.
The energy density and power density of the electrode materials were calculated from the galvanostatic discharge curve by using the following equations.41
![]() | (10) |
![]() | (11) |
Fig. 12 shows a Nyquist plot of the developed electrode materials at a frequency range of 100 kHz to 10−1 Hz with a potential amplitude of 0.4 V. The electrochemical impedance spectra (EIS) are helpful for characterizing the frequency response of the charge transfer process and electrochemical reaction at the electrode/electrolyte interface of the active materials. The Nyquist plot consists of real and imaginary parts of the impedance at different frequencies. The high frequency region and fitted equivalent circuit is shown in Fig. 12 (insert). The straight line perpendicular to the real axis at the lower frequency side shows the mass transfer limit and semicircle at high frequency side indicates the faradic charge transfer resistance in the Nyquist plot. In the high-frequency region the intercept of the semicircle with the real axis provides the equivalent series resistance (Rs) and the diameter of the semicircle gives the interfacial charge–transfer resistance (Rct). Rs comes from the solution resistance as well as the contact resistance and Rct is due to the interfacial charge transfer resistance between the electrode and electrolyte. Cp in the equivalent circuit represents the pseudocapacitance and W is the Warburg impedance.43 The slope of the straight line in the low frequency region is the Warburg impedance, which is an effect of ion diffusion resistance between the electrode and electrolyte. The increase in the slope gradient indicates the better capacitive behavior due to a decrease in the diffusion resistance and ion diffusion length of the electrode/electrolyte.44 Table 2 shows the measured and calculated electrochemical resistance parameters, Rs and Rct, for the developed amorphous films. The slope of the Nyquist plot suggests that the composite hydroxide films show an improved capacitive behaviour over the pure cobalt hydroxide (CN10) film. EIS studies further supported the more effective capacitive behaviour and better transportation of charge between the electrode/electrolyte of CN41 over the other developed films.
Sample name | Electrochemical resistance parameter | |
---|---|---|
Rs (Ω cm−2) | Rct (Ω cm−2) | |
CN10 | 2.354 | 2.452 |
CN11 | 1.958 | 2.030 |
CN14 | 1.711 | 1.775 |
CN41 | 1.521 | 1.542 |
This journal is © The Royal Society of Chemistry 2015 |