
Investigation of the reaction progress between stannous chloride and zirconium in molten LiCl–KCl
Yanqing Caia,
Hongxia Liua,
Qian Xu*b,
Qiushi Songa and
Huijun Liuc
aSchool of Materials Science and Metallurgy, Northeastern University, Shenyang, 110004, PR China
bSchool of Materials Science and Engineering, Shanghai University, Shanghai, 200072, PR China. E-mail: qianxu201@mail.neu.edu.cn
cLaboratory for Corrosion and Protection, Institute of Metal Research, Chinese Academy of Sciences, Shenyang, 110016, PR China
First published on 27th March 2015
Abstract
LiCl–KCl–ZrCl4 melt was prepared by an in situ displacement reaction between SnCl2 and Zr in LiCl–KCl melt at 773 K, and the progress of the reaction between SnCl2 and Zr was also investigated by dynamic electrochemical measurements, such as cyclic voltammetry, square wave voltammetry and open circuit chronopotentiometry. The results reveal that the concentration of Zr(IV) increases gradually and reaches a maximum value with the reaction time increasing from 0 to 210 min, while the concentration of Sn(II) decreases gradually and drops below the detection limit. In addition, the chemical analyses of Zr(IV) and Sn(II) in the melt at various times were also carried out and the results are in good agreement with those of the electrochemical measurements. Finally, LiCl–KCl–ZrCl4 melts with a low concentration of Sn(II) (<0.01 wt%) were obtained, when the reaction time was prolonged to 210 min.
Introduction
Zirconium, as a major component, is widely used in nuclear reactors for the cladding of the nuclear fuels and the structural materials due to its low neutron-capture cross-section and high corrosion resistance under normal service conditions.1 However, it must be nearly free of hafnium because of hafnium's large neutron capture cross-section. Hence, the refining of zirconium becomes a technology required substantially for producing hafnium-free zirconium metal.2 The electrochemical refining of molten chlorides with ZrCl4 has been developed as a promising option for zirconium refining from impure zirconium metal, alloy or spent metal fuels.3,4In fact, during the electro-refining process in the molten salt, a low-melting point Cu–Sn–Zr alloy is proposed to be a liquid anode, while the highly pure zirconium can be deposited on the cathode.5 The method would not only reduce the operating temperature, but also provide a low cost and semi-continuous process for the production of the nuclear grade zirconium. The electrorefining of Zr should be carried out in LiCl–KCl–ZrCl4 molten salt at the temperature higher than 773 K considering the melting point of Cu–Sn–Zr alloy as an anode. However, there is a big challenge for preparation of the molten LiCl–KCl–ZrCl4 as an electrolyte, if ZrCl4 is directly introduced into the salt since it is easy to be atomized due to its low boiling point of 331 °C.3,6,7
Several investigators7–10 have attempted to prepare the molten chlorides by the oxidation of metal with CdCl2 in the LiCl–KCl melt, and this method also can eliminate any gasification of the metal chloride with low boiling point because the chloride will preferably dissolve in the melt rather than gasify into the air. Murakami et al.7 have attempted to prepare LiCl–KCl–ZrCl4 melt by the reaction between CdCl2 and zirconium metal according to the eqn (1).
| 2CdCl2(l) + Zr(s) = ZrCl4(l) + 2Cd(l) | (1) |
In our previous work,10 we had prepare LiCl–KCl–ZrCl4 in situ with the equilibration reaction between cuprous chloride and zirconium.
Here, considering that the liquid Cu–Sn–Zr can be used as a liquid anode, and stannous chloride is non-toxic and easily obtained, SnCl2 was selected as the reactant for the displacement reaction with Zr in order to prepare LiCl–KCl–ZrCl4. The liquid Sn displaced can aggregate into the liquid metal, and be removed from the molten salt. The present study focused on in situ catching the change of electrochemical behavior of the melt with the time during the reaction between stannous chloride and zirconium in the LiCl–KCl melt by the electrochemical methods, such as cyclic voltammetry and square wave voltammetry. This dynamically electrochemical measurement and analysis could be expected for monitoring the reaction progress and determining the final of the reaction. The prepared LiCl–KCl–ZrCl4 melt was also characterized, which could be used as the electrolyte in the electrorefining of Zr with the low-melting Cu–Sn–Zr liquid alloy anode in the future research.
Experimental
Electrochemical apparatus and chemicals
All of the electrochemical experiments were conducted under high-purity argon atmosphere. A three-electrode electrochemical cell was assembled in an alumina crucible, which was positioned in a stainless steel vessel and heated with an electric furnace.10 A graphite rod (spectrum pure) having a diameter of 14.0 mm served as the counter electrode (CE), which was provided by the Shanghai new graphite material Co., Ltd. of Sinosteel Corporation (Shanghai, China). A molybdenum wire (99.95% purity) with a diameter of 1.0 mm was used as the working electrode (WE) for the investigation of electrochemical behaviour. The active electrode surface area was determined by measuring the immersion depth of the electrode in the salt after each experiment. The reference electrode (RE) was LiCl–KCl–1.0 wt% AgCl molten salt placed in a close-ended mullite tube with a 1.0 mm (dia.) silver wire (99.999% purity) immersed in it for electrical connections. All potentials in this work will be referred to this electrode unless otherwise stated.A mixture of 400 g LiCl–KCl eutectic salt (59![[thin space (1/6-em)]](https://www.rsc.org/images/entities/char_2009.gif) :41 mol%) was used as the electrolyte, which was dried for more than 72 h at 573 K to remove residual water and then melted under argon atmosphere in an alumina crucible. In order to eliminate the residual water and other possible redox-active impurities, pre-electrolysis of the LiCl–KCl eutectic was conducted at 2.8 V for 2.0 h between two graphite rods prior to the electrochemical experiments. Stannous(II) ions were introduced into the bath in the form of dehydrated SnCl2 powders. Anhydrous zirconium tetrachloride was obtained from Aladdin and used without further purification. All chemicals used in this work were of analytical grade. Molybdenum wire, silver wire, and zirconium wire were supplied by Rare Metallic Co., Ltd of Shenyang, which were used after successively polishing with sandpapers and washing with alcohol.
:41 mol%) was used as the electrolyte, which was dried for more than 72 h at 573 K to remove residual water and then melted under argon atmosphere in an alumina crucible. In order to eliminate the residual water and other possible redox-active impurities, pre-electrolysis of the LiCl–KCl eutectic was conducted at 2.8 V for 2.0 h between two graphite rods prior to the electrochemical experiments. Stannous(II) ions were introduced into the bath in the form of dehydrated SnCl2 powders. Anhydrous zirconium tetrachloride was obtained from Aladdin and used without further purification. All chemicals used in this work were of analytical grade. Molybdenum wire, silver wire, and zirconium wire were supplied by Rare Metallic Co., Ltd of Shenyang, which were used after successively polishing with sandpapers and washing with alcohol.
An AUTOLAB/PGSTAT320 potentiostat from M s−1. EcoChemie, Netherlands controlled with NOVA 1.6 software for square wave voltammetry and GPES 4.9 software for cyclic voltammetry and open circuit chronopotentiometry was employed to conduct the electrochemical tests. A quantitative compositional measurement of the melt at various times was made by using an inductively coupled plasma-atomic emission spectrometer (ICP-AES). In addition, an X-ray diffractometer (XRD) was used to characterize the recovered precipitates.
Experimental procedure
After pre-electrolysis, certain amount of SnCl2 was introduced into LiCl–KCl eutectic, and then a zirconium spiral (99.4% purity) more than the stoichiometric amount was introduced when the salt was in a stable condition. Then displacement reaction between zirconium and SnCl2 occurred. The schematic diagram of the displacement reaction process is shown in Fig. 1. Zr(IV) ions were generated and entered the molten salt during the displacement reaction, and tin was produced in the form of droplets because of the low-melting point and then deposited at the bottom of the crucible. During the reaction process, the electrochemical behaviour of Zr(IV) and Sn(II) were investigated to monitor the reaction progress by cyclic voltammetry, square wave voltammetry and open circuit chronopotentiometry at various times. Cyclic voltammetry was carried out by changing the applied potential as a scan rate of 100 mV s−1, and the objective was to determine the redox peak potentials of zirconium and tin in LiCl–KCl melt. Meanwhile, the melt was sucked out at various times by a quartz tube during the reaction process, and the concentrations of tin and zirconium in the melt were determined by the ICP-AES analysis. | ||
| Fig. 1 Schematic diagram of the displacement reaction. | ||
Results and discussion
Cyclic voltammograms for LiCl–KCl melt, LiCl–KCl–SnCl2 melt and LiCl–KCl–ZrCl4 melt
A group of typical cyclic voltammograms (CVs) recorded at a molybdenum working electrode are exhibited in Fig. 2, which are performed in LiCl–KCl melt (curve 1) and the melt with the addition of 0.36 wt% SnCl2 (curve 2) and 0.25 wt% ZrCl4 (curve 3), respectively. The purpose is to determine the redox peak potentials of zirconium and tin in LiCl–KCl melt, which will provide the basal potentials for the determination of zirconium and tin redox peaks in the displacement reaction process. The cathodic peak A′ at −2.50 V vs. Ag/AgCl and the corresponding anodic peak A are observed as shown in curve 1, which correspond to the deposition and dissolution of metal Li.11 In the CV of LiCl–KCl–0.36 wt% SnCl2 melt as shown in curve 2, the small cathodic peak T′ at around −0.50 V is attributed to the reduction of Sn2+ to metallic Sn. Then the corresponding anodic peak observed at −0.30 V is related to the oxidation of Sn to Sn(II).12,13 What's more, another three couples G1/G′1, G2/G′2 and G3/G′3 are observed at potentials between −2.0 and −2.5 V, which should be attributed to the formation and dissolution of Sn–Li intermetallic compounds.14 The results are in good agreement with the Sn–Li phase diagram,15 which has four intermetallic compounds, i.e., Li5Sn2, Li13Sn5, Li7Sn2, and Li22Sn5. Among them, the first two are probably too close in composition that they could not be distinguished by means of cyclic voltammetry. | ||
| Fig. 2 CVs of blank LiCl–KCl melt (curve 1), LiCl–KCl–0.36 wt% SnCl2 melt (curve 2) and LiCl–KCl–0.25 wt% ZrCl4 (curve 3, the inset) on molybdenum electrode at 773 K. Apparent electrode area: 0.628 cm2, scan rate: 100 mV s−1. | ||
In the CV of LiCl–KCl–0.25 wt% ZrCl4 melt, several new peaks appear compared to the CV of LiCl–KCl melt (curve 1) as shown in curve 3. According to the references reported by several investigators,3,6,16–18 the two cathodic peaks E′ and C′ at around −1.15 and −1.22 V are related to the multi-step reduction of zirconium, which are corresponding to the reactions given in eqn (2)–(4). What's more, Sakamura17 has also reported another peak D′ at −1.65 V in LiCl–KCl melt containing 1.07 wt% ZrCl4, which corresponds to the reduction of ZrCl to Zr. Correspondingly, another reaction related to the reduction of Zr(IV) to ZrCl is also observed at peak C′. It might be explained by the reduction mechanism of Zr(IV). Competitive reactions between the reduction of Zr(IV) to ZrCl and Zr(IV) to Zr exist during the reduction of Zr(IV). At high concentrations of Zr(IV), Peak C′ is attributed to the reduction of Zr(IV) to ZrCl and Zr simultaneously. However, at low Zr(IV) concentrations, Zr(IV) would only reduce to Zr.17 Therefore, in the present work, the ZrCl4 concentration is so low (0.25 wt%) that the reduction peak of Zr(IV) to ZrCl at peak C′ and the following reduction peak of ZrCl to Zr are not observed.
For the oxidation process, the corresponding anodic peaks C and E are found at around −0.95 and −0.88 V, which relate to the oxidation of Zr to Zr(II) and Zr(IV), and Zr(II) to Zr(IV), respectively, as shown in eqn (5)–(7). Among them, peak E is not very clear and always masked by peak C3.
| Peak E′: Zr(IV) + 2e → Zr(II) | (2) |
| Peak C′: Zr(IV) + 4e → Zr | (3) |
| Zr(II) + 2e → Zr | (4) |
| Peak C: Zr − 4e → Zr(IV) | (5) |
| Zr − 2e → Zr(II) | (6) |
| Peak E: Zr(II) − 2e → Zr(IV) | (7) |
Due to low concentration and diffusion rate of the cations, e.g., Zr4+and Sn2+, the reductions are controlled by the diffusion process and the rates are relatively slow, leading to small reduction peaks, such as T′, E′ and C′. However, the reductions continue when the potential keeps on sweeping to the negative direction, with more reduzates depositing. Subsequently, the oxidation rates of the deposited tin and zirconium are relatively high, which are controlled by the electrochemical process, and the corresponding anodic peaks are prominent.3
Displacement reaction process
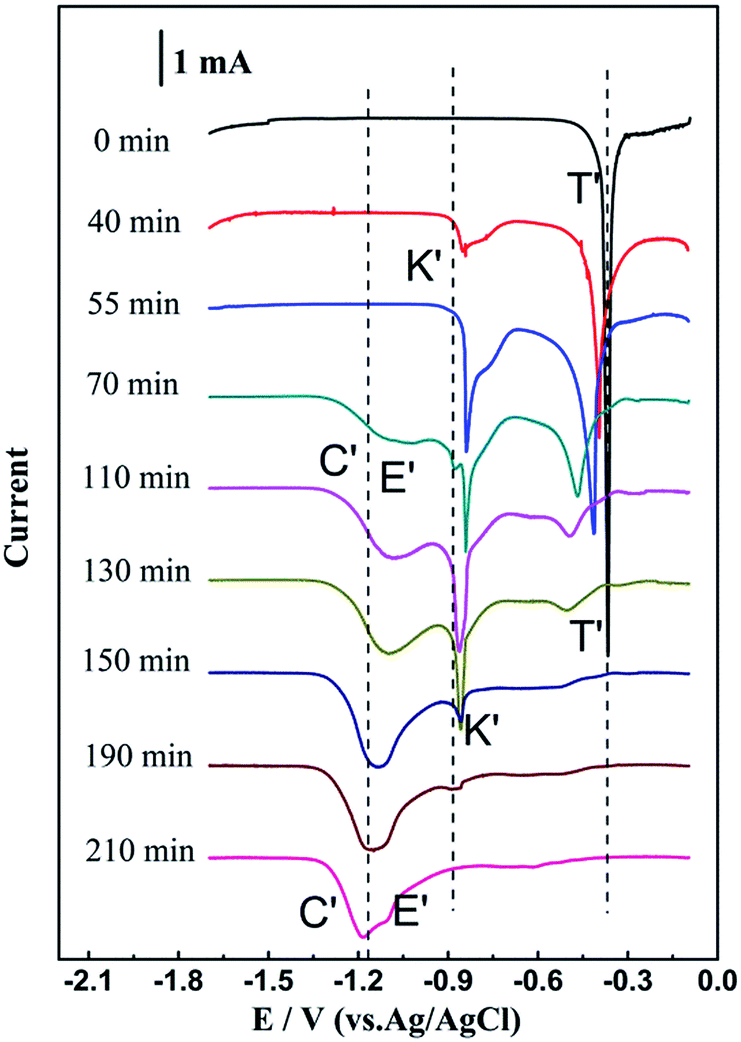
The reaction between SnCl2 and Zr started when an excess of Zr was added into LiCl–KCl eutectic salt with 0.57 wt% SnCl2. The reaction process was monitored by in situ recording CVs, as shown in Fig. 3. It is obvious that the electrochemical behaviours of tin and zirconium are changed with the progress of the reaction, which would be analysed in detail below. | ||
| Fig. 3 CVs of LiCl–KCl–0.57 wt% SnCl2 melt with excessive Zr spiral at various times during the displacement reaction on molybdenum electrode at 773 K. Apparent electrode area: 0.628 cm2, scan rate: 100 mV s−1. | ||
After the introduction of zirconium spiral, a declining trend of the redox peaks of Sn2+/Sn couple is observed, as shown in Fig. 3 (0–210 min). The result proves that the reaction between SnCl2 and Zr goes smoothly according to eqn (8), which is thermodynamically favorable according to the very high value of equilibrium constant.19
| [Zr] + 2(SnCl2) → 2[Sn] + (ZrCl4), KΘ773 K = 1.25 × 10¹⁹ | (8) |
It is very important to detect the Sn(II) concentration because it can reveal the reaction progress. In addition, as an impurity of the final LiCl–KCl–ZrCl4 melt, the final Sn(II) concentration should be strictly controlled. To obtain more details about the Sn(II) concentration, the high-resolution CVs of cathodic peak T′ at different times in Fig. 3 are presented in Fig. 4(a). Apparently, a declining trend about the cathodic peak currents is observed. To further explore the relationship between Sn(II) concentration and peak current, the variation of the cathodic peak T′ at various Sn(II) concentrations (co) was also studied and shown in Fig. 4(b). A linear relationship between the peak current Ipc and co is obtained and shown in the inset of Fig. 4(b), according to the Berzins–Delahay equation as shown in eqn (9).20 The calculated Sn(II) concentrations at various times in Fig. 4(a) are exhibited in Table 1 according to eqn (9).
| Ipc = −0.157co | (9) |
 | ||
| Fig. 4 (a) High-resolution CVs of the cathodic peak T′ in Fig. 3, and (b) CVs of LiCl–KCl–SnCl2 melt at various Sn(II) concentrations on molybdenum electrode at 773 K, the inset shows the relationship between the peak current Ipc and co(Sn(II)). Scan rate: 100 mV s−1. | ||
| Time/min | Ip/A cm−2 | ccal/wt% | cICP/wt% |
|---|---|---|---|
| 0 | −0.0553 | 0.352 | 0.356 |
| 30 | −0.0479 | 0.305 | 0.285 |
| 55 | −0.0320 | 0.204 | 0.199 |
| 70 | −0.0211 | 0.134 | 0.128 |
| 115 | −0.0148 | 0.094 | 0.092 |
| 150 | −0.0089 | 0.067 | 0.068 |
| 160 | −0.0062 | 0.039 | 0.037 |
| 190 | −0.0040 | 0.025 | 0.023 |
| 210 | −0.0010 | 0.006 | <0.01 |
For verifying the accuracy of the calculated results, Sn(II) concentration was also determined by ICP-AES analysis, as shown in Table 1. By comparison, good agreement is found between the measured and calculated data under all conditions examined, implying that eqn (9) can be used for assuming the concentration of Sn(II) and monitoring the reaction progress. Additionally, it shows that the reaction has fully completed within 210 min.
The peaks for the couple K/K′ appear after the displacement reaction last for 30 min and then increase to the maximum value until 115 min, and finally decrease and disappear. The reason is that the formation of these intermetallic compounds firstly increases and then declines with the passage of reaction time, as the concentration of Sn(II) decreases and Zr(IV) increases. Meanwhile, the peaks for couples C/C′ and E/E′ appear and increase gradually when the reaction time reaches to 150 min. which are corresponding to the couples Zr(IV)/Zr(II), and Zr(II)/Zr and Zr(IV)/Zr, respectively, according to Fig. 2. It indicates that apart from the formation of Sn–Zr intermetallic compounds, the reduction and oxidation of zirconium occur when the Zr(IV) ions are excessive in the melt. Finally, the peak currents of C/C′ and E/E′ increase continuously and go to the maximum value while T/T′ and K/K′ disappear, which suggests the completion of the reaction.
CV was performed when the displacement reaction time reached 210 min, as shown in Fig. 3 (b, 210 min), and the peaks for couples C/C′ and E/E′ are both observed. All peaks are consistent with the behaviour of zirconium in Fig. 2 (curve 3), which is measured by the directly introducing of the ZrCl4, implying that the generated Zr ions in the melt are in the form of Zr(IV). Additionally, no current peaks corresponding to Sn are observed, suggesting that all the Sn(II) ions have been reduced to metallic form within 210 min and only Zr(IV) remains in the melt.
Square wave voltammetry
To further confirm the cathodic peaks K′, C′ and E′, square wave voltammetry, a method more sensitive than the conventional cyclic voltammetry, was carried out to further monitor the displacement reaction progress in situ.23–25Fig. 5 shows a series of square wave voltammograms (SWVs) detected at different times during the reaction between SnCl2 and Zr in LiCl–KCl–0.57 wt% SnCl2 melt at a step potential of 1 mV and frequency of 15 Hz. Before the introduction of zirconium (0 min), a large cathodic signal (peak T′) is observed at −0.45 V, which is associated with the reduction of Sn(II) to metallic Sn. After the introduction of zirconium (40–210 min), the peak currents of T′ decrease gradually with the peak potential shifting negatively, indicating that the Sn(II) concentration declines with the progress of reaction. What's more, a new reduction peak K′, corresponding to the Sn–Zr intermetallic compounds obtained at −0.95 V, is observed from 40 to 190 min. The peak current of K′ firstly increases and then decreases, and finally disappears from the curves. Simultaneously, when the reaction time prolongs to 70 min, peaks of C′ and E′ appear, which are attributed to the multi-step reduction of zirconium. It indicates that there is excess Zr(IV) remaining in the melt after the formation of Sn–Zr intermetallics. From 70 to 210 min, peak currents of C′ and E′ increase gradually, which suggests the increase of the Zr(IV) concentrations in the melt. Finally, only peaks C′ and E′ remain until 210 min, and peaks T′ and K′ have completely disappeared. It implies that the reaction is completed, and Sn(II) ions are exhausted while only Zr(IV) ions remain. The results of square wave voltammetry are in excellent agreement with those obtained from the CV measurements.
 | ||
| Fig. 5 SWVs of LiCl–KCl–0.57 wt% SnCl2 melt with excessive Zr spiral at various times during the displacement reaction on molybdenum electrode at 773 K. Apparent electrode area: 0.628 cm2, frequency: 20 Hz, pulse height: 15 mV, potential step: 1 mV. | ||
Open circuit chronopotentiometry
In order to further investigate the progress of displacement reaction, open circuit chronopotentiometry was performed for observing the formation and dissolution of metals and intermetallic compounds. During the reaction process, a thin layer of alloy was firstly prepared by cathodic deposition on the molybdenum electrode for a period of 10 s at −2.60 V. Then the open-circuit potential of the electrode was registered as a function of time after switching off the potentiostatic control. After that, the potential plateaus equal to biphasic equilibrium of coexisting states at the electrode surface would be observed.21,23Fig. 6 illustrates a set of open circuit chronopotentiograms (OCPs) obtained at different periods during displacement reaction. Curve (I) provides an OCP measured in LiCl–KCl–0.57 wt% SnCl2 melt before the introduction of Zr. In the beginning, a stable potential at around −2.50 V (plateau a) is observed, which refers to the Li+/Li equilibrium potential. Afterwards, three new plateaus b1, b2, b3 at −2.05, −2.20, and −2.32 V are obtained respectively, which are related to the dissolution of Sn–Li intermetallic compounds. Finally, plateau c located at −0.38 V appears, which is associated with the equilibrium potential of Sn2+/Sn redox couple. What's more, plateau k at −0.2 V should be associated with the open circuit potential of molybdenum electrode. Curve (II) shows an OCP obtained after the reaction reaches 60 min. Apart from the plateaus observed in curve (I), a new plateau d1 is observed at −0.75 V, which should correspond to one of the Sn–Zr intermetallic compounds. With the reaction reaching 140 min, new plateaus d2, d3, e and f are observed in the potential range from −0.85 to −1.10 V in curve (III), respectively. Similarly, plateaus d2 and d3 should be correlated with the formation of the other two Sn–Zr intermetallic compounds. Additionally, plateau f should be associated with the deposited Zr corresponding to the equilibrium potential of Zr(IV)/Zr and Zr(II)/Zr redox couples, and plateau e might correspond to Zr(IV)/Zr(II) couple, which is coincident with the signal of Sn–Zr intermetallic compound (plateau d3). When the displacement reaction is over, the OCP obtained at 210 min is shown in curve (IV). It is obvious that plateau f becomes more defined than that in curve (III), which can be deduced that more metallic Zr has been deposited on the electrode surface with the increasing reaction time. It is rather remarkable that plateaus c, d1 and d2 disappear from curve (IV), which indicates the absence of Sn(II) ions. Moreover, the plateau at −1.0 V should only correspond to Zr(IV)/Zr(II) couple (plateau e) at this time. Apparently, the results obtained by the open circuit chronopotentiometry test are well consistent with those observed in the CVs and SWVs.
 | ||
| Fig. 6 OCPs of LiCl–KCl–0.57 wt% SnCl2 melt after electrodepositing at −2.60 V vs. Ag/AgCl for 10 s on molybdenum electrode at 773 K. (I) Before the introduction of Zr spiral, 0 min, (II) after the introduction of excessive Zr spiral for 60 min, (III) 140 min and (IV) 210 min. Apparent electrode area: 0.628 cm2. | ||
Characterization of the melt and byproducts
To further investigate the progress of the reaction, the concentrations of tin and zirconium in the melt were determined by the ICP-AES analysis at various times. Fig. 7 exhibits the variation of Sn and Zr concentrations with reaction time in LiCl–KCl melt containing 1.14 wt% SnCl2. The concentration of Sn decreases gradually while the concentration of Zr increases as the reaction prolongs. What's more, the reaction rate in the beginning (0–70 min) is higher than later (70–210 min). This may be because the concentrations of the reactants (SnCl2, Zr) in the initial stage are high, then the reaction is fast. In the second stage, the concentration of Sn(II) decreases continuously and drops to below the detection limit of the ICP-AES analysis with the reaction time prolonging to 210 min. The concentration of Zr increases to the maximum value, indicating that almost all of Sn(II) has reacted with Zr metal and the reaction is completely finished within 210 min. The ICP-AES analysis results are well consistent with the electrochemical measurement results. | ||
| Fig. 7 The effect of reaction time on concentration of Sn and Zr dissolved in LiCl–KCl–1.14 wt% SnCl2 melt. | ||
However, with the reaction continuing, there is a slight decline with the concentration of Zr(IV). The slight decline of Zr(IV) may be explained from two aspects. On the one hand, it may be explained by the eqn (10). Zr(IV) is attacked by excessive Zr and forming Zr(II), which might have a low solubility in the melt. In addition, Basile16 and Sakamura18 have also investigated the corrosion of Zr with ZrCl4, and the former insisted that Zr(II) chloride is insoluble. Both of them agree that the ZrCl2 generated in eqn (10) is unstable and would disproportionate to ZrCl4 and metallic Zr powders, according to eqn (11). In the authors' review, the reactions (10) and (11) might be approximately reversible, and Zr(II) might have a low solubility in the melt, leading the decline of Zr(IV). On the other hand, the soluble Zr(IV) and partly soluble Zr(II) chlorides easily reacted with oxygen, which may be introduced by the moisture in the flowing argon, resulting in the formation of insoluble ZrO2 and the final decrease of the zirconium concentration in the melt.1 In a word, the final zirconium content remains nearly constant and the measured CV does not change in shape after a long time contact between Zr and Zr(IV), indicating that the existence of Zr(II) in the melt may do not have any influence.18 Finally, almost all the zirconium ions remained in the melt are in the form of Zr(IV).
| ZrCl4 + Zr → 2ZrCl2 | (10) |
| 2ZrCl2 → ZrCl4 + Zr | (11) |
To further confirm the final concentration of Zr(IV), a series of displacement experiments with different initial SnCl2 concentrations (0.57 wt%, 1.14 wt% and 2.09 wt%) and excess Zr were conducted. And the masses of Zr, before and after the displacement experiment and dissolved in the melt were measured. Table 2 shows the comparison of the calculated weight losses of zirconium (m1) and experimental weight losses of zirconium (m2), and the final masses of zirconium dissolved in the melt (m3) with different initial SnCl2 concentrations.
| Test no. | Initial concentration of SnCl2 (wt%) | m1a/g | m2b/g | m3c/g | Final concentration of ZrCl4 (wt%) |
|---|---|---|---|---|---|
| a m1-calculated weight loss of zirconium.b m2-experimental weight loss of zirconium.c m3-mass of zirconium dissolved in melt. | |||||
| 1 | 0.57 | 0.55 | 0.94 | 0.43 | 0.28 |
| 2 | 1.14 | 1.10 | 2.68 | 0.89 | 0.57 |
| 3 | 2.09 | 2.01 | 2.91 | 1.83 | 1.17 |
Among them, test no. 1 is corresponding to the electrochemical tests and test no. 2 is corresponding to the ICP-AES analysis in Fig. 7. By comparison, the experimental weight losses of zirconium are higher than the calculated data by eqn (8), while the dissolved masses of zirconium are lower than them. Combing with the above interpretations, the possible reason is that there are two kinds of contributions to the weight losses of zirconium. One is due to the participation in the displacement reaction, and the other is the participation in the reaction shown in eqn (10). This results in the increase of the experimental weight losses and the decrease of the dissolved zirconium masses. However, due to the equilibrium between the eqn (10) and (11), the dissolved zirconium is slightly less than the calculated value. Finally, the LiCl–KCl–ZrCl4 melts are obtained with relatively stable concentrations of ZrCl4 (0.28–1.17 wt%).
The tin and zirconium precipitates were obtained and characterized as shown in Fig. 8. A clear layer structure with dark grey precipitates at the bottom and the molten salt in the upper layer are observed according to their different densities. After washing with water, the precipitates are determined as a mixture of Sn, ZrSn2, ZrSn, ZrO2 and Zr by the XRD analysis as shown in Fig. 8(b). Undoubtedly, metallic Sn is obtained by the displacement reaction, while zirconium powders are caused by the disproportionation reaction of ZrCl2. Then ZrSn2 and ZrSn are formed spontaneously with low formation energies. ZrO2 is obtained due to the oxidation of metallic zirconium powders during the washing and drying process, as they are easily oxidized even at low temperatures in accordance with the calculation by the HSC code,3 as well as by the oxidization and hydroxylation of zirconium chlorides. Its formation can be avoided in the continuous operation. In the actual refining experiment, the recovered copper and zirconium would be returned to the liquid Cu–Sn–Zr alloy at the bottom of the crucible for reusing continuously in the electrorefining process.
 | ||
| Fig. 8 (a) Photo of the melt and products, and (b) XRD pattern of the products at the bottom of the crucible. | ||
Conclusions
The in situ preparation of LiCl–KCl–ZrCl4 melt by the displacement reaction between Zr and SnCl2 was investigated in LiCl–KCl molten salt at 773 K, and the reaction progress was also monitored in situ by a series of electrochemical methods, such as cyclic voltammetry, square wave voltammetry and open circuit chronopotentiometry. The electrochemical results reveal that the concentration of Zr(IV) gradually increases with the decline of Sn(II) concentration and reaches to the maximum value, while Sn(II) drops to below the detection limit when the reaction time prolongs to 210 min. The chemical analyses of Zr(IV) and Sn(II) are in good agreement with the electrochemical results. As a result, the reaction progress between SnCl2 and zirconium is clearly presented, and LiCl–KCl–ZrCl4 melts with low concentration of Sn(II) (<0.01 wt%) are obtained, which is proposed to be used as electrolyte in the electrorefining of Zr with the low-melting Cu–Sn–Zr liquid alloy anode in the future.Acknowledgements
The authors acknowledge the financial support of National Natural Science Foundation of China (Grant no. 51174055).Notes and references
- D. L. Douglass, Metallurgy of zirconium, Univ. of California, Los Angeles, 1971 Search PubMed.
- W. J. Kroll and F. E. Bacon, US Pat., 443, 253, 1948.
- C. H. Lee, K. H. Kang, M. K. Jeon, C. M. Heo and Y. L. Lee, J. Electrochem. Soc., 2012, 159, D463 CrossRef CAS PubMed.
- K. T. Park, T. H. Lee, N. C. Jo, H. H. Nersisyan, B. S. Chun, H. H. Lee and J. H. Lee, J. Nucl. Mater., 2013, 436, 130 CrossRef CAS PubMed.
- Y. Xiao, A. V. Sandwijk, Y. Yang and V. Laging, Molten Salts Chem. Technol., 2014, 389 Search PubMed.
- J. Park, S. Choi, S. Sohn, K. Kim and I. S. Hwang, J. Electrochem. Soc., 2014, 161, H97 CrossRef CAS PubMed.
- T. Murakami and T. Kato, J. Electrochem. Soc., 2008, 155, E90–E95 CrossRef CAS PubMed.
- S. Kuznetsov, H. Hayashi, K. Minato and M. Gaune-Escard, J. Electrochem. Soc., 2005, 152, C203 CrossRef CAS PubMed.
- S. Ghosh, S. Vandarkuzhali, N. Gogoi, P. Venkatesh, G. Seenivasan, B. P. Reddy and K. Nagarajan, Electrochim. Acta, 2011, 56, 8204 CrossRef CAS PubMed.
- Y. Q. Cai, H. X. Liu, Q. Xu, Q. S. Song and L. Xu, Electrochim. Acta, 2015, 161, 177 CrossRef CAS PubMed.
- H. Tang, Y. D. Yan, M. L. Zhang, X. Li, Y. Huang, Y. L. Xu, Y. Xue, W. Han and Z. J. Zhang, Electrochim. Acta, 2013, 88, 457 CrossRef CAS PubMed.
- H. El Ghallali, H. Groult, A. Barhoun, K. Draoui, D. Krulic and F. Lantelme, Electrochim. Acta, 2009, 54, 3152 CrossRef CAS PubMed.
- H. Groult, H. El Ghallali, A. Barhoun, E. Briot, L. Perrigaud, S. Hernandorena and F. Lantelme, Electrochim. Acta, 2010, 55, 1926 CrossRef CAS PubMed.
- Q. Xu, C. Schwandt and D. J. Fray, J. Electroanal. Chem., 2004, 562, 15 CrossRef CAS PubMed.
- W. G. Moffatt, The handbook of binary phase diagrams, Genium Pub. Corp., 1976 Search PubMed.
- F. Basile, E. Chassaing and G. Lorthioir, J. Appl. Electrochem., 1981, 11, 645 CrossRef CAS.
- S. Ghosh, S. Vandarkuzhali, P. Venkatesh, G. Seenivasan, T. Subramanian, B. Prabhakara Reddy and K. Nagarajan, J. Electroanal. Chem., 2009, 627, 15 CrossRef CAS PubMed.
- Y. Sakamura, J. Electrochem. Soc., 2004, 151, C187 CrossRef CAS PubMed.
- I. Barin, Thermochemical data of pure substances, Wiley-VCH Verlag GmbH, Weinheim, 1995 Search PubMed.
- A. J. Bard and L. R. Faulkner, Electrochemical methods: fundamentals and applications, Wiley, New York, 1980 Search PubMed.
- X. Li, Y. D. Yan, M. L. Zhang, Y. Xue, H. Tang, D. B. Ji and Z. J. Zhang, RSC Adv., 2014, 4, 40352 RSC.
- W. Xiao and D. Wang, Chem. Soc. Rev., 2014, 43, 3215 RSC.
- Y. L. Liu, Y. D. Yan, W. Han, M. L. Zhang, L. Y. Yuan, K. Liu, G.-A. Ye, H. He, Z.-F. Chai and W. Q. Shi, RSC Adv., 2013, 3, 23539 RSC.
- L. Wang, Y. L. Liu, K. Liu, S. L. Tang, L. Y. Yuan, L. L. Su, Z. F. Chai and W. Q. Shi, Electrochim. Acta, 2014, 147, 385 CrossRef CAS PubMed.
- Y. Liu, Y. Yan, W. Han, M. Zhang, L. Yuan, R. Lin, G. Ye, H. He, Z. Chai and W. Shi, Electrochim. Acta, 2013, 114, 180 CrossRef CAS PubMed.
| This journal is © The Royal Society of Chemistry 2015 |