A study of the structure–activity relationship of the electrochemical performance and Li/Ni mixing of lithium-rich materials by neutron diffraction†
Enyue Zhaoa,
Zhongbo Hua,
Lei Xieb,
Xiping Chenb,
Xiaoling Xiao*a and
Xiangfeng Liu*a
aCollege of Materials Science and Opto-electronic Technology University of Chinese Academy of Sciences, Beijing 100049, China. E-mail: xlxiao@ucas.ac.cn; liuxf@ucas.ac.cn; Tel: +86 10 8825 6655 Tel: +86 10 8825 6840
bInstitute of Nuclear Physics and Chemistry, China Academy of Engineering Physics, Mianyang 621999, China
First published on 19th March 2015
Abstract
0.3Li2MnO3·0.7LiNi0.5−xMn0.5−xM2xO2 (M = Mg or Al, x = 0–0.08) samples have been synthesized by a combination of co-precipitation (CP) and solid-state reaction. Electrochemical measurements show that not only can the charge–discharge capacity of lithium-rich materials be enhanced, but more importantly, the rate capacity can be greatly improved by doping with magnesium and aluminum. At a current density of 400 mA g−1, the 0.3Li2MnO3·0.7LiNi0.46Mn0.46Mg0.08O2 and 0.3Li2MnO3·0.7LiNi0.49Mn0.49Al0.02O2 electrodes deliver discharge capacities of 135 mA h g−1 and 127 mA h g−1, respectively, while the pristine electrode delivers a discharge capacity of only 10 mA h g−1. Through studying the structure of lithium-rich materials, we find that the Li/Ni mixing of lithium-rich materials is reduced by doping with magnesium and aluminum, in turn, the performance of doped lithium-rich materials is improved greatly. Furthermore, compared with Al-doped lithium-rich materials, the Li/Ni mixing of Mg-doped materials is further reduced. So the performance improvement of Mg-doped lithium-rich materials is more obvious than that of Al-doped materials.
1. Introduction
As energy storage devices with high power and high energy density, lithium-ion batteries (LIBs) have been widely utilized as power sources for portable electronics, such as laptops, mobile phones, cameras and so on. However, the energy density of current LIBs is still not enough for electric vehicles (EVs) and hybrid electric vehicles (HEVs).1–7 The low energy density of current LIBs mainly results from the low charge–discharge capacity of the cathode materials. Nowadays, layered LiCoO2 is still the commonly used cathode material of commercial rechargeable lithium batteries, which can only provide a practical capacity of 140 mA h g−1. Over the past few decades, considerable effort has been devoted to developing new cathode materials including layered LiNi0.8Co0.2O2 and LiNi0.333Co0.333Mn0.333O2, spinel LiMn2O4 and LiNi0.5Mn1.5O4, olive LiFePO4, and so on.8–11 However, the rechargeable capacity for all of these cathode materials is less than 200 mA h g−1, which still does not meet the demand for EVs and HEVs. So more and more effort has been focused on exploiting new cathode materials.In recent years, lithium-rich layered oxide materials (LLOs, represented by either Li(1−2x)/3NixMn(1−x)/3O2 or xLi2MnO3·(1 − x)LiMO2, in which M is a transition metal or a mixture of transition metals) have been extensively researched as a prospective cathode material for Li-ion batteries because of their high capacity 250–300 mA h g−1, which is almost twice that of LiCoO2.12–18 It has been reported that these samples are composed of two phases, namely, a parent trigonal LiMO2 phase and a monoclinic Li2MnO3 phase.19–22 The higher capacity of LLOs is believed to be partially due to the monoclinic Li2MnO3 phase, which can stabilize the structure of the trigonal LiMO2 phase during Li-extraction (charge).20,21 But the lithium-rich layered oxide materials still have some drawbacks, such as transition-metal ion solubility in the electrolyte, low first cycle efficiency, poor cycling stability and relatively poor rate capability.21–24
Based on this, some approaches have been extensively applied to improve these drawbacks, such as nanoscaling and coating.25–33 In addition, element doping is another effective method for enhancing the performance of LLOs. For example, it has been reported that the electrochemical properties of LLOs can be greatly improved by doping with Cr, Co, Ru, Ti, Zr and so on.34–39 The discharge capacity of Cr-doped LLOs was increased by 15% compared with the pristine electrode, and doping with Cr also improved the rate capability of the LLOs which exhibited a discharge capacity of 191 mA h g−1 at a current density of 300 mA g−1. Meanwhile, the Coulombic efficiency of the Cr-doped electrodes was evidently higher than that of the pristine material.35 The Co-doped LLOs exhibited the highest initial efficiency of 78.8% and the highest energy density of 858.4 mW h g−1, while the undoped sample showed the lowest values of 56.5% and 590.1 mW h g−1.36 So why can element doping improve the electrochemical performance of LLOs and what is the influence of element doping on the structure of LLOs? The answers to these essential questions are still not clear.
In this study, we employ Mg and Al as an additional dopant to synthesize a series of Mg-doped and Al-doped 0.3Li2MnO3·0.7LiNi0.5−xMn0.5−xM2xO2 (M = Mg or Al) powders. The structure and electrochemical properties of the 0.3Li2MnO3·0.7LiNi0.5−xMn0.5−xM2xO2 samples have been studied in detail in this paper. The 0.3Li2MnO3·0.7LiNi0.46Mn0.46Mg0.08O2 (4 mol% Mg-doped) electrode delivers a discharge capacity of approximately 188 mA h g−1 and the 0.3Li2MnO3·0.7LiNi0.49Mn0.49Al0.02O2 (1 mol% Al-doped) electrode delivers 170 mA h g−1 after 80 cycles, while the discharge capacity of the pristine electrode is only 140 mA h g−1. Additionally, the rate capability of LLOs can be greatly improved by doping a small amount of Mg or Al. We also focused on the reasons why doping can improve the performance of lithium-rich layered oxide materials and why the performance improvement magnitude of Mg-doped lithium-rich layered oxide materials is greater than the magnitude of Al-doped materials. Through studying the structure of lithium-rich materials, we find that the Li/Ni mixing of doped lithium-rich materials is reduced by doping with magnesium and aluminum and that the performance of the lithium-rich materials is greatly improved. Furthermore, the Li/Ni mixing of Mg-doped LLOs is lower than that of Al-doped LLOs. So the performance improvement magnitude of Mg-doped LLOs is greater than the magnitude of Al-doped LLOs.
2. Experimental section
2.1. Material preparation
The 0.3Li2MnO3·0.7LiNi0.5−xMn0.5−xMg2xO2 (100× mol% Mg-doped, x = 0–0.08) and 0.3Li2MnO3·0.7LiNi0.5−xMn0.5−xAl2xO2 (100× mol% Al-doped, x = 0–0.08) samples were synthesized by a combination of co-precipitation (CP) and solid-state reaction. Stoichiometric amounts of nickel(II) sulfate, manganese(II) sulfate, aluminum(III) sulfate and magnesium chloride were dissolved in deionized water. 2 M of NH4HCO3 solution and 1 mL NH3·H2O (28–30%) were added dropwise into the above solution under severe stirring. The mixed carbonate precipitate was then filtered, washed, and dried overnight at 80 °C. The mixed carbonate precipitate was then ground with 5 mol% excessive LiOH·H2O, and calcined at 800 °C for 12 h.2.2. Material characterization
The crystal structure of the samples was characterized using an X-ray diffractometer (Persee XD2) equipped with Cu-Kα radiation (α = 1.5418). Inductively coupled plasma (ICP) measurements were carried out using an Agilent 7500ce ICP-MS. The particle morphology of the powders after calcination was observed using a scanning electron microscope. XPS was conducted on the samples to determine the oxidation states of Ni and Mn. XPS spectra were obtained using a Kratos Axis ULTRA X-ray photoelectron Spectrometer under UHV conditions. For the XPS measurements, the energy of the photoelectrons ejected when the sample was irradiated by soft X-rays (usually Al Kα) was analyzed. Monochromatic Al Kα (1486 eV) radiation was the primary excitation source in our experiments. Peak fits of all spectra were performed using the Shirley background correction and Gaussian–Lorentzian curve fits. The energy scale was adjusted based on the graphite peak in the C 1s spectrum at 284.78 eV. Neutron diffraction experiments were performed at room temperature using a neutron powder diffractometer at the Institute of Nuclear Physics and Chemistry, PR China.2.3. Electrochemical measurements
A two-electrode electrochemical cell was used in the electrochemical characterization by galvanostatic cycling. The composite positive electrodes were prepared by a slurry coating procedure. The slurry was made by mixing 82 wt% active materials, 10 wt% carbon black, and 8 wt% polyvinylidene fluoride (PVDF) in N-methyl pyrrolidinone (NMP). The slurry was spread uniformly on an aluminum foil current collector and dried under vacuum at 120 °C for about 12 h. Then 2016-type coin cells were assembled in an Ar-filled glove box using Li foil as the counter electrode. The electrolyte was 1 mol L−1 LiPF6 in a 1![[thin space (1/6-em)]](https://www.rsc.org/images/entities/char_2009.gif) :
:![[thin space (1/6-em)]](https://www.rsc.org/images/entities/char_2009.gif) 1 mixture of ethylene carbonate (EC)/dimethyl carbonate (DMC) and the separator was Celgard 2500. Galvanostatic charge–discharge cycling was performed between 2.0–4.8 V (vs. Li/Li+) using an automatic galvanostat (NEWARE) at different current rates at room temperature. Cyclic voltammetry (CV) measurements were carried out using a CHI 660D workstation.
1 mixture of ethylene carbonate (EC)/dimethyl carbonate (DMC) and the separator was Celgard 2500. Galvanostatic charge–discharge cycling was performed between 2.0–4.8 V (vs. Li/Li+) using an automatic galvanostat (NEWARE) at different current rates at room temperature. Cyclic voltammetry (CV) measurements were carried out using a CHI 660D workstation.
3. Results and discussion
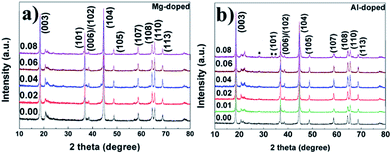
The XRD patterns of the lithium-rich layered oxide materials are shown in Fig. 1a and b. All of the diffraction peaks can be indexed based on a hexagonal α-NaFeO2 layered structure with a space group of R![[3 with combining macron]](https://www.rsc.org/images/entities/char_0033_0304.gif) m and a monoclinic system with space group C2/m.16,24,40 Clear splitting of the peaks corresponding to the (006)/(102) and (108)/(110) planes are the signature for the layered hexagonal type structure.40 The peak near 21° appears to be characteristic of the Li2MnO3 monoclinic structure, which results from the random stacking of the ordered layers.12 All the peaks are sharp and well defined, suggesting that the compounds are generally well crystallized. In addition, no other crystalline impurity is detected in the Mg-doped samples and the impurity peak appears between 25–35° in the 8 mol% Al-doped sample. The reason may be that the difference between the radius of Al and Ni is larger which results in the lower doping amount of Al. Furthermore, in order to identify the exact content of Mg and Al doping in the samples, the 4 mol% Mg-doped and 1 mol% Al-doped samples were investigated by inductively coupled plasma (ICP) measurements. The content of the Mg in the 4 mol% Mg-doped sample is 1.33% while the content of the Al in the 1 mol% Al-doped sample is 0.32%. This is in good agreement with the theoretical content of Mg/Al in the samples.
m and a monoclinic system with space group C2/m.16,24,40 Clear splitting of the peaks corresponding to the (006)/(102) and (108)/(110) planes are the signature for the layered hexagonal type structure.40 The peak near 21° appears to be characteristic of the Li2MnO3 monoclinic structure, which results from the random stacking of the ordered layers.12 All the peaks are sharp and well defined, suggesting that the compounds are generally well crystallized. In addition, no other crystalline impurity is detected in the Mg-doped samples and the impurity peak appears between 25–35° in the 8 mol% Al-doped sample. The reason may be that the difference between the radius of Al and Ni is larger which results in the lower doping amount of Al. Furthermore, in order to identify the exact content of Mg and Al doping in the samples, the 4 mol% Mg-doped and 1 mol% Al-doped samples were investigated by inductively coupled plasma (ICP) measurements. The content of the Mg in the 4 mol% Mg-doped sample is 1.33% while the content of the Al in the 1 mol% Al-doped sample is 0.32%. This is in good agreement with the theoretical content of Mg/Al in the samples.
SEM pictures of the prepared materials are shown in Fig. 2. The morphology of all the samples is microspherical and each microsphere is composed of smaller irregular sized particles, in which the average particle size is about 50–250 nm. It can also be analyzed from Fig. 2 that all the particles are well-crystallized, which is consistent with the XRD results. Meanwhile, the pristine and doped materials have a similar morphology which suggests that the Mg and Al elements are well permeated into the bare lithium-rich layered oxide materials and form a solid solution. In addition, it can also be concluded that doping the host material with Mg and Al does not influence the morphology of the samples.
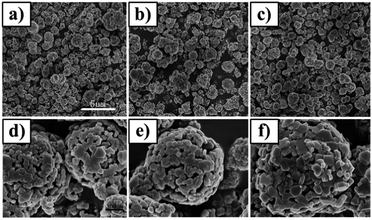 | ||
| Fig. 2 Scanning electron micrographs for (a and d) pristine, (b and e) 4 mol% Mg-doped and (c and f) 1 mol% Al-doped samples. | ||
To determine the oxidation states of Ni and Mn in the layered materials, XPS experiments were carried out for pristine, 4 mol% Mg-doped and 1 mol% Al-doped samples. The XPS spectra of Ni 2p3/2 and Mn 2p3/2 for the 4 mol% Mg-doped and 1 mol% Al-doped materials are given in Fig. 3. The electron binding energies of the three samples and a reference sample are listed in Table 1. In the pristine sample, the Ni 2p3/2 peak is at 854.9 eV and the Mn 2p3/2 peak is at 642.48 eV, which suggest that Ni and Mn ions are present as Ni2+ and Mn4+, respectively (Fig. SI1d and e†). In addition, the Ni 2p3/2 peak and Mn 2p3/2 peak in the 4 mol% Mg-doped sample is at 854.97 eV and 642.57 eV, while the Ni 2p3/2 peak and Mn 2p3/2 peak in the 1 mol% Al-doped material is at 854.7 eV and 642.2 eV. It can be concluded that the doping with Mg and Al ions in the lithium-rich layered oxide materials does not affect the oxidation states of the Ni and Mn ions in the samples.
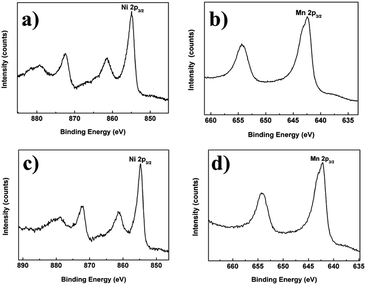 | ||
| Fig. 3 X-Ray photoelectron spectroscopy (XPS) spectra of: (a) Ni 2p3/2, (b) Mn 2p3/2 for the 4 mol% Mg-doped sample and (c) Ni 2p3/2, (d) Mn 2p3/2 for the 1 mol% Al-doped sample. | ||
| Element | Ni | Mn |
|---|---|---|
| Reference (eV) (ref. 41) | 3+: 855.8–857.6 | 4+: 641–642.5 |
| 2+: 853.5–854.4 | 3+: 641.2–641.7 | |
| 0.3Li2MnO3·0.7LiNi0.5Mn0.5O2 | 854.9 | 642.48 |
| 0.3Li2MnO3·0.7LiNi0.46Mn0.46Mg0.08O2 | 854.97 | 642.57 |
| 0.3Li2MnO3·0.7LiNi0.49Mn0.49Al0.02O2 | 854.7 | 642.2 |
To study the effect of the Mg and Al doping on cycling stability, doped and pristine 0.3Li2MnO3·0.7LiNi0.5Mn0.5O2 cells with Li anodes were tested with an aggressive test profile: cycling between 2.0 and 4.8 V at a current density of 100 mA g−1 and 25 °C after activation at a current density of 20 mA g−1 for 2 cycles. Fig. SI2† shows the first charge–discharge curves of the pristine and doped electrodes cycled between 2.0 and 4.8 V at a current density of 20 mA g−1. Similar to other lithium-rich layered oxide materials, the pristine and Mg/Al-doped 0.3Li2MnO3·0.7LiNi0.5Mn0.5O2 electrodes exhibit a voltage plateau around 4.5 V, which is related to the concomitant extraction of lithium and oxygen from the Li2MnO3 host structure during the initial charging.23,42–45 Above 4.5 V, all samples show a long plateau, and it is irreversible during following cycles. A recent study shows that the irreversible capacity of the plateau at about 4.5 V is related to the oxygen loss during the first charging.46 The pristine, 4 mol% Mg-doped and 1 mol% Al-doped electrodes initially deliver discharge capacities of 316 mA h g−1, 208 mA h g−1 and 249 mA h g−1, respectively, at a current density of 20 mA g−1. CV curves recorded for the pristine, 4 mol% Mg-doped and 1 mol% Al-doped cathode materials in the voltage range 2.0–4.8 V at a scanning rate of 0.1 mV s−1 are shown in Fig. SI3.† It can be seen from Fig. SI3† that there is an anodic peak at about 4.3 V which corresponds to the process of Li+ extraction from the LiNi0.5Mn0.5O2 component accompanying the oxidation of transition metals.47–49 This peak corresponds to the voltage slope at a voltage less than 4.5 V in Fig. SI2.† Another peak at about 4.6 V is due to the activation of Li2MnO3 corresponding to the plateau at about 4.5 V in Fig. SI2.† The peak at about 3.15 V corresponds to the Mn3+/Mn4+ redox couple.49,50 It is reported that the process at about 4.5 V may be associated with the occupation of the tetrahedral sites by lithium within the extensively delithiated layer and the lower voltage of about 3.15 V is the occupation of the octahedral sites.47,48
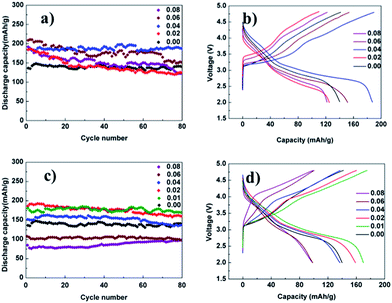
Fig. 4a shows plots of the discharge capacity as a function of the cycle number for different mol% Mg-doped electrodes. It can be seen from Fig. 4a that the 4 mol% and 6 mol% Mg-doped electrodes deliver a higher discharge capacity than the pristine electrode. The 4 mol% Mg-doped electrode delivers a discharge capacity of approximately 188 mA h g−1. Meanwhile the 6 mol% Mg-doped electrode delivers a discharge capacity of approximately 152 mA h g−1. It follows that the amount of 4 mol% for the Mg-doped lithium-rich layered oxide materials shows the best electrochemical performance which increases the discharge capacity by 34% compared with the pristine electrode. The 2 mol% and 8 mol% Mg-doped electrodes show a lower discharge capacity than the pristine electrode after 80 cycles. The reason for this may be that the Mg is not the active material, and more or less Mg doping may reduce the capacity of the battery. Fig. 4c shows plots of the discharge capacity as a function of the cycle number for different mol% Al-doped electrodes. Here, the 1 mol% Al-doped electrode delivers a discharge capacity of approximately 170 mA h g−1 in a cut-off range between 2.0 and 4.8 V. The 1 mol% Al-doped lithium-rich layered oxide material shows the best electrochemical performance which increases the discharge capacity by 21% compared with the pristine electrode. Fig. 4c also indicates that the discharge capacity of lithium-rich layered oxide materials decreases with an increase of the amount of Al doping. Similarly, Al is not the active material and an excessive amount of doping could reduce the capacity of the battery. In addition, the charge–discharge curves of the 0.3Li2MnO3·0.7LiNi0.5−xMn0.5−xMg2xO2 and 0.3Li2MnO3·0.7LiNi0.5−xMn0.5−xAl2xO2 cells at the 80th cycle between 2.0 and 4.8 V are shown in Fig. 4b and d. The 4 mol% Mg and 1 mol% Al doped electrodes delivered a higher discharge capacity of 188 mA h g−1 and 170 mA h g−1 respectively, as compared with the 140 mA h g−1 for the pristine electrode.
Fig. 5a shows the cycle performances of the pristine, 1 mol% Al-doped and 4 mol% Mg-doped lithium-rich materials. It can be clearly seen that the discharge capacity of the 4 mol% Mg-doped electrode is higher than the 1 mol% Al-doped material after 80 cycles. There is still much work to be done to find out the reason for this. In order to investigate the effect of Mg and Al doping on the rate capability, pristine, 4 mol% Mg-doped and 1 mol% Al-doped electrodes were cycled between 2.0 and 4.8 V at various current densities (Fig. 5b). The cycle life curves for the pristine and doped cathode materials were recorded at 0.1 C (20 mA g−1) for cycles 1–5, 0.5 C (100 mA g−1) for cycles 6–15, 1 C (200 mA g−1) for cycles 16–25, and 2 C (400 mA g−1) for cycles 26–35. It can be seen from Fig. 5b that both the 4 mol% Mg-doped and 1 mol% Al-doped electrodes exhibit a higher discharge capacity than the pristine electrode at each current density, especially at the large current density. Fig. SI4a–c† show the charge–discharge curves of pristine, 4 mol% Mg-doped and 1 mol% Al-doped cells, respectively, at various rates. At a discharge current density of 200 mA g−1, the 4 mol% Mg-doped and 1 mol% Al-doped electrodes display discharge capacities of 175 mA h g−1 and 165 mA h g−1 which increase by 59% and 50%, respectively, compared with the pristine electrode. At a current density of 400 mA g−1, the 4 mol% Mg-doped and 1 mol% Al-doped deliver discharge capacities of 135 mA h g−1 and 127 mA h g−1, respectively, while the pristine electrode delivered a discharge capacity of only 10 mA h g−1. The discharge capacity of the 4 mol% Mg-doped and 1 mol% Al-doped electrodes increase by 126% and 117%, respectively, compared with the pristine electrode at the high current density of 400 mA g−1.
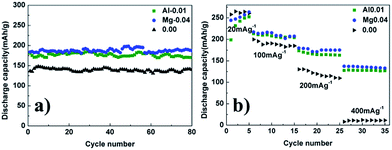 | ||
| Fig. 5 (a) The cycle performances of the pristine, 4 mol% Mg-doped and 1 mol% Al-doped electrodes. (b) The rate performances of the pristine, 4 mol% Mg-doped and 1 mol% Al-doped electrodes. | ||
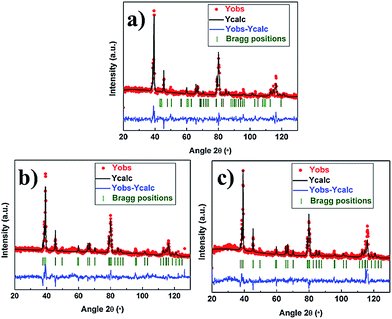
From the above results, we can speculate that the cycling performance and rate capability of the electrodes can be greatly improved by doping a small amount of Mg or Al. Furthermore, the performance improvement magnitude of Mg-doped lithium-rich materials is greater than the improvement magnitude of the Al-doped materials. In order to further clarify the relationship between the structure and electrochemical properties, we employed the Rietveld method to analyze the crystal structure. Fig. 6 shows the fitting patterns of the neutron diffraction of the pristine, 4 mol% Mg-doped and 1 mol% Al-doped samples. The red dots, black line, blue line, and green vertical tick marks represent the observed, calculated, difference pattern and Bragg peaks, respectively. The Rwp of the pristine, 4 mol% Mg-doped and 1 mol% Al-doped electrodes is 9.26%, 9.04% and 10.1%, respectively. We fixed the oxygen occupations and assumed that “cation mixing” (i.e. a partial interchange of the occupancy of Li and transition metal ions among the sites) happened. It has been reported that only Ni2+ is expected to exist in the lithium plane,51 so the refinements are carried out with the goal of getting a quantitative value of Li/Ni exchange between the metal and lithium slab, and of Li/Ni exchange in the metal slab. The refinement results are listed in Table 2.
| 0.3Li2MnO3·0.7LiNi0.5Mn0.5O2 | |||||
|---|---|---|---|---|---|
| Atom | Site | x | y | z | Occ |
| Li | 3b | 0 | 0 | 0.5 | 0.96750 |
| Ni | 3b | 0 | 0 | 0.5 | 0.03250 |
| Ni | 3a | 0 | 0 | 0 | 0.26750 |
| Li | 3a | 0 | 0 | 0 | 0.16250 |
| Mn | 3a | 0 | 0 | 0 | 0.57000 |
| O | 6c | 0 | 0 | 0.2566 | 1.0 |
| Rwp = 9.26% | |||||
| 0.3Li2MnO3·0.7LiNi0.46Mn0.46Mg0.08O2 | |||||
|---|---|---|---|---|---|
| Atom | Site | x | y | z | Occ |
| Li | 3b | 0 | 0 | 0.5 | 0.99870 |
| Ni | 3b | 0 | 0 | 0.5 | 0.00130 |
| Ni | 3a | 0 | 0 | 0 | 0.27870 |
| Li | 3a | 0 | 0 | 0 | 0.13130 |
| Mn | 3a | 0 | 0 | 0 | 0.54000 |
| Mg | 3a | 0 | 0 | 0 | 0.05000 |
| O | 6c | 0 | 0 | 0.25501 | 1.0 |
| Rwp = 9.04% | |||||
| 0.3Li2MnO3·0.7LiNi0.49Mn0.49Al0.02O2 | |||||
|---|---|---|---|---|---|
| Atom | Site | x | y | z | Occ |
| Li | 3b | 0 | 0 | 0.5 | 0.98990 |
| Ni | 3b | 0 | 0 | 0.5 | 0.01010 |
| Ni | 3a | 0 | 0 | 0 | 0.28816 |
| Li | 3a | 0 | 0 | 0 | 0.14010 |
| Mn | 3a | 0 | 0 | 0 | 0.55913 |
| Al | 3a | 0 | 0 | 0 | 0.01217 |
| O | 6c | 0 | 0 | 0.25705 | 1.0 |
| Rwp = 10.1% | |||||
As can be seen from the data in Table 2, the Li/Ni mixing occurs within the lithium-rich layered oxide materials and the doping of Mg and Al can effectively prevent lithium in the transition metal ions layer and restrain nickel in the lithium plane. Specifically, there are 3.25%, 0.13% and 1.01% Ni in the lithium interslabs for the pristine, 4 mol% Mg-doped and 1 mol% Al-doped samples, respectively. Compared with the pristine materials, the ratio of the Li/Ni mixing is reduced about 69% for the 1 mol% Al-doped sample and 96% for the 4 mol% Mg-doped material. It has been reported that the Li/Ni site exchange has a great effect on Li mobility.52 Li motion is so sensitive to the spacing between oxygen layers that this very small change (∼0.002 nm) results in a 20 to 30 meV increase in the activation barrier. Furthermore, Li/Ni disorder greatly limits the opening of the Li slab space upon delithiation (i.e. on charging the battery). The Li slab space expands during the early stages of delithiation as a result of the removal of O2+–Li+–O2+ bonds across the slab, leading to faster Li motion.52 So a lower ratio of the Li/Ni mixing can greatly improve the diffusivity of lithium ions in the electrodes, and thus enhance the electrochemical performance. The excellent cycle and rate capability of the Mg and Al doped electrodes can be ascribed to the reduced ratio of Li/Ni mixing. The 4 mol% Mg-doped electrode shows better electrochemical performance than the 1 mol% Al-doped electrode due to the ratio of the Li/Ni mixing of the 4 mol% Mg-doped sample being lower than that of the 1 mol% Al-doped material.
On the other hand, it has been reported that low-valent Mg2+ is more beneficial to Li diffusion than high-valent Al3+.52,53 The lithium-rich materials have a layered structure which consists of layers of transition-metal cations separated from Li layers by oxygen. In this structure, Li is coordinated octahedrally by oxygen but diffuses from site to site by hopping through intermediate tetrahedral sites. Li moves from one octahedral site to another by passing through an intermediate tetrahedral site where it encounters strong repulsion from a nearby transition-metal cation. The low-valent metal ions can reduce the electrostatic interaction between Li+ in the activated state and the transition-metal cations which can reduce the activation energy to increase the rate of Li migration.52 Compared with high-valent Al3+, low-valent Mg2+ is more beneficial to the stability of the structure and migration of the Li-ion in the electrode. Therefore, the electrochemical properties of the Mg-doped electrodes are superior to those of the Al-doped materials.
4. Conclusions
Lithium-rich layered oxide 0.3Li2MnO3·0.7LiNi0.5−xMn0.5−xM2xO2 (M = Mg or Al) compounds have been synthesized using a combination of co-precipitation (CP) and a solid-state reaction method. The charge–discharge capacity and rate capability of the lithium-rich materials are significantly improved by doping with Mg and Al. Specifically, the discharge capacity of the 4 mol% Mg-doped and 1 mol% Al-doped electrodes increased by 34% and 21% compared with the pristine electrode at a current density of 100 mA g−1 after 80 cycles. At the high charge–discharge current density of 400 mA g−1, the 4 mol% Mg-doped and 1 mol% Al-doped electrodes can deliverer discharge capacities of 135 mA h g−1 and 127 mA h g−1. The improved electrochemical performance is due to reduced Li/Ni mixing after doping the host materials with Mg and Al. The Li/Ni mixing of the Mg-doped sample is lower than the Al-doped sample, which results in the electrochemical performance of the Mg-doped electrode being better than the Al-doped electrode.Acknowledgements
This work was supported by the Beijing Nova Program (Z141103001814065), the National Science Foundation for Young Scholars of China (21201177), the State Key Project of Fundamental Research (2014CB931900 and 2012CB932504) and the Chinese Academy of Sciences (“Hundred Talents Project”). The authors thank the Institute of Nuclear Physics and Chemistry CAEP for providing the neutron beam time.Notes and references
- N. Ohta, K. Takada, L. Zhang, R. Ma, M. Osada and T. Sasaki, Adv. Mater., 2006, 18, 2226–2229 CrossRef CAS
.
- J. M. Tarascon and M. Armand, Nature, 2001, 414, 359–367 CrossRef CAS PubMed
.
- M. Armand and J. M. Tarascon, Nature, 2008, 451, 652–657 CrossRef CAS PubMed
.
- D. Liu, W. Zhu, J. Trottier, C. Gagnon, F. Barray, A. Guerfi, A. Mauger, H. Groult, C. M. Julien, J. B. Goodenough and K. Zaghi, RSC Adv., 2014, 4, 154–167 RSC
.
- J. L. Gomez-Camer, C. Villevieille and P. Novak, J. Mater. Chem. A, 2013, 1, 13011–13016 CAS
.
- P. Simon and Y. Gogotsi, Nat. Mater., 2008, 7, 845–854 CrossRef CAS PubMed
.
- M. S. Whittingham, Chem. Rev., 2004, 104, 4271–4301 CrossRef CAS
.
- A. K. Padhi, K. Nanjundaswamy and J. B. D. Goodenough, J. Electrochem. Soc., 1997, 144, 1188–1194 CrossRef CAS PubMed
.
- H. Huang, S. C. Yin, T. Kerr, N. Taylor and L. F. Nazar, Adv. Mater., 2002, 14, 1525–1528 CrossRef CAS
.
- Q. Qu, L. Fu, X. Zhan, D. Samuelis, J. Maier, L. Li, S. Tian, Z. Li and Y. Wu, Energy Environ. Sci., 2011, 4, 3985–3990 CAS
.
- J. C. Arrebola, A. Caballero, M. Cruz, L. Hernán, J. Morales and E. R. Castellón, Adv. Funct. Mater., 2006, 16, 1904–1912 CrossRef CAS
.
- C. S. Johnson, N. Li, C. Lefief, J. T. Vaughey and M. M. Thackeray, Chem. Mater., 2008, 20, 6095–6106 CrossRef CAS
.
- Z. Lu and J. R. Dahn, J. Electrochem. Soc., 2002, 149, A815–A822 CrossRef CAS PubMed
.
- H. Liu, C. Du, G. Yin, B. Song, P. Zuo, X. Cheng, Y. Maa and Y. Gao, J. Mater. Chem. A, 2014, 2, 15640–15646 CAS
.
- J. Yan, X. Liu and B. Li, RSC Adv., 2014, 4, 63268–63284 RSC
.
- Y.-K. Sun, S.-T. Myung, M.-H. Kim, J. Prakash and K. Amine, J. Am. Chem. Soc., 2005, 127, 13411–13418 CrossRef CAS PubMed
.
- C. S. Johnson, N. Li, C. Lefief and M. M. Thackeray, Electrochem. Commun., 2007, 9, 787–795 CrossRef CAS PubMed
.
- G. M. Koenig Jr, I. Belharouak, H. Deng, Y.-K. Sun and K. Amine, Chem. Mater., 2011, 23, 1954–1963 CrossRef
.
- X. Huang, M. Wang and R. Che, J. Mater. Chem. A, 2014, 2, 9656–9665 CAS
.
- M. M. Thackeray, C. S. Johnson, J. T. Vaughey, N. Li and S. A. Hackney, J. Mater. Chem., 2005, 15, 2257–2267 RSC
.
- W.-H. Ryu, D.-H. Kim, S.-H. Kang and H.-S. Kwon, RSC Adv., 2013, 3, 8527–8534 RSC
.
- S.-H. Kang, P. Kempgens, S. Greenbaum, A. Kropf, K. Amine and M. Thackeray, J. Mater. Chem., 2007, 17, 2069–2077 RSC
.
- M. M. Thackeray, S.-H. Kang, C. S. Johnson, J. T. Vaughey, R. Benedek and S. Hackney, J. Mater. Chem., 2007, 17, 3112–3125 RSC
.
- K. A. Jarvis, C.-C. Wang, A. Manthiram and P. J. Ferreira, J. Mater. Chem. A, 2014, 2, 1353–1362 CAS
.
- X. Zhang, M. Lengyel and R. L. Axelbaum, AIChE. J., 2014, 60, 443–450 CrossRef CAS
.
- Y. Jiang, Z. Yang, W. Luo, X. L. Hu and Y. H. Huang, Phys. Chem. Chem. Phys., 2013, 15, 2954–2960 RSC
.
- X. He, J. Wang, R. Kloepsch, S. Krueger, H. P. Jia, H. D. Liu, B. Vortmann and J. Li, Nano Res., 2014, 7, 110–118 CrossRef CAS PubMed
.
- S. J. Shi, Z. R. Lou, T. F. Xia, X. L. Wang, C. D. Gu and J. P. Tu, J. Power Sources, 2014, 257, 198–204 CrossRef CAS PubMed
.
- B. Song, H. Liu, Z. Liu, P. Xiao, M. O. Lai and L. Lu, Sci. Rep., 2013, 3, 3094–3105 Search PubMed
.
- B. Song, C. Zhou, Y. Chen, Z. Liu, M. O. Lai, J. Xue and L. Lu, RSC Adv., 2014, 4, 44244–44252 RSC
.
- I. T. Kim, J. C. Knight, H. Celio and A. Manthiram, J. Mater. Chem. A, 2014, 2, 8696–8704 CAS
.
- X. F. Zhang, I. Belharouak, L. Li, Y. Lei, J. W. Elam, A. M. Nie, X. Q. Chen, R. S. Yassar and R. L. Axelbaum, Adv. Energy Mater., 2013, 3, 1299–1307 CrossRef CAS
.
- J. J. Chen, Z. D. Li, H. F. Xiang, W. W. Wu, S. Cheng, L. J. Zhang, Q. S. Wang and Y. C. Wu, RSC Adv., 2015, 5, 3031–3038 RSC
.
- S. H. Kang, J. Kim, M. E. Stoll, D. Abraham, Y. K. Sun and K. Amine, J. Power Sources, 2002, 112, 41–48 CrossRef CAS
.
- L. F. Jiao, M. Zhang, H. T. Yuan, M. Zhao, H. Guo, W. Wang, X. Di Zhou and Y. M. Wang, J. Power Sources, 2007, 167, 178–184 CrossRef CAS PubMed
.
- Z. Tang, Z. Wang, X. Li and W. Peng, J. Power Sources, 2012, 204, 187–192 CrossRef CAS PubMed
.
- H. Yu and H. Zhou, J. Mater. Chem., 2012, 22, 15507–15510 RSC
.
- W. B. Luo and J. R. Dahn, J. Electrochem. Soc., 2011, 158, A428–A433 CrossRef CAS PubMed
.
- X. Jin, Q. Xu, H. Liu, X. Yuan and Y. Xia, Electrochim. Acta, 2014, 136, 19–26 CrossRef CAS PubMed
.
- G. Singh, R. Thomas, A. Kumar and R. Katiyar, J. Electrochem. Soc., 2012, 159, A410–A420 CrossRef CAS PubMed
.
- C. D. Wagner, Handbook of X-ray photoelectron spectroscopy: a reference book of standard data for use in X-ray photoelectron spectroscopy, Physical Electronics Division, Perkin-Elmer Corp., 1979 Search PubMed
.
- W. S. Yoon, S. Iannopollo, C. P. Grey, D. Carlier, J. Gorman, J. Reed and G. Ceder, Electrochem. Solid-State Lett., 2004, 7, A167–A171 CrossRef CAS PubMed
.
- J. S. Kim, C. S. Johnson, J. T. Vaughey, M. M. Thackeray and S. A. Hackney, Chem. Mater., 2004, 16, 1996–2006 CrossRef CAS
.
- A. R. Armstrong, M. Holzapfel, P. Novak, C. S. Johnson, S.-H. Kang, M. M. Thackeray and P. G. Bruce, J. Am. Chem. Soc., 2006, 128, 8694–8698 CrossRef CAS PubMed
.
- S. H. Kang, C. S. Johnson, J. T. Vaughey, K. Amine and M. M. Thackeray, J. Electrochem. Soc., 2006, 153, A1186–A1192 CrossRef CAS PubMed
.
- Y. J. Kang, J. H. Kim, S. W. Lee and Y. K. Sun, Electrochim. Acta, 2005, 50, 4784–4791 CrossRef CAS PubMed
.
- E. Han, Y. Li, L. Zhu and L. Zhao, Solid State Ionics, 2014, 255, 113–119 CrossRef CAS PubMed
.
- H. H. Li, N. Yabuuchi, Y. S. Meng, S. Kumar, J. Breger, C. P. Grey and Y. Shao-Horn, Chem. Mater., 2007, 19, 2551–2565 CrossRef CAS
.
- J. Shojan, C. V. Rao, L. Torres, G. Singh and R. S. Katiyar, Mater. Lett., 2013, 104, 57–60 CrossRef CAS PubMed
.
- S. J. Shi, J. P. Tu, Y. Y. Tang, X. Y. Liu, Y. Q. Zhang, X. L. Wang and C. D. Gu, Electrochim. Acta, 2013, 88, 671–679 CrossRef CAS PubMed
.
- Z. H. Lu, L. Y. Beaulieu, R. A. Donaberger, C. L. Thomas and J. R. Dahn, J. Electrochem. Soc., 2002, 149, A778–A791 CrossRef CAS PubMed
.
- K. S. Kang, Y. S. Meng, J. Breger, C. P. Grey and G. Ceder, Science, 2006, 311, 977–980 CrossRef CAS PubMed
.
- E. J. Wu, P. D. Tepesch and G. Ceder, Philos. Mag. B, 1998, 77, 1039–1047 CrossRef CAS
.
Footnote |
| † Electronic supplementary information (ESI) available: X-Ray photoelectron spectroscopy (XPS) spectra of pristine and Mg/Al doped materials; the first charge–discharge and rate curves of the pristine and Mg/Al doped materials; details of the electrochemical performance of the lithium-rich layered oxide materials. See DOI: 10.1039/c5ra02380g |
| This journal is © The Royal Society of Chemistry 2015 |

