Biodegradable polyethylene glycol-based ionic liquids for effective inhibition of shale hydration

Shaohua Gou*ab, Ting Yinb, Qiang Xiab and Qipeng Guo*c
aState Key Laboratory of Oil and Gas Reservoir Geology and Exploitation, Southwest Petroleum University, Chengdu, Sichuan 610500, China. E-mail: shaohuagou@swpu.edu.cn
bOil & Gas Field Applied Chemistry Key Laboratory of Sichuan Province, College of Chemistry and Chemical Engineering, Southwest Petroleum University, Chengdu, Sichuan 610500, China
cPolymers Research Group, Institute for Frontier Materials, Deakin University, Locked Bag 2000, Geelong, Victoria 3220, Australia. E-mail: qguo@deakin.edu.au

Received 5th February 2015 , Accepted 27th March 2015

First published on 27th March 2015


Abstract

A series of ionic liquids based on polyethylene glycol (PEG) with different molecular weights were prepared for inhibiting shale hydration and swelling. The antiswelling ratio was measured to investigate the effect of different PEG-based ionic liquids on bentonite volume expansion, and it has shown that the ionic liquid based PEG200, i.e. PEG with molecular weight of 200, exhibited superior inhibition. The structures of the PEG200-based ionic liquids were characterized by 1H NMR studies. The XRD results indicated that the PEG200-based ionic liquids intercalated into sodium montmorillonite (Na-MMT) reducing the water uptake by the clay. The formation of complexes of Na-MMT and PEG200-based ionic liquids was also verified by FTIR spectroscopy. Thermal degradation analysis suggested that the PEG200-based ionic liquids accessed the interlamellar spaces of Na-MMT and reduced the water content of the complexes obtained. Moreover, no breaks and collapse were observed on the shale samples after immersion in PEG200-based ionic liquid solutions. All the PEG200-based ionic liquids showed biodegradability and potential application in effective inhibition for clay hydration.

1. Introduction

With the exploitation of shale gas, the introduction of water can lead to swelling and hydration of smectite-rich clay minerals, which can reduce the cementation force and produce a swelling force in shale. Therefore, maintaining shale stability is one of the most vital aspects in exploitation of shale gas.1 As is known, the adsorption of commercially used polyethylene glycols (PEGs) and polypropylene glycols (PPGs) with different molecular weights on clay minerals plays a significant role in a successful drilling process.2 These polyglycols are relatively cheap and have low environmental toxicity to use, and they do not affect important fluid properties significantly, such as viscosity, rheology and fluid-loss control.3 The inhibition mechanisms could be probably attributed to their displacing the water molecules from the interlayer leading to an increase in entropy, and the restriction of hydratable cations interacting with interlayer water by binding them to the clay surface based on ion–dipole interactions between the cations of smectite and the polyglycols polar functional groups.4 However, as polyglycols are uncharged, the adsorption is limited5 and they do not replace the hydratable cations in the clay interlayer; the best inhibition emerges when polyglycols are combined with KCl which can affect the ecosystem and have adverse effect on the fluid properties,6 thus further reducing the levels of KCl is a significant challenge.

The modification to polyglycols for replacing or reducing KCl has been reported in last years, such as the hydrophobically modification to PEGs with acetic and dodecanoic acid for inhibition of clay hydration,7 the clay-swelling inhibitors polyetheramines containing primary amino groups attached to the end of polyether on ethylene oxide (EO), propylene oxide (PO), or mixed EO/PO segments,8–10 and the evaluation of the polyoxypropylene diamine modified with adipic acid, ethane diacid and succinic acid as clay-swelling inhibitor in water-based drilling fluid.11

Within the large family of polyglycols-functionalized product, the PEG-based ionic liquids (ILs) have attracted considerable attentions in the last decade and have demonstrated the attractive physicochemical properties, thermostability and polarity (e.g. hydrophilicity, hydrogen bonding capability) and applications in several exciting areas.12 Nogueira et al. reported the dye-sensitized solar cells of polymer gel electrolytes based on a PEO copolymer and an imidazolium-based IL.13 PEG1000-based dicationic acidic ionic liquid and toluene was reported by Luo et al. to prepare benzopyrans in up to 93% yields.14 He et al. prepared a series of polyethylene glycol-functionalized basic ILs for efficient CO2 conversion into organic carbonates under mild conditions.15 Furthermore the introduction of the PEG and carboxylic acids structural motifs leads to a great increase of ILs biodegradability in water.16 To the author's knowledge, there is little information available in literature about the PEG-based ILs as clay-swelling inhibitors considering their biodegradation property and hydrogen bonding capability.

In this work, we designed and synthesized a novel series of PEG-based ILs. The esterification of different molecular weights PEG with the cyclic anhydride (maleic anhydride and/or succinic anhydride) were conducted, and then the esterification products were synthesized with 1-methylimidazole and/or triethylamine, respectively. PEG-based ILs containing ether oxygen and carboxylate oxygen could adsorb on the clay minerals by hydrogen bonds, and the interaction between organic amine cation and the negative surface charge of clay can contribute significantly to the adsorption of PEG-based ILs on the clay surfaces. The experimental anti-swelling ratio and surface tension measurements have been carried out to evaluate the inhibition ability of PEG-based ILs for the clay-swelling. Moreover, X-ray diffraction, FTIR and TG analysis have been employed to further investigate the inhibition of these ILs. And, the shale soaked test was conducted to study the possible physical alterations of shale in these PEG-based ILs.

2. Experimental section

2.1. Material

Polyethylene glycol with different molecular weights (PEG200, PEG400, PEG800, PEG1000, PEG1500, PEG2000, and PEG6000), maleic anhydride, succinic anhydride, 1-methylimidazole, triethylamine, sodium-dodecyl sulfate (SDS), acetone, tetrahydrofuran, diethyl ether, and acetonitrile were all supplied by Chengdu Kelong Chemical Reagent Factory, Sichuan. These starting compounds were all analytically pure used as received without additional purification. Sodium montmorillonite (Na-MMT) and bentonite used in this study were provided by Xinjiang Xiazijie Bentonite Company, Xinjiang. These clays were drying at 40 °C to constant weight for use. The shale samples were mined from the Chang Ning, Sichuan, and the major component of the clay mineral is illite smectite mixed layer.

2.2. Synthesis of PEG-based ILs

The reactions of PEG200–6000 and maleic anhydride are based on the reported methods,17,18 which were carried out under reflux at certain temperature followed by washing the purification and the drying procedure. This structure of ILs comprising polyethercarboxylates as anions was based on the reports.19,20 The reaction products are abbreviated as PM200–6000. Similarly PS200–6000 were the products of PEG200–6000 and succinic anhydride. Then a total of 1 mol synthesized PM200–6000 were dissolved in dry acetone followed by the addition of 2 mol 1-methylimidazole stirred at 50 °C for 3 days.21 The acetone was evaporated using rotavapor, and the ILs PMI200–6000 were obtained. Similarly, PMT200–6000 were obtained by the reactions of PM200–6000 and triethylamine. PSI200–6000 were the products of PS200–6000 and 1-methylimidazole, and PST200–6000 modified ILs were obtained using PS200–6000 and triethylamine similarly as described above. The different molecular weights of polyethylene glycol were modified to PMI200–6000, PMT200–6000, PSI200–6000 and PST200–6000 having carboxyl groups and cations at both terminals. The synthesis route of PEG-based products is presented in detail in Scheme 1.
image file: c5ra02236c-s1.tif
Scheme 1 The synthesis routes of PEG-based ILs (PEG200, PEG400, PEG800, PEG1000, PEG1500, PEG2000, and PEG6000).

2.3. 1H nuclear magnetic resonance (1H NMR) spectroscopy

1H NMR spectra of PEG200-based ionic liquid were obtained by a Bruker AV III-400 NMR spectrometer (Bruker, Switzerland) in CDCl3.

2.4. Fourier transform infrared (FTIR) spectroscopy

FTIR were recorded with a WQ520 spectrophotometer (Beifen, China) using the KBr pellet technique at room temperature. The averaging 32 scans were taken for each sample in the optical range 400–4000 cm−1 with a resolution of 2 cm−1.

2.5. Antiswelling ratio test

10 mL deionized water containing with a different concentration of PEG-based ILs was treated by 0.5 g bentonite. After stirring for 2 h, the dispersion was separated by a TG-16 supercentrifuge (YuHua Company, China) under 1500 rpm for 15 min. Then the antiswelling ratio of bentonite was calculate according to the following equation.
 
image file: c5ra02236c-t1.tif(1)
where AS is the anti-swelling ratio, %; V2 are the volume of swollen bentonite in distilled water, mL; V0 are the volume of swollen bentonite in kerosene, mL; V1 are the volume of swollen bentonite in the sample solution, mL.

2.6. Na-MMT linear swelling test

4 g dried Na-MMT was pressed tightly together into a sample tube under 1.5 MPa for 10 min and fixed in the chamber of the NP-3 swelling apparatus (Haian Oil Scientific Instrument Co., Ltd., China). The height of original Na-MMT was measured. After the different solutions were added in, the swelling height was recorded by displacement sensor. The linear swelling ratio was calculated using following equation.
 
image file: c5ra02236c-t2.tif(2)
here VH is the linear swelling ratio; %; HO is the height of original Na-MMT, mm; and ΔH is the maximum swelling height of Na-MMT treated with different solutions, mm.

2.7. X-ray diffraction (XRD)

Samples were prepared by adding 0.5 g of Na-MMT to a 10 mL PEG-based ionic liquid solution of the different concentration. The Na-MMT/PEG-based ionic liquids suspensions were keep for 2 h. The part of the wet Na-MMT/PEG-based ionic liquids complexes was used for XRD measurements directly, and others was dried at 40 °C and grinded to powders for the measurements of XRD. The XRD analysis for small-angle was determined by XRD, X'pert PRO MPD diffractometer with a Cu Kα radiation target at 40 mA and 40 kV.

2.8. Biodegradation test

The biodegradability of the test ILs was evaluated using the closed bottle test (OECD 301 D).16,22–24 The ILs were added to the secondary effluent and then the mixture was dispensed into a series of biochemical oxygen demand (BOD) bottles and maintained in completely full. SDS was utilized as reference substance. The bottles containing just the inoculum were prepared for parallel test. The dissolved oxygen of each duplicate bottles was analysed immediately and the remaining bottles were incubated in the dark at 20 °C. Biodegradation is monitored by analysis of dissolved oxygen over 28 days. The following equation are used to calculate the biodegradation. The chemical oxygen demand was determined by the potassium bichromate reflux method.
 
image file: c5ra02236c-t3.tif(3)

2.9. Surface tension

Surface tension of PEG-based ILs solution was measured using TX500C SpinningDrop Interface tensiometer (CNG USA Co.) with 5000 rpm, at 30 °C.

2.10. Thermogravimetric (TG)

The Na-MMT/PEG-based ionic liquid suspensions were prepared by adding 0.5 g of Na-MMT to a 10 mL PEG-based ILs solution and shaken at room temperature for 12 h. And then, the suspensions were centrifuged at 1500 rpm for 15 min to settle the solids. The samples were dried at 40 °C and grinded to powders. All samples were prepared to obtain the weight loss measurements by TGA. TGA of the samples was conducted with STA449 F3 synchronous thermal analyser (Netzsch, Germany) at a ramp of 10 °C min−1 from room temperature to 700 °C in an air atmosphere.

2.11. Shale soaked test

The shale were immersed in water, KCl or PEG-based ionic liquids solutions at 80 °C for 24 h to simulate the wellbore conditions. The pictures of the samples were taken before and after to observe possible physical alterations.

3. Results and discussion

3.1. Antiswelling ratio

The anti-swelling ratio which is one of the most important factors for inhibition the volume expansion of clay was measured by contacting deionized water and 1–10 wt% solutions of PEG-based ILs for 2 h and the results are given in Fig. 1(a)–(c). From these figures, it is observed that with the increase in the PEG-based ILs amount from 1 to 3 wt%, the anti-swelling ratio of samples increases and thereafter remains increasing slightly. And when increasing the molecular weight of PEG from 200 to 6000, an obvious decrease in the anti-swelling ratio was observed in PMI and PMT. The optimal anti-swelling ratio of PMI200, PMT200, PSI200 and PST200 were summarized in the Fig. 1(d). The anti-swelling ratio of PM200, PS200 and PEG200 is also presented in for comparison. The results suggested that the attachment of carboxylic acids to PEG200 display better clay inhibition in comparison with PEG200. Moreover, in contrast to PEG200, these PEG200-based ILs can inhibit the swelling of clay significantly. Subsequently, the relevant performance of PMI200, PMT200, PMT200 and PST200 are primarily evaluated. 1H NMR spectra of PMI200, PMT200, PSI200 and PST200 were shown in Fig. S1 in ESI.
image file: c5ra02236c-f1.tif
Fig. 1 The anti-swelling ratio of (a) PMI ILs, (b) PMT ILs, (c) PST and PSI ILs, (d) PEG200, PM200, PS200 and PEG200-based ILs.

3.2. Na-MMT linear swelling ratio

Na-MMT linear swelling test was used to study the effect of PEG200-based ILs concentration on linear swelling ratio of Na-MMT. The results are displayed in Fig. 2. It can be seen from Fig. 2 that the linear swelling ratio of Na-MMT decreases with the increase of ILs concentration from 1 to 3 wt%. When ILs concentration is up to 3 wt%, the inhibition capacity remains relatively stable. 3 wt% PEG200-based ILs can decrease linear swelling ratio of Na-MMT from 86.5% in deionized water to less than 20.0%. This is consistent with the result of antiswelling ratio test obtained above.
image file: c5ra02236c-f2.tif
Fig. 2 The linear swelling ratio of Na-MMT in PEG200-based ILs with different concentrations.

3.3. Effect of PEG200-based ILs concentration on d-spacing of Na-MMT

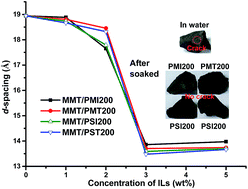
The d-spacings of wet samples of Na-MMT treated with different concentration of ILs are calculated according to Bragg's equation and shown in Fig. 3. The d-spacings of wet and dried Na-MMT treated with 3 wt% ILs are shown in Table 1. The ILs PMI200, PMT200, PSI200 and PMT200 increased the d-spacings of Na-MMT from 12.1066 to about 18 Å under the concentration of 1 and 2 wt%, which remained in the region of crystalline swelling of the Na-MMT. The intercalation of ILs at 3 wt% leads to a sudden decrease in d-spacing, and increasing the concentration to 5 wt% exerts no decrease and even small enhance on the d-spacing of Na-MMT. Also, in the series of PEG200-based ILs, when the organic cations changed from triethylamine to 1-methylimidazole, the silicate d-spacing expanded, and when the PEG skeleton with a double bond could lead to an increasing d-spacing. It is possibly owing to the size effect and the gauche conformations of ILs.25
image file: c5ra02236c-f3.tif
Fig. 3 Effect of PEG-based ILs concentration on d-spacings of Na-MMT.
Table 1 The d-spacings of different wet and dried samples
Samples C/wt% d-spacing/Å
Wet Drieda
a Samples were dried at 40 °C.
Na-MMT 0 12.1066 12.1066
Na-MMT/Water 0 18.9430 12.3387
Na-MMT/KCl 3 15.7103 11.8660
Na-MMT/PMI200 3 13.8574 13.7421
Na-MMT/PMT200 3 13.7040 13.2993
Na-MMT/PSI200 3 13.5912 13.3711
Na-MMT/PST200 3 13.4803 13.2283
Na-MMT/PEG200 3 19.7035 16.5878
Na-MMT/PM200 3 18.9088 16.4930
Na-MMT/PS200 3 18.8051 16.5232
Na-MMT/PEG200/3 wt% KCl 3 15.6534 14.0540
Na-MMT/PM200/3 wt% KCl 3 15.7031 13.3351
Na-MMT/PS200/3 wt% KCl 3 14.6789 13.1054


The d-spacing of untreated Na-MMT is 12.1066 Å, and the swollen Na-MMT displays the d-spacing of 18.9430 Å. The d-spacing of dried Na-MMT/KCl sample shows a little smaller than that of untreated Na-MMT, which may due to the smaller hydrated volume of potassium ion.26 In addition, it can be seen that the d-spacings of dried Na-MMT–ILs samples move toward lower diffraction angles compared with untreated Na-MMT, which is owing to the intercalation of the ILs into interlayer spaces of Na-MMT.25

To further investigate the mode of the ILs arrangement on the clay layer, the XRD results of wet and dried samples of Na-MMT treated with PEG200, PM200, PS200, and combining them with 3 wt% KCl are shown in Table 1. For dried samples untreated with KCl, their d-spacings were around 16.5 Å, which shows the intercalation of PM200 and PS200 with COOH groups27 and is characteristic of the formation of bilayer complexes. In KCl solutions, the d-spacings exhibit values of more than 13.2 Å, taking into account the PEO zigzag chains thickness of 3.8 Å (ref. 28) and the layer thickness of about 9.6 Å,29 this increase of the d-spacing may be correspond roughly to one layer of PEG200, PM200, and PS200 in the interlamellar spaces of the clay. These results suggest that they are reluctant to form a double layer in the presence of KCl, preferentially displaying one denser layer into the interlamellar spaces of the clay.7 The same trend was observed for the clay treated with ILs based on the cation, which may be attributed to the residence of only one PEG product layer in the basal spacings of the clay.

The Na-MMT was treated with water to full hydration and then respectively treated with 3 wt% ILs. The effect of the different ILs on the inhibition properties of hydrated Na-MMT is shown in Fig. 4. The results clearly show that the PEG200-based ILs reduce the water content of the clay/water complexes exhibiting the decreasing d-spacing from ca. 19 (hydrated Na-MMT) to ca. 13.5 Å. This effective inhibition to hydrated Na-MMT predicts that the ILs are able to intercalate into the layer spaces of the clay and expel the interlayer water to prevent swelling and disintegration of clay particles.


image file: c5ra02236c-f4.tif
Fig. 4 Effect of different ILs on the d-spacings of hydrated Na-MMT.

The Na-MMT was treated with 3 wt% ILs and washed by water several times, then the XRD test of the wet samples was conducted. The results were shown in Table 2. Subsequently, drying the wet samples and wetting them with water again, as well the XRD test was carried out and also shown in Table 2. The d-spacings of samples show almost no changes compared with that of dried samples. The results clearly indicate PEG200-based ILs intercalated Na-MMT are reluctant to form full hydration to expand the d-spacing. These ILs are able to penetrate into the interlayer spaces of the clay blocking and preventing the water uptake by the clay and the PEG200-based ILs within interlayer spaces are stable subject to water washing. It is possibly owing to the hydrogen bond, electrostatic interaction between PEG200-based ILs and clay.

Table 2 Effect of water washing on the d-spacings of wet and dried samples
Samples d-spacing/Å
Washing wet samples Washing dried samples
Na-MMT/PMI200 14.0143 13.5703
Na-MMT/PMT200 13.7421 13.4308
Na-MMT/PSI200 13.7040 13.4073
Na-MMT/PST200 13.6663 13.5372


3.4. Surface tension

The clay are unstable in water is due to their tendency to hydrate, leading to swelling and eventually to dispersion.30 Moreover, montmorillonite presents a large contact area.31 This involves the formation of hydrogen (H–O) bonds between water and the silica or alumina groups on the shale surface. Polyglycols inhibit the clay-swelling through interfering with the hydrogen-bonding between water and shale surfaces, and polyglycols can also form hydrogen bonds competing with the water for the silica and alumina sites. It is also suggested that the droplets or aggregates resulting from the separation of a surfactant-rich phase can seal the shale surface, thereby reducing water ingress into the shale and leading to a high wellbore stability.4 The interfacial tension of 3 wt% PEG200-based ionic liquid were tested. When the concentration was 3 wt%, the surface tension of PMI200, PMT200, PSI200 and PST200 were 37.1, 40.8, 30.5 and 27.9 mN m−1, respectively. Dow et al. reported that about 45.4 mN m−1 interfacial tension was obtained by 100 wt% PEG200.32 PEG200-based ILs contain hydrophobic segment such as methyl and imidazole ring, restricting swelling through the interactions between the hydrophobic part of the glycol and the clay surface; disrupting the hydrogen bonding network of water molecules in the interlayer; and the binding of the hydrophilic part, such as ether and carbonyl oxygen atom of PEG200-based ILs, to sodium cations and to the clay surface.

3.5. Biodegradation of PEG200-based ILs

In this section we discuss the biodegradation of these PEG200-based ILs. The concentration of PEG200-based ILs is 3 mg L−1 which were conducted as the sole source of carbon and nitrogen. Fig. 5 presented the higher biodegradation values (58–65%) of PEG200-based ILs. Chemicals which reach a biodegradation level higher than 60% are referred to as “readily biodegradable”. The anion type can affect the biodegradation properties of the ILs. In this study, introduction of the polyethercarboxylate anion improves the biodegradation properties of the imidazole-based ILs.
image file: c5ra02236c-f5.tif
Fig. 5 Biodegradation curves of PEG200-based ILs.

3.6. FTIR studies

In the recorded spectra of PEG200-based ILs (Fig. 6), the recorded peaks at 1720, 1722, 1732, and 1731 cm−1 are due to the ester C[double bond, length as m-dash]O stretching vibration. Peaks at 1583, 1582, 1576, and 1570 cm−1 was assigned for the stretching vibration of carboxylate of PMI200, PMT200, PSI200, and PST200, respectively.33 The vibration of methyl is observed at 2986, 2985, 2966, 2989 cm−1 in PMI200, PMT200, PSI200, and PST200, respectively. Two peaks at approximate 2938 and 2872 cm−1 are due to an alkyl C–H stretching vibration of –CH2– of PEG chains. A peak around 1467 cm−1 is assigned for the vibration of in plane scissoring of C–H in PEG segments, and the C–O–C stretching vibrations of the PEG skeleton were well observed at three bands at 1172, 1112, and 1033 cm−1.34
image file: c5ra02236c-f6.tif
Fig. 6 FTIR spectra of (a) PMI200, (b) PMT200, (c) PSI200, (d) PST200, (e) Na-MMT, (f) Na-MMT/PMI200, (g) Na-MMT/PMT200, (h) Na-MMT/PSI200 and (i) Na-MMT/PST200.

The FTIR spectrum of Na-MMT is shown in Fig. 5(e). The peak of Al–Al–OH stretching vibration presents at 3631 cm−1. The peak observed at 3410 cm−1 is attributed to H–O–H stretching. The peak at 1641 cm−1 is the H–O–H bending vibrations of water.35 It could be seen the peak at 1033 cm−1 is attributed to Si–O stretching frequency. In the FTIR spectrum of Na-MMT interacted with PEG200-based ILs, H–O–H bending vibration at 1641 cm−1 for Na-MMT was still appeared up suggesting that a small amount of combined water still present in the interlayer treated Na-MMT. The peak around 2986 cm−1 for ILs was observed in the complexes of Na-MMT–ILs. The peak of ester carbonyl in PEG200-based ILs (C[double bond, length as m-dash]O stretching vibration) was able to observed for the spectra of Na-MMT with PMI200 (at 1731 cm−1), PMT200 (at 1718 cm−1), PSI200 (at 1732 cm−1) and PST200 (at 1725 cm−1). Peaks at 1560, 1562, 1550, and 1556 cm−1 for the vibration of carboxylate in PMI200, PMT200, PSI200 and PST200 ILs appear, respectively. The displacements of vibration of in plane scissoring of C–H (1467 cm−1) in PEG segments occurred. These peak positions can confirm the interaction of these ILs in the interlayer of Na-MMT particles.

3.7. Thermal stability

TG patterns of dry untreated Na-MMT and Na-MMT treated with 3 wt% PEG200-based ILs in the temperature range of 40 to 700 °C are shown in Fig. 7. At TG curve of unmodified clay, the mass loss before 200 °C was corresponded to the decomposition of physically adsorbed water, hydrogen-bonded water and water molecules around metal Na+ exchangeable sites in Na-MMT,36 and there is no clear difference between free and interlayer water molecules.37 The temperature range of 200–600 °C the mass loss can be attributed to some of the dehydroxylation of clay minerals from tetrahedral sheets and above 600 °C the mass loss occurs because of the dehydroxylation of clay.38 It can be seen that PMI200, PMT200, PSI200, and PST200 ILs reduce the mass loss of the bound water content within the interlayer of untreated Na-MMT from 0.85 wt% to 0.64, 0.33, 0.32 and 0.43 wt%, respectively. The lower mass of bound water is a foregone conclusion of the improved inhibitive properties, thus, the interacted PMI200, PMT200, PST200 and PST200 Na-MMT show excellent inhibition for clay-swelling. In addition, an intersection point at about 300 °C at TG curves, it indicates that PEG adsorbed on Na-MMT are able to decrease the mass in the previous studies.39 Thus, it may possible to deduce this loss weight attributed to the thermal degradation of the PEG200-based ILs degradation.
image file: c5ra02236c-f7.tif
Fig. 7 TG patterns of Na-MMT/PEG200-based ILs samples.

3.8. Shale soaked analysis

The swelling of the clays could lead to the possible rock physical alterations and cause wellbore collapse. Fig. 8 shows the pictures of shale samples before and after 24 h at 80 °C of exposure to deionized water, KCl, and PEG200-based ILs solutions. In contrast to brine and ILs, we observed brittle failure after the soaked in water altering the samples physically, indicating the water serious adsorption by clay minerals. When exposed to 3 wt% KCl solution, some induced microfractures were observed on samples. Dehghanpour et al. reported that the clay-rich samples completely break after exposure to 2 wt% KCl solution after 3 days.40,41 The shale samples after soaked in PMI200, PMT200, PSI200, and PST200 show no obvious swell and break and reduces the degree of physical alteration of samples, which indicates the ILs can play an important role in swelling inhibition.
image file: c5ra02236c-f8.tif
Fig. 8 Pictures of shale samples before and after exposure to water, KCl, PMI200, PMT200, PSI200, and PST200 solutions.

3.9. Inhibition mechanism

The possible shale inhibition mechanism of PEG200-based ILs is due to the following factors. PEG200-based ILs are able to penetrate into and displace water molecules from the interlayer space of the clay. And, the monolayer arrangement of PEG200-based ILs into silicate layers are reluctant to fully hydrate and diminish the tendency to uptake of water preventing clay layers apart. Furthermore, the PEG200-based ILs chains can adsorb on the clay mineral surface which further prevent the water molecules from migrating to the clay surface.

4. Conclusions

A novel series of PEG-based ILs were prepared and their bentonite inhibition was investigated, in which PEG200-based ILs exhibit an excellent inhibition up to 83% anti-swelling ratio without the presence of KCl. The lower the molecular weight of PEG, the greater the clay-swelling inhibition of PEG-based ILs. 1H NMR and surface tension of PEG200-based ILs was studied. The results of XRD indicated PEG200-based ILs are able to penetrate into the interlamellar in the basal spacing of the clay even hydrated clay, however, the entrance was limited to only one layer in the presence of cations. And the interlayer spaces PEG200-based ILs are unable subject to water washing, blocking and preventing the water uptake by the clay. Moreover, FTIR further confirmed the intercalation of PEG200-based ILs, and TGA demonstrated PEG200-based ILs can minimize the water content in the interlayer of Na-MMT. PEG200-based ILs which all reach a biodegradation level are referred to as biodegradable. Moreover, no cracks and collapse were observed on the shale samples after the shale soaked in PEG200-based ILs solutions at 80 °C for 24 h. Therefore, all the results suggested that PEG200-based ILs exhibit potential application for inhibiting the clay dispersion and disintegration.

Acknowledgements

The authors gratefully acknowledge the Scientific Research Cultivate Project of Southwest Petroleum University (no. 2014PYZ011) and National Natural Science Foundation of China (no. U1262209) for financial support.

Notes and references

  1. R. L. Anderson, I. Ratcliffe, H. C. Greenwell, P. A. Williams, S. Cliffe and P. V. Coveney, Earth-Sci. Rev., 2010, 98, 201–216 CrossRef CAS PubMed.
  2. B. Bloys, N. Davis, B. Smolen, L. Bailey, O. Houwen, P. Reid, J. Sherwood, L. Fraser, M. Hodder and F. Montrouge, Oilfield Rev., 1994, 6, 33–43 Search PubMed.
  3. J. L. Suter, P. V. Coveney, R. L. Anderson, H. C. Greenwell and S. Cliffe, Energy Environ. Sci., 2011, 4, 4572–4586 CAS.
  4. L. Quintero, J. Dispersion Sci. Technol., 2002, 23, 393–404 CrossRef CAS.
  5. X. Zhao, K. Urano and S. Ogasawara, Colloid Polym. Sci., 1989, 267, 899–906 CAS.
  6. D. E. O'Brien and M. E. Chenevert, J. Pet. Technol., 1973, 25, 1089–1100 CrossRef PubMed.
  7. d. S. Carlos Eduardo Carvalhido, A. S. Lima and R. S. V. Nascimento, J. Appl. Polym. Sci., 2010, 117, 857–864 CrossRef.
  8. L. Wang, S. Liu, T. Wang and D. J. Sun, Colloids Surf., A, 2011, 381, 41–47 CrossRef CAS PubMed.
  9. H. Zhong, Z. Qiu, W. Huang and J. Cao, J. Pet. Sci. Eng., 2011, 78, 510–515 CrossRef CAS PubMed.
  10. B. Peng, P. Luo, W. Guo and Q. Yuan, J. Appl. Polym. Sci., 2013, 129, 1074–1079 CrossRef CAS.
  11. H. Zhong, Z. Qiu, W. Huang and J. Cao, Appl. Clay Sci., 2012, 67–68, 36–43 CrossRef CAS PubMed.
  12. S. Tang, G. A. Baker and H. Zhao, Chem. Soc. Rev., 2012, 41, 4030–4066 RSC.
  13. F. S. Freitas, J. N. d. Freitas, B. I. Ito, M.-A. D. Paoli and A. F. Nogueira, ACS Appl. Mater. Interfaces, 2009, 1, 2870–2877 CAS.
  14. H. Zhi, C. Lu, Q. Zhang and J. Luo, Chem. Commun., 2009, 2878–2880 RSC.
  15. Z. Yang, Y. Zhao, L. He, J. Gao and Z. Yin, Green Chem., 2012, 14, 519–527 RSC.
  16. D. Coleman and N. Gathergood, Chem. Soc. Rev., 2010, 39, 600–637 RSC.
  17. J. Li and W. J. Kao, Biomacromolecules, 2003, 4, 1055–1067 CrossRef CAS PubMed.
  18. H.-J. Liu, L.-H. Lin and K.-M. Chen, Colloids Surf., A, 2003, 215, 213–219 CrossRef CAS.
  19. W. Kunz, S. Thomaier, E. Maurer, O. Zech, M. Kellermeier and R. Klein, CN Pat., 200880014913.1, 2010.
  20. N. Cheng, P. Yu, T. Wang, X. Sheng, Y. Bi, Y. Gong and L. Yu, J. Phys. Chem. B, 2014, 118, 2758–2768 CrossRef CAS PubMed.
  21. H. L. Ricks-Laskoski and A. W. Snow, J. Am. Chem. Soc., 2006, 128, 12402–12403 CrossRef CAS PubMed.
  22. M. T. Garcia, N. Gathergood and P. J. Scammells, Green Chem., 2005, 7, 9–14 RSC.
  23. N. Gathergood, M. T. Garcia and P. J. Scammells, Green Chem., 2004, 6, 166–175 RSC.
  24. N. Gathergood, P. J. Scammells and M. T. Garcia, Green Chem., 2006, 8, 156–160 RSC.
  25. M. Huang, J. Wu, F. Shieu and J. Lin, J. Mol. Catal. A: Chem., 2010, 315, 69–75 CrossRef CAS PubMed.
  26. E. S. Boek, P. V. Coveney and N. T. Skipper, J. Am. Chem. Soc., 1995, 117, 12608–12617 CrossRef CAS.
  27. D. Sikdar, D. R. Katti and K. S. Katti, Langmuir, 2006, 22, 7738–7747 CrossRef CAS PubMed.
  28. J. Bujdák, E. Hackett and E. P. Giannelis, Chem. Mater., 2000, 12, 2168–2174 CrossRef.
  29. K. G. Fournaris, M. A. Karakassides, D. Petridis and K. Yiannakopoulou, Chem. Mater., 1999, 11, 2372–2381 CrossRef CAS.
  30. E. J. M. Hensen and B. Smit, J. Phys. Chem. B, 2002, 106, 12664–12667 CrossRef CAS.
  31. A. Cosultchi, I. Cordova, M. A. Valenzuela, D. R. Acosta, P. Bosch and V. H. Lara, Energy Fuels, 2005, 19, 1417–1424 CrossRef CAS.
  32. G. J. Dow and C. A. Santa Rosa, US Pat., 0092562 A1, 2011.
  33. J. A. Tamada and C. J. King, Ind. Eng. Chem. Res., 1990, 29, 1327–1333 CrossRef CAS.
  34. Y. J. Deng, J. B. Dixon and G. N. White, Colloid Polym. Sci., 2006, 284, 347–356 CAS.
  35. S. Tunç and O. Duman, Colloids Surf., A, 2008, 317, 93–99 CrossRef PubMed.
  36. Y. Xi, Z. Ding, H. He and R. L. Frost, J. Colloid Interface Sci., 2004, 277, 116–120 CrossRef CAS PubMed.
  37. A. Cosultchi, G. Odriozola, A. Moctezuma and V. H. Lara, Energy Fuels, 2012, 26, 2578–2584 CrossRef CAS.
  38. H. He, J. Duchet, J. Galy and J.-F. Gerard, J. Colloid Interface Sci., 2005, 288, 171–176 CrossRef CAS PubMed.
  39. X. Zhang, W. T. Wang, Y. Zhang, M. Zhang, H. Zhang, M. Lei and Y. Zhao, J. Supercond. Novel Magn., 2013, 26, 147–150 CrossRef CAS PubMed.
  40. H. Dehghanpour, H. A. Zubair, A. Chhabra and A. Ullah, Energy Fuels, 2012, 26, 5750–5758 CrossRef CAS.
  41. H. Dehghanpour, Q. Lan, Y. Saeed, H. Fei and Z. Qi, Energy Fuels, 2013, 27, 3039–3049 CrossRef CAS.

Footnote

Electronic supplementary information (ESI) available: 1H NMR of PMI200, PMT200, PMT200 and PST200. See DOI: 10.1039/c5ra02236c

This journal is © The Royal Society of Chemistry 2015
Click here to see how this site uses Cookies. View our privacy policy here.