One-step synthesis of carboxyl-functionalized rare-earth fluoride nanoparticles for cell imaging and drug delivery

Zhiyang Zhanga, Xiaoyan Maa, Zhirong Geng*a, Kuaibing Wangab and Zhilin Wang*a
aState Key Laboratory of Coordination Chemistry, School of Chemistry and Chemical Engineering, Collaborative Innovation Center of Advanced Microstructures, Nanjing University, Nanjing 210093, P. R. China. E-mail: wangzl@nju.edu.cn; gengzr@nju.edu.cn; Fax: +86-25-83317761; Tel: +86-25-83686082
bSchool of Science, Nanjing Agricultural University, Nanjing 210095, P. R. China

Received 4th February 2015 , Accepted 3rd April 2015

First published on 8th April 2015


Abstract

Rare-earth doped UCNPs with a carboxyl coating on the surface have been widely used in many fields of biology, however, the modification of nanoparticles with a carboxyl polymer group is relatively complicated, and thus, fabricating carboxyl polymer-coated UCNPs using a simple method is significant. Herein, we synthesized carboxyl polymer-coated NaYF4:Yb3+/Tm3+ nanoparticles through a hydrothermal route during which methacrylic acid polymerized and bound to the surface of the nanoparticles. Dependence of structure and morphology on the dosage of NaOH was investigated. The polymerization degree of poly(methacrylic acid) and the amount of capping carboxyl group influenced by the dosage of NaOH were also studied. Other carboxyl-functionalized rare-earth fluorides could be obtained by using this method, the mechanism for which was also investigated. Thus, this method was universal for the carboxyl capping of rare-earth doped fluoride nano-materials, and also provided a new approach for carboxylic functionalization of nanoparticles. cis-Dichlorodiammineplatinum(II) (cisplatin, CDDP)-loaded NaYF4:Yb3+/Tm3+ nanoparticles (NaYF4–CDDP) were characterized by transmission electron microscopy, energy-dispersive X-ray spectroscopy and X-ray photoelectron spectroscopy, and CDDP was loaded in the form of Pt–O bonds. Upconversion luminescence images revealed the time course of intracellular CDDP delivery by NaYF4–CDDP. Compared with CDDP alone, the NaYF4–CDDP composite exerted cytotoxic effects on HeLa and MCF-7 cancer cell lines depending more on time and more slowly due to time-dependent cellular uptake and drug release. Non-loaded NaYF4:Yb3+/Tm3+ nanoparticles were also eligible for upconversion luminescence cell imaging. Therefore, the as-prepared NaYF4:Yb3+/Tm3+ nanoparticles allow simultaneous cell imaging and drug delivery as promising anti-cancer theranostic agents.
Introduction

Rare-earth doped nanoparticles have been widely studied due to their unique luminescence properties originating from f–f electronic transitions among the 4f electrons of rare-earth ions. Downconversion and upconversion luminescence can be observed when different rare-earth ions are doped.1–4 Rare-earth doped nanoparticles have many advantages. The luminescence property of rare-earth doped nanoparticles is not so dependent on the particle sizes as other luminescence nanomaterials such as Au, Ag and carbon.5–7 And compared with conventional luminescent probes such as organic fluorescent dyes and quantum dots,8–10 rare-earth doped nanophosphors exhibit higher photostability, chemical stability and lower biotoxicity.11 Especially, the upconversion process, which converts near-infrared radiation to UV or visible luminescence through multi-photon absorption,11,12 is advantageous in weak auto-fluorescence background, light-penetration depth in tissues and minimum photodamage to living organisms,13–15 thus in favor of biological uses. Though multi-photon absorption process can occur in some Au and Ag nanoparticles, the pulse laser for excitation is more costly compared to continuous wave laser used for excitation of rare-earth doped upconversion nanoparticles (UCNPs).16,17 Besides, some Ag and carbon containing nanomaterials express some biotoxicity.18–21 Thus, UCNPs with superior luminescent property and biocompatibility are widely used in the field of biology.

Carboxyl group is usually introduced onto the surface of UCNPs to improve their aqueous solubility and bind other molecular for multifunctional bioapplications both in vitro and in vivo, such as bioprobe, bioimaging and drug delivery, etc.22–26 Carboxyl polymers not only produce abundant carboxyl, compared to small carboxyl molecular, they can also provide hydrophily and protect luminescence core from nonradiative relaxation of water more effectively.27 Thus carboxyl polymers become common method for carboxyl supplying, and many methods such as direct synthesis and surface functionalization have been developed to cap nanoparticles with carboxyl polymer group. Carboxyl polymers, such as sodium polyacrylate and polyacrylic acid, have been used to cap UCNPs through a one-step solvothermal route, but the reaction temperature requirement is relatively high.28–31 For hydrophobic UCNPs, generally, there are three strategies to provide a carboxyl polymer-functionalized surface,4,32 such as ligand exchange,27,33 ligand attraction34,35 and in situ surface polymerization.36,37 These methods have been proved feasible, but the process for surface functionalization is usually more than two steps which is laborious.32 Therefore, it is of great significance to develop a simple and flexible approach to prepare UCNPs coated with carboxyl polymer ligands. Inspired by the in situ polymerization method, herein we developed a facile strategy that prepared carboxyl polymer coated NaYF4:Yb3+/Tm3+ nanoparticles in one step. In the synthesis process, UCNPs crystallized and carboxyl polymer formed through polymerization of methacrylic acid (MAA) simultaneously, not only avoiding the complicated modification process, also reducing the reaction temperature. To the best of our knowledge, this method for preparation of carboxyl group functionalized nanoparticles has not been reported hitherto.

In this study, carboxyl polymer-coated NaYF4:Yb3+/Tm3+ nanoparticles were prepared base on a hydrothermal route during which MAA polymerized and bound to the surface of NaYF4:Yb3+/Tm3+ nanoparticles. Polymerization degree of poly(methacrylic acid) (PMAA), amount of carboxyl and crystal phase of NaYF4:Yb3+/Tm3+ nanoparticles were adjusted by changing the dosage of NaOH. Furthermore, a series of carboxyl polymer-functionalized rare-earth fluorides could be obtained by using this method, and the formation process was investigated by changing the hydrothermal time. Accordingly, this method was universal for the carboxyl capping of rare-earth doped fluorides nano-materials. In order to evaluate the bioapplication of as prepared NaYF4:Yb3+/Tm3+ nanoparticles, CDDP was tethered onto their surface (NaYF4–CDDP) through carboxyl group to establish a drug delivery system. Cellular uptake process was monitored by detecting the upconversion luminescence of NaYF4:Yb3+/Tm3+ nanoparticles. MTT assay showed that the as-prepared NaYF4–CDDP composite was cytotoxic, thus confirming that the as-established drug delivery system was effective. Being luminescent, biocompatible and hydrophilic, the NaYF4:Yb3+/Tm3+ nanoparticles were particularly suitable for cell imaging.

Experimental

Materials

Y(NO3)3·6H2O, Yb(NO3)3·6H2O, Tm(NO3)3·6H2O, La(NO3)3·6H2O, Ce(NO3)3·6H2O, Eu(NO3)3·6H2O, Gd(NO3)3·6H2O, Td(NO3)3·6H2O and Er(NO3)3·6H2O were purchased from Shanghai Diyang Chemical Co., Ltd. NaF and MAA were purchased from Nanjing Chemical Reagent Co., Ltd. Polymerization inhibitor in MAA was removed by distillation before use. CDDP was obtained from Shandong Boyuan Chemical Co., Ltd. Other chemical reagents were analytical grade and used as received without further purification.

Preparation of rare-earth fluorides nanoparticles

NaYF4:Yb3+/Tm3+ nanoparticles were prepared by the following procedure. A certain amount of NaOH was dissolved by 5 mL of distilled water and 8 mL of absolute ethanol, into which were then added 2 mL of MAA and 1.2 mL of 0.5 M Ln(NO3)3 (Ln = 81.5% Y + 18% Yb + 0.5% Tm) aqueous solution. After stirring for 5 min, 4 mL of NaF aqueous solution (1 M) was added. After stirring for several minutes, the mixture was transferred into a 50 mL Teflon-lined stainless steel autoclave and heated at 120 °C for 8 h. After the autoclave was cooled to room temperature, white powders were collected by centrifugation, washed with distilled water three times and kept in distilled water. Other rare-earth doped fluorides were prepared when the amount of NaOH was 240 mg and the other reaction conditions were kept unchanged.

CDDP loading on NaYF4:Yb3+/Tm3+ nanoparticles

NaYF4–CDDP composite was obtained by mixing 30 mg CDDP with 100 mg NaYF4:Yb3+/Tm3+ nanoparticles in 20 mL of distilled water under stirring at room temperature in dark for 24 h. The as-prepared NaYF4–CDDP composite was centrifuged and washed with distilled water several times to remove the redundant CDDP. All the supernatants were collected and diluted in a volumetric flask. CDDP concentration in the supernatant was detected by atomic adsorption spectrum, and minusing was used to get the drug loading content.

In vitro CDDP release

The releases of CDDP from NaYF4–CDDP composite in phosphate-buffered saline (PBS) (pH = 7.4) and HAc–NaAc buffer (pH = 5.5) at 37 °C were evaluated by the dialysis method as reported.38 NaYF4–CDDP composite (20 mg) was dispersed in PBS (pH = 7.4, 5 mL) and HAc–NaAc buffer (pH = 5.5, 5 mL), and then the suspension was transferred into a dialysis bag (3000 Da) and dialyzed in PBS (pH = 7.4, 200 mL) and HAc–NaAc buffer (pH = 5.5, 200 mL) at 37 °C respectively. CDDP in the external solution was sampled at defined time and measured by using inductively coupled plasma mass spectrometry (ICP-MS).

In vitro cytotoxicity assay

The cytotoxicities of NaYF4–CDDP, NaYF4:Yb3+/Tm3+ nanoparticles and CDDP were measured by the 3-(4,5-dimethylthiazol-2-yl)-2,5-diphenyltetrazolium bromide (MTT) assay against human cervical cancer cell line (HeLa cells) and human breast adenocarcinoma cell line (MCF-7 cells). HeLa cells and MCF-7 cells were seeded in 96-well plates at 3000 cells per well in Dulbecco's modified Eagle's medium and incubated at 37 °C with 5% CO2 for 12 h. Then the cells were treated with fresh medium containing gradient concentrations (in terms of CDDP) of NaYF4–CDDP, NaYF4:Yb3+/Tm3+ nanoparticles and CDDP, respectively. The cells were subsequently incubated for 24 or 48 h. Thereafter, 20 μL of MTT (final concentration: 5 mg mL−1) was added to these wells, and the mixture was incubated for another 4 h. After the culture medium was replaced with 150 mL of dimethyl sulfoxide, the absorbance of MTT formazan was monitored at 570 nm using an automatic enzyme-linked immunosorbent assay plate reader. Cytotoxicity was expressed as the percentage of cell viability, and the cell viability was calculated based on the data of four replicate tests. The viability is expressed as mean ± S.D.

Cellular uptake and cell imaging

Glass coverslip (18 mm × 18 mm) was placed in each well of a 6-well plate. HeLa cells were planted on these glass coverslips in 6-well plate at 2.0 × 10⁵ cells per well overnight for attachment. Then the cells were washed with PBS twice, and incubated in 1 mL of culture medium containing 400 μg NaYF4–CDDP or NaYF4:Yb3+/Tm3+ nanoparticles for definite time at 37 °C in 5% CO2. After the glass coverslips were washed with PBS carefully three times, the cells were fixed using 4% paraformaldehyde solution. After being rinsed with PBS three times, the glass coverslips were transferred onto glass slides with glycerol on them. Upconversion luminescence imaging was performed using a modified Zeiss optical microscope, with a CW NIR laser at λex = 980 nm as an additional excitation source.

Characterization

X-ray powder diffractions (XRD) of the as-prepared products were measured by a Bruker D8 Advance instrument with Cu Kα radiation (λ = 0.15406 nm) at a scanning rate of 0.2° s−1 with 2θ range from 10 to 80°. Transmission electron microscopy (TEM) images were obtained using JEM-1011 instrument microscope at an acceleration voltage of 100 kV. Infrared (IR) spectroscopy was carried out by using Bruker IR vector22 infrared spectrometer in the wavenumber range from 4000 to 400 cm−1. Degree of polymerization was detected on LCQ Fleet electrospray ionization mass spectrometer (ESI-MS) with negative ion mode. Thermogravimetric analysis (TGA) was analyzed using Pyris 1 thermo-analytical instrument under nitrogen flow (20 mL min−1) at a heating rate of 10 K min−1. X-ray photoelectron spectroscopy (XPS) was conducted on Thermo Scientific K-Alpha equipment, and the binding energy was referred to as the C1s photoelectron peak. Concentration of Pt was measured by ICP-MS using a standard Plasma-Quad II instrument, and each sample was repeated three times. Upconversion luminescent spectra were captured in the wave range of 300 to 550 nm on a Zolix luminescence spectrometer equipped with a 980 nm laser device at the power of 1 W. Upconversion luminescence images were acquired on the Zeiss primo star optical microscope, with a CW NIR laser at λex = 980 nm as an additional excitation source, and with a Samsung pad as an image acquisition device.

Results and discussion

XRD was used to investigate the crystal structure of the as-prepared nanoparticles. The product was pure cubic phase NaYF4 (JCPDS no. 77-2042) when no NaOH was added to the reaction system (Fig. 1a). Then diffraction peaks (Fig. 1b) indexed to hexagonal phase NaYF4 (JCPDS no. 16-0334) appeared in the presence of 240 mg NaOH, which increased with rising amount of NaOH (Fig. 1c–e). Since a slow crystallization process might be preferable for achieving hexagonal phase NaYF4,28,39 raising the dosage of NaOH increased the amount of OH which decreased the effective concentration of Y3+ cations after binding them, and further reduced the crystallization velocity of NaYF4. Therefore, hexagonal phase NaYF4 increased when more NaOH was used.
image file: c5ra02217g-f1.tif
Fig. 1 XRD patterns of NaYF4:Yb3+/Tm3+ nanoparticles prepared at 120 °C for 8 h with different amounts of NaOH (a) 0 mg, (b) 240 mg, (c) 480 mg, (d) 720 mg and (e) 960 mg.

Morphologies of the as-prepared nanoparticles were also influenced by the amount of NaOH. Fig. 2 shows the TEM images of corresponding products. The as-obtained products were branched (Fig. 2a) when no NaOH was used. When the dosage of NaOH was raised to 240 mg, the as-prepared products were nanoparticles with an average diameter lower than 100 nm (73 ± 35.4 nm). Afterwards, large nanoparticles (Fig. 2c–e) appeared with increasing amount of NaOH. Notably, some small nanoparticles were hollow (Fig. 2d and e), which may be attributed to Ostwald ripening.1,40


image file: c5ra02217g-f2.tif
Fig. 2 TEM images of NaYF4:Yb3+/Tm3+ nanoparticles prepared with different amounts of NaOH (a) 0 mg, (b) 240 mg, (c) 480 mg, (d) 720 mg and (e) 960 mg.

IR spectrum was introduced to identify the capping ligands on the surface of these as-prepared nanoparticles (Fig. 3). As shown in Fig. 3a–c, the peaks at 1556 and 1484 cm−1 correspond to the asymmetric and symmetric stretching vibrations of bound carboxyl groups respectively, suggesting the binding of carboxyl on the surface of these NaYF4:Yb3+/Tm3+ nanoparticles.28 The peaks at 2996 and 2933 cm−1 represent the asymmetric and symmetric stretching vibrations of C–H bond respectively. The strong band at 1714 cm−1 can be assigned to the C[double bond, length as m-dash]O asymmetric vibration of free carboxyl groups that improve the hydrophilicity of as-prepared NaYF4:Yb3+/Tm3+ nanoparticles.28


image file: c5ra02217g-f3.tif
Fig. 3 IR spectra of NaYF4:Yb3+/Tm3+ nanoparticles prepared with different amounts of NaOH (a) 0 mg, (b) 240 mg, (c) 480 mg, (d) 720 mg and (e) 960 mg.

Since the carboxyl of MAA can bind rare-earth ion on the surface of NaYF4:Yb3+/Tm3+ nanoparticles, free carboxyl groups detected by IR spectra suggest the polymerization of MAA during hydrothermal process. Solute in the supernatant of hydrothermal reaction was detected by ESI-MS (Fig. S1). MAA monomers polymerized during hydrothermal process, as compared with ESI-MS of the raw material (Fig. S2). The degree of polymerization in the supernatant decreased when more NaOH was used, indicating that polymerization was favored under acidic conditions (Fig. S1a and b). Control experiments with or without rare-earth ions demonstrated that rare-earth ions scarcely influenced the degree of polymerization (Fig. S3). Thus, pH value was the key factor that influenced the polymerization degree of PMAA. Electrostatic effects varied due to the ionization degree of MAA which was elevated by adding NaOH, thereby strengthening the electrostatic repulsion between MAA monomer and the polymer chain and reducing the rate of polymerization.41 As a result, the degree of polymerization was low at high pH value. Fig. 3d and e show that few ligands are capped on the surface of as-obtained products, although MAA polymerized with 720 and 960 mg NaOH (Fig. S1d and e). When excessive NaOH was used during synthesis, abundant OH anions bound rare-earth cations instead of PMAA due to the low solubility constant of yttrium hydroxide (8 × 10⁻²³), thus sharply decreasing the amount of capping polymers. As no ligands were coated onto the surface of as-prepared NaYF4:Yb3+/Tm3+ nanoparticles, the grains grew in order to reduce the surface energy (Fig. 2d and e).

TGA was introduced to analyze the amount of capped ligands on the surface of as-obtained NaYF4:Yb3+/Tm3+ nanoparticles. The weight loss of NaYF4:Yb3+/Tm3+ nanoparticles was over 10% (Fig. 4a) and was less than 1% (Fig. 4e) without and with 960 mg NaOH respectively. The weight loss increased with decreasing NaOH amount. On one hand, the degree of polymerization was high in acidic condition; on the other hand, fewer OH anions were conducive to ligand bonding on the surface of these materials as mentioned above.


image file: c5ra02217g-f4.tif
Fig. 4 TGA curves of NaYF4:Yb3+/Tm3+ nanoparticles prepared with different amounts of NaOH (a) 0 mg, (b) 240 mg, (c) 480 mg, (d) 720 mg and (e) 960 mg.

Other rare-earth doped fluorides were prepared when the amount of NaOH was 240 mg and the other reaction conditions were kept unchanged. As shown in Fig. 5, XRD patterns indicate that heavier rare-earth ions, such as Er3+, Tm3+, Yb3+, tend to form cubic NaErF4 (JCPDS no. 77-2041), NaTmF4,42 NaYbF4 (JCPDS no. 77-2043) respectively, accompanied by slight hexagonal phase. Meanwhile, the cubic phase products increased with decreasing rare-earth ions radius. For rare-earth ions like Eu3+, Gd3+ and Tb3+, due to the increased dipole polarizability, the electron clouds of rare-earth ions tended to distort, and were thus prone to forming hexagonal NaLnF4 (NaEuF4 JCPDS no. 28-1085, NaGdF4 JCPDS no. 27-0699, NaTbF4 JCPDS no. 27-0809, Fig. 5c–e).43 LnF3 with hexagonal phase structures formed when the doped ions were lighter rare-earth ions such as La3+ and Ce3+ (LaF3 JCPDS no. 32-0483, CeF3 JCPDS no. 08-0045), because Na+ cations hardly settled into the lattice of LnF3 owing to the large radii of rare-earth ions.44,45 ESI-MS of the solute in supernatant (Fig. S4) reveals the polymerization of MAA. IR spectra (Fig. S5) confirm these products were capped by carboxyl group. As other rare-earth compound such as hydroxides and phosphates, morphologies of as-prepared rare-earth fluoride nanoparticles were also influenced by the ionic radii.46 Fig. 6 shows the morphologies of the as-prepared products. LaF3 and CeF3 are hexagonal sheets, as shown in Fig. 6a and b. The products of NaLnF4 were branched when the rare-earth ions were Eu3+, Gd3+ and Tb3+ (Fig. 6c–e). Fig. 6f–h show the TEM images of NaErF4, NaTmF4 and NaYbF4, exhibiting nanospheres all with small sizes.


image file: c5ra02217g-f5.tif
Fig. 5 XRD patterns of products prepared in the presence of 240 mg NaOH (a) LaF3, (b) CeF3, (c) NaEuF4, (d) NaGdF4, (e) NaTbF4, (f) NaErF4, (g) NaTmF4, (h) NaYbF4.

image file: c5ra02217g-f6.tif
Fig. 6 TEM images of products prepared in the presence of 240 mg NaOH (a) LaF3, (b) CeF3, (c) NaEuF4, (d) NaGdF4, (e) NaTbF4, (f) NaErF4, (g) NaTmF4, (h) NaYbF4.

According to the structure and morphology, these products are divided into three classes, hexagonal phase LnF3 (Ln = La3+ and Ce3+), hexagonal phase NaLnF4 (Ln = Eu3+, Gd3+, Tb3+) and cubic phase NaLnF4 (Ln = Er3+, Tm3+, Yb3+, Y3+). LaF3, NaGdF4 and NaYF4 were chosen to investigate the formation mechanism of these nano-materials. Hexagonal phase LaF3 was obtained when the solvothermal time was 0 h, and the crystallinity degree increased as the reaction proceeded (Fig. 7a). Hexagonal phase NaGdF4 formed at first and remained structurally unchanged with prolonged reaction time (Fig. 7b). As shown in Fig. 7c, pure cubic phase NaYF4 was obtained when the solvothermal time was 0 h, which, however, began to transform to hexagonal phase at 4 h due to thermodynamic stability of the latter.47,48


image file: c5ra02217g-f7.tif
Fig. 7 XRD patterns of products prepared in the presence of 240 mg NaOH for different times (a) LaF3, (b) NaGdF4, (c) NaYF4.

TEM images show the morphology alteration of as-obtained products. Fig. 8a reveals that LaF3 nanosheets appeared before solvothermal treatment, and these nanosheets grew to hexagonal sheets as the reaction time increased. As reported, the adsorption effect of ligands on different surface could lead to facets growing with different velocity.1 In the case of LaF3, PMAA might cap onto the upper and lower surface of nanosheets, and consequently reduced the energy and growing rate of these surfaces, prohibiting the thickness increase of LaF3 nanosheets. The lack of PMAA adsorption on the other six surfaces drove the growth along the perpendicular direction of these surfaces, resulting in the radial enhancement of these nanosheets when prolonging reaction time.1 The initial product of NaGdF4 had loose structure comprising layers of nanosheets at the reaction temperature, which branched along with epitaxial growth following the no polymorphism branching mode (Fig. 8b).42,49 The formation of multiarmed structure was also related to the adsorption of PMAA, as the bonding effect of ligand was different among crystal planes of NaGdF4 nanoparticles. And the branched structure could further branched at the end of arms due to the same crystal phase of core and arms.42 As shown in Fig. 8c, NaYF4 seeds formed, aggregated into nano-clusters at the beginning of reaction, and further ripened into nanoparticles under solvothermal condition.


image file: c5ra02217g-f8.tif
Fig. 8 TEM images of products prepared in the presence of 240 mg NaOH for different times (a) LaF3, (b) NaGdF4, (c) NaYF4.

However, due to the thermodynamic unstability of cubic phase NaYF4, small nanoparticles of NaYF4 with cubic phase would transform into large particles which were hexagonal phase NaYF4 according to XRD pattern through Ostwald-ripening (Fig. 7c). And large particles increased when prolonging reaction time.

NaYF4:Yb3+/Tm3+ nanoparticles were chosen to evaluate bioapplication of the as-prepared nano-materials. As surface free carboxyl groups enabled nanoparticles to further bind other molecules such as anticancer drugs, their amounts were obviously associated with weight loss of these as-obtained products, i.e. higher weight loss indicated larger amounts of free carboxyl groups. In general, abundant free carboxyl groups were required to load more drugs on these nanoparticles. Non-uniform, large nanoparticles were obtained when no NaOH was used in synthesis, although there were copious free carboxyl groups on the surface. Therefore, nanoparticles prepared with 240 mg NaOH were chosen as the drug carrier owing to suitable size (100 nm), which could be easily internalized into cells.38,50

The morphology and dispersibility of CDDP-loaded NaYF4:Yb3+/Tm3+ nanoparticles were observed by TEM. The morphology of NaYF4–CDDP composite was the same as that of NaYF4:Yb3+/Tm3+ nanoparticles, and they were well dispersed without aggregation (Fig. S6). As evidenced by the energy-dispersive X-ray spectrum (Fig. S7) of NaYF4–CDDP, Pt existed in the composite, suggesting that CDDP was successfully loaded onto the NaYF4:Yb3+/Tm3+ nanoparticles. Besides, Na, F, Y, Yb, Tm, C and O peaks could also be discerned. The loading manner of CDDP in NaYF4:Yb3+/Tm3+ nanoparticles were studied by XPS. As shown in Fig. 9, the photoelectron peaks of Y3d, Yb4d, C1s, O1s, F1s and Na1s are located at 158.5, 173.6, 287.9, 532.1, 684.4, and 1071.2 eV respectively. Moreover, the photoelectron peak corresponding to Pt4f was detected at 73 eV, which further demonstrated the formation of NaYF4–CDDP composite. The close-up view of Pt4f region (inset of Fig. 9) exhibited two peaks at 72.4 and 75.7 eV for Pt4f7/2 and Pt4f5/2 respectively, viz., the binding energy of PtII in Pt–O–C(O)–NaYF4:Yb3+/Tm3+ nanoparticles. Accordingly, CDDP was loaded through Pt–O bond.51,52 The drug loading capacity was calculated by minusing method, and the mass percentage of CDDP in NaYF4–CDDP composite was ca. 6.3%.


image file: c5ra02217g-f9.tif
Fig. 9 XPS spectrum of NaYF4–CDDP. Inset: enlarged spectrum of Pt4f.

The release profile of CDDP from NaYF4–CDDP composite was investigated in PBS (pH = 7.4) and HAc–HAc (pH = 5.5), respectively. Pt contents outside the dialysis bag are given in Table 1. CDDP was released sustainably from both buffers. Similar to a previous study,38 the release of CDDP from NaYF4–CDDP composite in HAc–NaAc (pH = 5.5) buffer was much faster than that in PBS (pH = 7.4), indicating that acidic environment, which resembled the microenvironment of tumor cells, benefited the release of CDDP from the nano-composite.53

Table 1 Pt contents (μg) in dialysis solution determined by ICP-MS at different times and pH values
Solvent (pH) Dialysis time
3 h 6 h 12 h 24 h 48 h 72 h
HAc–NaAc (5.5) 9.04 ± 0.27 17.04 ± 0.20 23.42 ± 0.42 30.31 ± 0.37 40.92 ± 0.46 48.46 ± 0.71
PBS (7.4) 7.99 ± 0.06 15.29 ± 0.13 16.88 ± 0.27 18.31 ± 0.23 23.70 ± 0.32 26.24 ± 0.34


When excited using a 980 nm CW laser, NaYF4:Yb3+/Tm3+ nanoparticles and NaYF4–CDDP composite emitted bright blue lights. Fig. 10 shows the upconversion luminescence spectra of as-prepared NaYF4:Yb3+/Tm3+ nanoparticles and NaYF4–CDDP composite excited at room temperature. There were two ultraviolet peaks and two visible peaks. Emission peaks at ∼347, ∼362, ∼452 and ∼477 nm correspond to the 1I63F4, 1D23H6, 1D23F4 and 1G43H6 transitions in Tm3+, respectively.54 Compared to NaYF4:Yb3+/Tm3+ nanoparticles, the upconversion luminescence intensity of NaYF4–CDDP composite did not change evidently, i.e. the loading of CDDP barely influenced the luminescence property. As a result, uptake of NaYF4–CDDP composite by cells could be monitored by detecting the upconversion luminescence of NaYF4:Yb3+/Tm3+ nanoparticles.


image file: c5ra02217g-f10.tif
Fig. 10 Upconversion luminescence spectra of NaYF4:Yb3+/Tm3+ and NaYF4–CDDP composite excited by a 980 nm CW laser.

Nanoparticles can be internalized by cancer cells through endocytosis.55 HeLa cells were used to monitor the cellular uptake process of NaYF4–CDDP. HeLa cells incubated with the composite for different times were examined by microscopy equipped with a 980 nm CW laser. Only a few NaYF4–CDDP composites were subjected to uptake by HeLa cells after being incubated for 3 h (Fig. 11a). The blue light was intensified when the incubation was prolonged to 12 h (Fig. 11b), indicating that more NaYF4–CDDP was internalized and accumulated in the cytoplasm. Since intense blue light was detected in the cytoplasm after 24 h of incubation (Fig. 11c), much more composites were internalized into the cells with extended incubation time. In other words, the as-prepared NaYF4–CDDP composite was internalized into cells slowly and time-dependently.


image file: c5ra02217g-f11.tif
Fig. 11 Upconversion luminescence images of HeLa cells stained with 400 μg mL−1 NaYF4–CDDP composite at 37 °C for (a) 3 h, (b) 12 h and (c) 24 h on the left, bright field images in the middle, and merged bright field and upconversion luminescence images on the right.

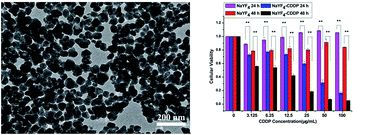
By using MTT assays, the antitumor capacity of NaYF4–CDDP composite was tested against HeLa cells (Fig. 12a) and MCF-7 cells (Fig. 12b) with as-prepared NaYF4:Yb3+/Tm3+ nanoparticles as references. NaYF4:Yb3+/Tm3+ nanoparticles exhibited low cytotoxicity against cancer cells because over 80% of the cells survived even after incubation with high-concentration of them for 48 h. Compared with CDDP-free nanoparticles, NaYF4–CDDP composite exerted more remarkable inhibitory effects on these cells. The half-maximal inhibitory concentrations (IC50) of the composite against HeLa cells were 33.6 μg mL−1 and 8.36 μg mL−1 after 24 h and 48 h of incubation respectively, and they were 87.6 μg mL−1 and 21.7 μg mL−1 toward MCF-7 cells. The IC50 values of CDDP against HeLa cells were 5.12 μg mL−1 and 2.09 μg mL−1 at 24 h and 48 h, respectively, and they were 9.20 μg mL−1 and 2.31 μg mL−1 toward MCF-7 cells (Fig. 12c and d). The cytotoxicity of as-obtained composite was more time-dependent than that of CDDP, probably because the composite needed time to enter cells and released CDDP slowly due to the favorable releasing profile in the acid environment of cancer cells.38,56


image file: c5ra02217g-f12.tif
Fig. 12 Cytotoxicity of NaYF4:Yb3+/Tm3+ nanoparticles and NaYF4–CDDP against HeLa (a) and MCF-7 (b) cancer cell lines at 24 and 48 h, respectively, with cytotoxicity of CDDP against HeLa (c) and MCF-7 (d) as the reference (*P < 0.05, **P < 0.01).

The as-prepared NaYF4:Yb3+/Tm3+ nanoparticles, which were highly biocompatible and hydrophilic, were tested for possible application in cell imaging. HeLa cells were incubated with 400 μg mL−1 NaYF4:Yb3+/Tm3+ nanoparticles for 12 h or 24 h. Incubation for 12 h only gave dim blue light in the cells (Fig. S8a), but the upconversion luminescence was enhanced at 24 h (Fig. S8b). In other words, more NaYF4:Yb3+/Tm3+ nanoparticles entered the cells with extended incubation time. Accordingly, the as-produced NaYF4:Yb3+/Tm3+ nanoparticles were suitable for cell imaging in vitro.

Conclusions

In summary, we herein reported a facile method for preparation of carboxyl polymer-coated NaYF4:Yb3+/Tm3+ nanoparticles and other rare-earth doped fluorides nano-materials. The carboxyl group of NaYF4:Yb3+/Tm3+ nanoparticles produced by polymerization of MAA rendered them hydrophilic, and bound CDDP in the form of Pt–O bond. Cytotoxicity assay of NaYF4–CDDP demonstrated that these as-prepared composites could deliver CDDP and kill cancer cells. NaYF4:Yb3+/Tm3+ nanoparticles were also successfully applied in upconversion luminescence imaging. Therefore, the as-prepared NaYF4:Yb3+/Tm3+ nanoparticles are feasibly applicable to simultaneous drug delivery and cell imaging.

Acknowledgements

This work is supported by the National Basic Research Program of China (2013CB922102) and the National Natural Science Foundation of China (21275072, 21201101 and 21475059).

Notes and references

  1. Z. M. Chen, Z. R. Geng, M. L. Shi, Z. H. Liu and Z. L. Wang, CrystEngComm, 2009, 11, 1591 RSC.
  2. D. M. Yang, G. G. Li, X. J. Kang, Z. Y. Cheng, P. A. Ma, C. Peng, H. Z. Lian, C. X. Li and J. Lin, Nanoscale, 2012, 4, 3450 RSC.
  3. S. Heer, K. Kömpe, H. U. Güdel and M. Haase, Adv. Mater., 2004, 16, 2102 CrossRef CAS PubMed.
  4. F. Wang and X. G. Liu, Chem. Soc. Rev., 2009, 38, 976 RSC.
  5. S. L. Smitha, K. M. Nissamudeen, D. Philip and K. G. Gopchandran, Spectrochim. Acta, Part A, 2008, 71, 186 CrossRef CAS PubMed.
  6. Y. B. Song, S. J. Zhu and B. Yang, RSC Adv., 2014, 4, 27184 RSC.
  7. L. Y. Chen, C. W. Wang, Z. Q. Yuan and H. T. Chang, Anal. Chem., 2015, 87, 216 CrossRef CAS PubMed.
  8. M. M. Madathil, C. Bhattacharya, Z. Q. Yu, R. Paul, M. J. Rishel and S. M. Hecht, Biochemistry, 2014, 53, 6800 CrossRef CAS PubMed.
  9. K. Joo, Y. Fang, Y. Liu, L. Xiao, Z. Gu, A. Tai, C. L. Lee, Y. Tang and P. Wang, ACS Nano, 2011, 5, 3523 CrossRef CAS PubMed.
  10. Z. Q. Yu, R. M. Schmaltz, T. C. Bozeman, R. Paul, M. J. Rishel, K. S. Tsosie and S. M. Hecht, J. Am. Chem. Soc., 2013, 135, 2883 CrossRef CAS PubMed.
  11. Z. G. Chen, H. L. Chen, H. Hu, M. X. Yu, F. Y. Li, Q. Zhang, Z. G. Zhou, T. Yi and C. H. Huang, J. Am. Chem. Soc., 2008, 130, 3023 CrossRef CAS PubMed.
  12. M. Nyk, R. Kumar, T. Y. Ohulchanskyy, E. J. Bergey and P. N. Prasad, Nano Lett., 2008, 8, 3834 CrossRef CAS PubMed.
  13. M. Haase and H. Schäfer, Angew. Chem., Int. Ed., 2011, 50, 5808 CrossRef CAS PubMed.
  14. G. Chen, T. Y. Ohulchanskyy, S. Liu, W. C. Law, F. Wu, M. T. Swihart, H. Ågren and P. N. Prasad, ACS Nano, 2012, 6, 2969 CrossRef CAS PubMed.
  15. H. H. Gorris, R. Ali, S. M. Saleh and O. S. Wolfbeis, Adv. Mater., 2011, 23, 1652 CrossRef CAS PubMed.
  16. F. Han, Z. P. Guan, T. S. Tan and Q. H. Xu, ACS Appl. Mater. Interfaces, 2012, 4, 4746 CAS.
  17. G. S. Yi and G. M. Chow, Adv. Funct. Mater., 2006, 16, 2324 CrossRef CAS PubMed.
  18. C. B. Dong, Z. J. Yan, J. Kokx, D. B. Chrisey and C. Z. Dinu, Appl. Surf. Sci., 2012, 258, 9218 CrossRef CAS PubMed.
  19. C. B. Dong, R. Eldawud, L. M. Sargent, M. L. Kashon, D. Lowry, Y. Rojanasakul and C. Z. Dinu, Environ. Sci., 2014, 1, 595 CAS.
  20. L. Cheng, C. Wang, L. Z. Feng, K. Yang and Z. Liu, Chem. Rev., 2014, 114, 10869 CrossRef CAS PubMed.
  21. Q. X. Mu, G. B. Jiang, L. X. Chen, H. Y. Zhou, D. Fourches, A. Tropsha and B. Yan, Chem. Rev., 2014, 114, 7740 CrossRef CAS PubMed.
  22. L. Y. Wang and Y. D. Li, Chem. Commun., 2006, 2557 RSC.
  23. L. X. Xie, Y. Qin and H. Y. Chen, Anal. Chem., 2013, 85, 2617 CrossRef CAS PubMed.
  24. M. Wang, C. C. Mi, W. X. Wang, C. H. Liu, Y. F. Wu, Z. R. Xu, C. B. Mao and S. K. Xu, ACS Nano, 2009, 3, 1580 CrossRef CAS PubMed.
  25. C. Wang, L. Cheng and Z. Liu, Biomaterials, 2011, 32, 1110 CrossRef CAS PubMed.
  26. J. N. Liu, W. B. Bu, L. M. Pan, S. J. Zhang, F. Chen, L. P. Zhou, K. L. Zhao, W. J. Peng and J. L. Shi, Biomaterials, 2012, 33, 7282 CrossRef CAS PubMed.
  27. R. Naccache, F. Vetrone, V. Mahalingam, L. A. Cuccia and J. A. Capobianco, Chem. Mater., 2009, 21, 717 CrossRef CAS.
  28. Z. Wang, C. H. Liu, L. J. Chang and Z. P. Li, J. Mater. Chem., 2012, 22, 12186 RSC.
  29. L. Y. Wang, Y. Zhang and Y. Y. Zhu, Nano Res., 2010, 3, 317 CrossRef CAS.
  30. M. Wang, C. C. Mi, J. L. Liu, X. L. Wu, Y. X. Zhang, W. Hou, F. Li and S. K. Sun, J. Alloys Compd., 2009, 485, L24 CrossRef CAS PubMed.
  31. X. J. Wu, Q. B. Zhang, X. Wang, H. Yang and Y. M. Zhu, Eur. J. Inorg. Chem., 2011, 13, 2158 CrossRef PubMed.
  32. F. Wang, D. Banerjee, Y. S. Liu, X. Y. Chen and X. G. Liu, Analyst, 2010, 135, 1839 RSC.
  33. J. Zhou, M. X. Yu, Y. Sun, X. Z. Zhang, X. J. Zhu, Z. H. Wu, D. M. Wu and F. Y. Li, Biomaterials, 2011, 32, 1148 CrossRef CAS PubMed.
  34. G. S. Yi and G. M. Chow, Chem. Mater., 2007, 19, 341 CrossRef CAS.
  35. H. Xu, L. Cheng, C. Wang, X. X. Ma, Y. G. Li and Z. Liu, Biomaterials, 2011, 32, 9364 CrossRef CAS PubMed.
  36. Y. L. Dai, P. A. Ma, Z. Y. Cheng, X. J. Kang, X. Zhang, Z. Y. Hou, C. X. Li, D. M. Yang, X. F. Zhai and J. Lin, ACS Nano, 2012, 6, 3327 CrossRef CAS PubMed.
  37. L. Li, C. Liu, L. Y. Zhang, T. T. Wang, H. Yu, C. Q. Wang and Z. M. Su, Nanoscale, 2013, 5, 2249 RSC.
  38. J. Z. Wang, X. Y. Wang, Y. J. Song, J. Wang, C. L. Zhang, C. J. Chang, J. Yan, L. Qiu, M. M. Wu and Z. J. Guo, Chem. Sci., 2013, 4, 2605 RSC.
  39. Y. Wei, F. Q. Lu, X. R. Zhang and D. P. Chen, Chem. Mater., 2006, 18, 5733 CrossRef CAS.
  40. X. W. Lou, Y. Wang, C. L. Yuan, J. Y. Lee and L. A. Archer, Adv. Mater., 2006, 18, 2325 CrossRef CAS PubMed.
  41. I. Rintoul and C. Wandrey, Polymer, 2005, 46, 4525 CrossRef CAS PubMed.
  42. X. Liang, X. Wang, J. Zhuang, Q. Peng and Y. D. Li, Inorg. Chem., 2007, 46, 6050 CrossRef CAS PubMed.
  43. F. Wang, Y. Han, C. S. Lim, Y. H. Lu, J. Wang, J. Xu, H. Y. Chen, C. Zhang, M. H. Hong and X. G. Liu, Nature, 2010, 463, 1061 CrossRef CAS PubMed.
  44. Z. Wang, C. H. Liu, Y. C. Wang and Z. P. Li, J. Alloys Compd., 2011, 509, 1964 CrossRef CAS PubMed.
  45. J. H. Zeng, Z. H. Li, J. Su, L. Y. Wang, R. X. Yan and Y. D. Li, Nanotechnology, 2006, 17, 3549 CrossRef CAS PubMed.
  46. S. L. Gai, G. X. Yang, X. B. Li, C. X. Li, Y. L. Dai, F. He and P. P. Yang, Dalton Trans., 2012, 41, 11716 RSC.
  47. R. E. Thoma, H. Insley and G. M. Hebert, Inorg. Chem., 1966, 5, 1222 CrossRef CAS.
  48. H. X. Mai, Y. W. Zhang, R. Si, Z. G. Yan, L. D. Sun, L. P. You and C. H. Yan, J. Am. Chem. Soc., 2006, 128, 6426 CrossRef CAS PubMed.
  49. S. Chen, Z. L. Wang, J. Ballto, S. H. Foulger and D. L. Carroll, J. Am. Chem. Soc., 2003, 125, 16186 CrossRef CAS PubMed.
  50. H. Kato, Nat. Nanotechnol., 2011, 6, 139 CrossRef CAS PubMed.
  51. R. M. Xing, X. Y. Wang, C. L. Zhang, J. Z. Wang, Y. M. Zhang, Y. Song and Z. J. Guo, J. Mater. Chem., 2011, 21, 11142 RSC.
  52. T. C. Deivaraj, W. X. Chen and J. Y. Lee, J. Mater. Chem., 2003, 13, 2555 RSC.
  53. I. F. Tannock and D. Rotin, Cancer Res., 1989, 49, 4373 CAS.
  54. F. Shi, J. S. Wang, X. S. Zhai, D. Zhao and W. P. Qin, CrystEngComm, 2011, 13, 3782 RSC.
  55. M. N. Moore, Environ. Int., 2006, 32, 967 CrossRef CAS PubMed.
  56. R. Haag and F. Kratz, Angew. Chem., Int. Ed., 2006, 45, 1198 CrossRef CAS PubMed.

Footnote

Electronic supplementary information (ESI) available: ESI-MS results of solute in supernatant from production prepared with different amounts of NaOH, MAA monomer, and solute in supernatant with and without rare-earth ions, TEM image of UCNPs–CDDP composite, ESI-MS result of solute in supernatant from reaction system for NaGdF4:Yb3+/Er3+ preparation, IR spectrum of NaGdF4:Yb3+/Er3+, TEM image of NaGdF4:Yb3+/Er3+. See DOI: 10.1039/c5ra02217g

This journal is © The Royal Society of Chemistry 2015
Click here to see how this site uses Cookies. View our privacy policy here.