Electronic structure and thermoelectric properties of the Zintl compounds Sr5Al2Sb6 and Ca5Al2Sb6: first-principles study

Lingyun Ye, Yuan Xu Wang*, Jueming Yang, Yuli Yan, Jihua Zhang, Libin Guo and Zhenzhen Feng
Institute for Computational Materials Science, School of Physics and Electronics, Henan University, Kaifeng 475004, People’s Republic of China. E-mail: wangyx@henu.edu.cn

Received 2nd February 2015 , Accepted 8th May 2015

First published on 8th May 2015


Abstract

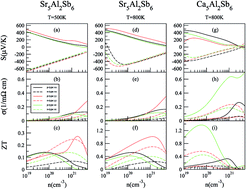
Previous experimental work showed that Zn-doping only slightly increased the carrier concentration of Sr5Al2Sb6 and the electrical conductivity improved barely, which is very different from the results of Zn-doping in Ca5Al2Sb6. To understand their different thermoelectric behaviors, we investigated their stability, electronic structure, and thermoelectric properties using first-principles calculations and the semiclassical Boltzmann theory. We found that the low carrier concentration of Zn-doped Sr5Al2Sb6 mainly comes from its high positive formation energy. Moreover, we predict that a high hole concentration can possibly be realized in Sr5Al2Sb6 by Na or Mn doping, due to the negative and low formation energies of Na- and Mn-doped Sr5Al2Sb6, especially for Mn doping (−6.58 eV). For p-type Sr5Al2Sb6, the large effective mass along ΓY induces a large Seebeck coefficient along the y direction, which leads to the good thermoelectric properties along the y direction. For p-type Ca5Al2Sb6, the effective mass along ΓZ is always smaller than those along the other two directions with increasing doping degree, which induces its good thermoelectric properties along the z direction. The analysis of the weight mobility of the two compounds confirms this idea. The calculated band structure shows that Sr5Al2Sb6 has a larger band gap than Ca5Al2Sb6. The relatively small band gap of Ca5Al2Sb6 mainly results from the appearance of a high density-of-states peak around the conduction band bottom, which originates from the Sb–Sb antibonding states in it.


I. Introduction

The thermoelectric energy conversion technology has attracted great attention in the past few years, due to its great potential in averting a global energy crisis. However, widespread application of the conversion technology is limited by the relatively low efficiency of current thermoelectric materials, which is described by its figure of merit, ZT = S2σT/κ, where S is the thermopower or Seebeck coefficient, T is the absolute temperature, σ is the electrical conductivity, and κ is the thermal conductivity.1 Obviously, an ideal thermoelectric material requires a large Seebeck coefficient, high electrical conductivity, and low thermal conductivity. However, S and σ depend oppositely on the carrier concentration.2 Thus, it is difficult to simultaneously obtain large S and σ values. With increasing carrier concentration, the Seebeck coefficient decreases, while the electrical conductivity increases.

Zintl compounds, characterized by covalently bonded anionic substructures which are surrounded by cations, have been suggested to be promising thermoelectric materials and attracted great attention. In Zintl compounds, cations donate their electrons to electronegative anions. As a result of the combination of ionic and covalent bonding, Zintl compounds have a complex crystal structure with a large unit cell, and exhibit an ‘electron crystal–phonon glass’ behavior.3–5 A good thermoelectric performance is often found for doped semiconductors with carrier concentrations from 1019 cm−3 to 1021 cm−3.2 Because the Seebeck coefficient and the electrical conductivity depend oppositely on the carrier concentration, it is necessary to find an optimal carrier concentration to increase the thermoelectric power factor.

Sr5Al2Sb6 has been experimentally synthesized and was found to be a valence-precise Zintl phase compound.6 It has a similar crystal structure to that of Ca5Al2Sb6 which has been proved to be a promising thermoelectric material.7–9 Ca5Al2Sb6 is composed of infinite corner-sharing MSb4 tetrahedra chains, and the chains connect to adjacent ones via covalent Sb–Sb bonds forming a ladder-like structure. Sr5Al2Sb6 is also composed of corner- and edge-sharing MSb4 tetrahedra chains, but the chains are non-linear and oscillate. Moreover, previous experimental work shows that Sr5Al2Sb6 has a lower thermal conductivity (0.53 W mK−1)6 than that of Ca5Al2Sb6 (0.70 W mK−1 (ref. 7)) at 800 K. The experimental ZT value of undoped Sr5Al2Sb6 is only 0.05 at 800 K, due to its low carrier concentration and intrinsic electronic properties.6 The similarities and differences between Sr5Al2Sb6 and Ca5Al2Sb6 motivate the current study on Sr5Al2Sb6.

Previous studies have shown that doping may improve the figure of merit of thermoelectric materials by optimizing their carrier concentration.7,8,10–12 To find an optimal carrier concentration for Sr5Al2Sb6, we studied its electronic structure and thermoelectric properties in this work. The dependence of the Seebeck coefficient, electrical conductivity, and ZT values on the carrier concentration was investigated by the semiclassical Boltzmann theory. Moreover, previous experimental works show that the electrical conductivity of Zn-doped Sr5Al2Sb6 is much smaller than that of Zn-doped Ca5Al2Sb6, which mainly comes from the relatively low carrier concentration of Zn-doped Sr5Al2Sb6. Therefore, it is beneficial to explore the reason for the low carrier concentration of Zn-doped Sr5Al2Sb6. We studied the effect of different element doping on the stability of Sr5Al2Sb6 by calculating the formation energy. It is found that the formation energy of Zn-doped Sr5Al2Sb6 is very high, indicating the low solubility of Zn doping in Sr5Al2Sb6. Na and Mn doping are suggested as good candidates for p-type doping to improve the thermoelectric performance of Sr5Al2Sb6. It is found that the ZT value of Sr5Al2Sb6 can be largely increased by tuning the carrier concentration.

II. Computational detail

The structure of Sr5Al2Sb6 was optimized with the Vienna ab initio simulation package (VASP) based on the density functional theory (DFT).13,14 The exchange-correlation potential was used in the form of the Perdew–Burke–Ernzerhof (PBE) generalized-gradient approximation (GGA). The plane-wave cutoff energy was set to 500 eV, and for the Brillouin-zone integration a 4 × 5 × 4 Monkhorst-Pack special k-point grid was used. The energy convergence criterion was chosen to be 10−6 eV. The Hellmann–Feynman forces on each ion were less than 0.02 eV Å−1.

The electronic structure of Sr5Al2Sb6 was calculated with the full-potential linearized augmented plane waves method,15 which was implemented in WIEN2k.16–18 We also calculated the forces on each atom using WIEN2k and found that the forces on each atom are smaller than 0.02 eV Å−1. The calculated forces are listed in Table S1, ESI. Here, PBE-GGA was used as the exchange-correlation potentials, and the cutoff parameter RmtKmax = 7 (Kmax is the magnitude of the largest k vector and Rmt is the smallest muffin-tin radius) controls the basis-set convergence. The muffin-tin radii were 2.5 a.u. for the Sr, Al, and Sb atoms. Self-consistent calculations were performed with 120 k-points in the irreducible Brillouin zone, and the total energy was converged when the energy difference was less than 0.0001 Ry.

The transport properties of Sr5Al2Sb6 were evaluated by the semiclassical Boltzmann theory, with the constant scattering time approximation implemented in the Boltz-Trap code.19 This approximation is based on a smoothed Fourier interpolation of the bands, and is often applied for metals and degenerately doped semiconductors. In this method, it is supposed that the scattering time determining electrical conductivity does not vary strongly with the energy on the scale of kT. It is also assumed that the band structure near band gap does not change with different doping levels, that is to say the carrier concentration just changes the situation of the chemical potential. In this work, the calculated band gap of Sr5Al2Sb6 was approximately 0.78 eV, which is in agreement with the previously reported experimental value.6

III. Results and discussion

A. Crystal structure and formation energy

Sr5Al2Sb6 is orthorhombic with the space group Pnma. Each primitive cell contains 52 atoms, and there are two, five, and two crystallographically unique Sr, Sb and Al atoms, respectively, as shown in Table 1. The optimized Sr5Al2Sb6 lattice constants are a = 11.9270 Å, b = 10.2246 Å, and c = 13.1086 Å. Fig. 1 shows the optimized crystal structure of Sr5Al2Sb6. For comparison, the crystal structure of Ca5Al2Sb6 is shown in Fig. 2. As seen in Fig. 1, Sr5Al2Sb6 is composed of infinite chains, which are formed from corner and edge sharing AlSb4 tetrahedra and extend along the a-axis, and the chains oscillate back and forth along the c-axis. The Sr atoms are situated between the tetrahedral chains to provide an overall charge balance. A primitive cell of Ca5Al2Sb6 contains 26 atoms, and the simple ladder-like chains are composed of corner sharing AlSb4 tetrahedra. The different structures of Ca5Al2Sb6 and Sr5Al2Sb6 may result from the combination of relatively large cations (Sr) and a small triel element (Al) in Sr5Al2Sb6.6 Within the Zintl formalism, the valence balance of Sr5Al2Sb6 can be understood as follows: each tetrahedrally coordinated aluminium atom has a formal valence of −1, due to its binding to four antimony atoms; the two edge sharing Sb1 atoms, one corner sharing Sb3 atom, and the Sb2 atom have two bonds and can be considered to have a valence of −2; Sb4 and Sb5 are singly-bonded to an Al and Sb2 atom, respectively, thus their valence can be considered as −2. The anionic unit can thus be written as [(Al1−)2(Sb2−)2(Sb1−)4]. Sr2+ ions situate between the chains and provide an overall charge balance. Therefore, Sr5Al2Sb6 can be expressed as (Sr2+)5(Al1−)2(Sb2−)2(Sb1−)4.
Table 1 Numbers of the crystallographically unique Sr, Al, and Sb atoms per primitive cell of Sr5Al2Sb6
Atom Sr1 Sr2 Sr3 Sb1 Sb2
Number 8 8 4 8 4

Atom Sb3 Sb4 Sb5 Al1 Al2
Number 4 4 4 4 4


image file: c5ra02033f-f1.tif
Fig. 1 The optimized orthorhombic structure of Sr5Al2Sb6 with the space group Pnma, formed by non-linear and oscillating chains extending infinitely along the a axis. The Sr, Al, and Sb atoms are shown as small green, red, and blue spheres, respectively. The edge sharing Sb1 and corner sharing Sb3 atoms are all covalently bonded to two Al atoms, the Sb2 atom is covalently bonded to the Al and Sb5 atoms, and Sb5 and Sb4 are covalently bonded to the Sb2 and Al atoms, respectively.

image file: c5ra02033f-f2.tif
Fig. 2 The orthorhombic structure of Ca5Al2Sb6 with the space group Pbam, formed by ladder-like chains extending infinitely along the c-axis. The Ca, Al and Sb atoms are shown as big blue, small red, and small blue spheres, respectively. The corner sharing Sb1 atom is covalently bonded to two Al atoms, the Sb3 atom is covalently bonded to another Sb3 atom, and the Sb1 atom is covalently bonded to an Al atom.

Previous experimental work has shown that the relatively low carrier concentration of Sr5Al2Sb6 leads to its low electrical conductivity, which induces its low thermoelectric performance.6 Zevalkink et al. tried to increase the hole concentration of Sr5Al2Sb6 by Zn2+ doping at Al3+ sites.6 However, the measured carrier concentration of the Zn-doped sample is only slightly higher than that of the undoped sample, suggesting that the attempt to substitute Zn2+ at the Al3+ sites is unsuccessful. This phenomenon can be explained by the formation energy of Zn-doped Sr5Al2Sb6. Inspired by previous studies7,20 on Ca5Al2Sb6 doped with Na1+ at Sr2+ sites and Mn2+ at Al3+ sites, it is believed that different element doping should be tried to increase the hole carrier concentration of Sr5Al2Sb6. In the current work, we calculated the formation energy of Sr5Al2Sb6 with different dopants. The formation energy was estimated using the following equation:

 
Ef = EdopedEundopedEA + EB, (1)
where Edoped and Eundoped are the total energies of Sr5Al2Sb6 with and without doping in their most stable states, respectively. EA and EB are the energies of the dopant and host atoms. Here, only one host atom is substituted by a dopant atom, thus the doping level for Na1+ or K1+ at a Sr2+ site is 0.125, and that of Zn2+ or Mn2+ at an Al3+ site is 0.05. The calculated formation energies are listed in Table 2. It is important to point out that the formation energy of the Zn-doped Sr5Al2Sb6 is 15.80 eV, suggesting that Zn-doping is unsuitable for increasing the hole carrier concentration due to the poor dispersion of Zn in Sr5Al2Sb6. This is in agreement with the experimental result perfectly.6 The calculated formation energies for K- and Na-doping at a Sr site are 5.20 and −3.32 eV, respectively, meaning that the stability of Na-doped Sr5Al2Sb6 is stronger than that of the K-doped one. Thus, Na-doped Sr5Al2Sb6 may be easier to realize and has higher hole concentrations. A possible reason is the smaller atomic radius of Na than that of K. The calculated formation energy for Mn-doping at an Al site is negative: −6.58 eV, which suggests that Mn doping may be easier to realize and results in higher hole concentrations in Sr5Al2Sb6. Thus, we can predict that doped Sr5Al2Sb6 compounds with Na1+ at a Sr2+ site and Mn2+ at an Al3+ site may be synthesized, have high hole carrier concentrations, and correspond to p-type doping.

Table 2 Calculated formation energies of Sr5Al2Sb6 using B atoms to replace A atoms
Doping type A = Sr, B = Na A = Sr, B = K A = Al, B = Zn A = Al, B = Mn
Sr5Al2Sb6 −3.32 5.20 15.80 −6.58


Table 3 Bond distances (Å) between Al and Sb in Ca5Al2Sb6 and Sr5Al2Sb6
Material Bond type and length
Ca5Al2Sb6 Al–Sb1 Al–Sb2 Al–Sb3
2.74 2.70 2.83
Sr5Al2Sb6 Al1–Sb1 Al1–Sb2 Al1–Sb3
2.66 2.73 2.66
Al2–Sb1 Al2–Sb3 Al2–Sb4
2.69 2.76 2.65


B. Electronic structure

Sr5Al2Sb6 has a different crystal structure from that of Ca5Al2Sb6, which leads to a different electronic structure. Because the transport properties of materials are predominantly affected by the electronic structure near the Fermi level, it is reasonable to focus the discussion on the feature of the valence band maximum (VBM) and the conduction band minimum (CBM). Fig. 3 shows the calculated band structures of Sr5Al2Sb6 and Ca5Al2Sb6. As seen in this figure, Sr5Al2Sb6 is a semiconductor with an indirect band gap of 0.78 eV. The VBM of Sr5Al2Sb6 is located at the Γ point, and the CBM is located between the Z and Γ points. Ca5Al2Sb6 is a direct band gap semiconductor with a band gap of 0.53 eV. The VBM and CBM of Ca5Al2Sb6 are both located at the Γ point. Comparing the band structures of Sr5Al2Sb6 and Ca5Al2Sb6, it is obvious that the dispersion of the VBM and CBM of Sr5Al2Sb6 is less than that of the VBM and CBM of Ca5Al2Sb6, indicating a larger Seebeck coefficient and lower conductivity of Sr5Al2Sb6. To understand the anisotropy of the valence bands of Sr5Al2Sb6, we calculated the effective band mass along different directions as follows:
 
image file: c5ra02033f-t1.tif(2)

image file: c5ra02033f-f3.tif
Fig. 3 Band structures of Sr5Al2Sb6 and Ca5Al2Sb6: the high symmetry k points Γ, X, S, R, U, Z, Y, and T in the figure represent the points (0, 0, 0), (0.5, 0, 0), (0.5, 0.5, 0), (0.5, 0.5, 0.5), (0.5, 0, 0.5), (0, 0, 0.5), (0, 0.5, 0), and (0, 0.5, 0.5), respectively.

The calculated effective masses are m*xx = −0.43me (along ΓX), m*yy = −1.04me (along ΓY), and m*zz = −0.39me (along ΓZ). Thus, the absolute value of the effective mass along the y-direction is much larger than those along the x- and z-direction, which will induce a larger Seebeck coefficient along the y-direction. Further discussion on the Seebeck coefficient can be found in section C.

The distribution of the density of states (DOS) plays an important role in studying the electronic structure. The calculated partial DOS, total DOS, and DOS of each type of atom of Sr5Al2Sb6 and Ca5Al2Sb6 are shown in Fig. 4–6, respectively. As seen in Fig. 4 and 5, the VBM and CBM of Ca5Al2Sb6 are all dominated primarily by Sb atoms. For Sr5Al2Sb6, the VBM is also mainly composed of Sb atoms, but the CBM is mainly composed of Sb and Al atoms. According to the DOS values of Sr5Al2Sb6 shown in Fig. 5 and 6, the bonding feature between the Al and Sb atoms appears from −4.5 to −4 eV and from −3.5 to 0 eV, and the corresponding anti-bonding feature appears from 0.8 to 4.5 eV. For Ca5Al2Sb6, Sb–Sb antibonding interactions induce a high DOS peak around −1 eV, as shown in Fig. 6(b). To understand the difference in Al–Sb bonding between the two compounds, we list the bond distances between the Al and Sb atoms in Sr5Al2Sb6 and Ca5Al2Sb6 in Table 3. From this table we can see that the bond distances between the Al and Sb atoms in Sr5Al2Sb6 are shorter than those in Ca5Al2Sb6, suggesting that the Al–Sb covalent bonding in Sr5Al2Sb6 is stronger than that in Ca5Al2Sb6. For Sr5Al2Sb6, the Sb2 atom not only covalently bonds to an Al atom, but also to the Sb5 atom, and the Sb3 atom in Ca5Al2Sb6 also covalently bonds to an Al atom and another Sb3 atom. The bond distance between Sb5 and Sb2 in Sr5Al2Sb6 is 2.88 Å, while the bond distance between two adjacent Sb3 atoms in Ca5Al2Sb6 is 2.84 Å. Hence, the Sb–Sb bonding in Ca5Al2Sb6 may be stronger than that in Sr5Al2Sb6. The reason for the different band gaps can be also analyzed using the DOS near the CBM. As seen from Fig. 6, for Sr5Al2Sb6, all the Sb atoms make a contribution to the VBM and CBM. However, for the CBM of Ca5Al2Sb6, there is a DOS peak of the Sb3 atom. Such a DOS peak arises from the Sb3–Sb3 antibonding states and leads to a smaller band gap of Ca5Al2Sb6 than that of Sr5Al2Sb6.


image file: c5ra02033f-f4.tif
Fig. 4 Partial DOS for Sr5Al2Sb6 and Ca5Al2Sb6. The Fermi level is set at zero.

image file: c5ra02033f-f5.tif
Fig. 5 Total DOS for Sr5Al2Sb6 and Ca5Al2Sb6. The Fermi level is set at zero.

image file: c5ra02033f-f6.tif
Fig. 6 DOS of the Al and Sb atoms for Sr5Al2Sb6 and Ca5Al2Sb6. The Fermi level is set at zero.

To deeply understand the DOS properties, the band-decomposed charge densities of the CBM of Sr5Al2Sb6 and Ca5Al2Sb6 were calculated, and are shown in Fig. 7. From Fig. 7(b), we can see that, for Ca5Al2Sb6, the charge density is mainly distributed around the ‘rungs of the ladder’, which are composed of two covalently bonded Sb3. However, there is little charge density around the Sb1 and Sb2 atoms. This is consistent with the DOS peak of the Sb3 atom for Ca5Al2Sb6 (Fig. 6). For Sr5Al2Sb6, the charge density is mainly distributed near the Sb5 and Sb2 atoms, corresponding to the high DOS of the Sb5 and Sb2 atoms in the conduction band minimum, as shown in Fig. 6(a). The Sb5 and Sb2 atoms are covalently bonded, similar to the Sb3–Sb3 bonds in Ca5Al2Sb6. However, the DOS values of the Sb5 and Sb2 atoms in Sr5Al2Sb6 are much lower than the DOS of the Sb3 atom in Ca5Al2Sb6. A possible reason is that the stronger covalent Al–Sb bond in Sr5Al2Sb6 attracts more electrons and thus decreases the number of electrons in the Sb–Sb covalent bonds in Sr5Al2Sb6. The bond distance between Sb5 and Sb2 in Sr5Al2Sb6 and that between adjacent Sb3 atoms in Ca5Al2Sb6 support this idea.


image file: c5ra02033f-f7.tif
Fig. 7 Band-decomposed charge densities of the conduction band minima of Sr5Al2Sb6 (a) and Ca5Al2Sb6 (b). The isosurface value is set as 0.001.

C. Transport properties

A promising thermoelectric material must have a large Seebeck coefficient, a high electrical conductivity, and a low thermal conductivity. As previously mentioned, Sr5Al2Sb6 has a low thermal conductivity.6 Thus, to enhance the thermoelectric properties of Sr5Al2Sb6, it is an effective method for increasing the thermoelectric power factor (S2σ). However, the Seebeck coefficient and electrical conductivity are strongly coupled via the carrier concentration. Therefore, it is valuable to find an optimal carrier concentration for maximizing ZT of Sr5Al2Sb6. In this work, we simulated the doping effects and calculated the transport properties of Sr5Al2Sb6 as a function of the carrier concentration from 1 × 1019 cm−3 to 5 × 1021 cm−3 at 500 K and 800 K with the semiclassical Boltzmann theory without considering a special dopant type, as shown Fig. 8. For comparison, the transport properties of Ca5Al2Sb6 at 800 K were also calculated with the same method, and are also shown in Fig. 8. From Fig. 8, we can see that Sr5Al2Sb6 has a larger Seebeck coefficient and a lower electrical conductivity than those of Ca5Al2Sb6, corresponding to the previously mentioned results in section B.
image file: c5ra02033f-f8.tif
Fig. 8 Calculated transport properties of Sr5Al2Sb6 and Ca5Al2Sb6 as a function of the carrier concentration from 1 × 1019 cm−3 to 5 × 1021 cm−3.

From Fig. 8(d), we can see that the Seebeck coefficient of Sr5Al2Sb6 is inversely proportional to the carrier concentration. For n-type Sr5Al2Sb6 at 800 K, there is an obvious bipolar effect when the carrier concentration is below 7.4 × 1019 cm−3. It is known that a bipolar effect is unfavorable to the thermoelectric performance and is the consequence of the combined action of two types of carriers which participate in transportation. Thus, to obtain a large Seebeck coefficient, it is necessary to find ways to reduce the bipolar effect. At 500 K, the bipolar effect almost disappears. It is also found that n-type Sr5Al2Sb6 has larger Seebeck coefficients than those of the p-type one at the same carrier concentrations, and the anisotropy of the p-type one is stronger. This can be explained by the DOS effective mass. For a given Fermi energy, the Seebeck coefficient is proportional to the DOS effective mass.21 The DOS effective mass can be written as:

 
m*DOS = (m*xxm*yym*zz)1/3Nv2/3, (3)
where Nv is the band degeneracy, and m*xx, m*yy, and m*zz are the band effective mass components along the three perpendicular directions xx, yy, and zz, respectively. From the calculated band structure, shown in Fig. 3, we can see that the dispersion of the CBM along different directions is small, indicating a large DOS effective mass and corresponding to larger Seebeck coefficients for n-type Sr5Al2Sb6. By contrast, the VBM has a stronger dispersion. Thus, due to the relatively small dispersion of the CBM, the Seebeck coefficient of n-type Sr5Al2Sb6 should be larger than that of the p-type one. The anisotropy of the Seebeck coefficient in p-type Sr5Al2Sb6 can be explained by the different effective masses along different directions. Our calculated effective mass along the y-direction is much larger than those along the other two directions. Consequently, the Seebeck coefficient along the y-direction should be larger than those along the other two directions.

The electrical conductivity of Sr5Al2Sb6 as a function of the carrier concentration was calculated and plotted in Fig. 8(e). The relationship between electrical conductivity and carrier concentration is shown as:22

 
image file: c5ra02033f-t2.tif(4)
 
image file: c5ra02033f-t3.tif(5)
where m* is the band effective mass of a single valley. From eqn (4), we can see that the electrical conductivity is proportional to the carrier concentration, which explains the change of σ with increasing n in Fig. 8(e). However, the calculated image file: c5ra02033f-t4.tif includes the scattering rate τ−1. Here, we used a semi-empirical method to take off τ and get the value of σ. By comparing the experimental σ and our calculated image file: c5ra02033f-t5.tif values at the same temperature and carrier concentration, we can obtain τ. The experimental data of the electrical conductivity and carrier concentration are taken from ref. 6. As shown in ref. 6, for Sr5Al2Sb6 at 800 K, σ = 943 Ω−1 m−1 and n = 1.2 × 1019 cm−3. Our calculated value of image file: c5ra02033f-t6.tif at the same carrier concentration and temperature is 7.6 × 10¹⁶ Ω−1 m−1 s−1. Thus, we can get τ = 1.24 × 10⁻¹⁴ s for Sr5Al2Sb6 at 800 K. For the doping dependence, there is a standard electron–phonon form, τn−1/3, and within a certain regime there is an approximate electron–phonon T dependence, σT−1.23 Thus, for Sr5Al2Sb6, this yields
 
τ = 2.5 × 10⁻⁵T−1n−1/3 (6)
with τ in s, T in K, and n in cm−3. For T = 800 K, eqn (5) can be written as τ = 2.8 × 10⁻⁸n−1/3. As shown in Fig. 8(e), the electrical conductivities of p-type Sr5Al2Sb6 are apparently higher than those of the n-type one. This may be explained by the relatively large band effective mass of the CBM. According to eqn (4) and (5), σ is inversely proportional to m*: the stronger the dispersion, the smaller the effective mass of a band. From the calculated band structure shown in Fig. 3, we can see that the dispersion of the valence band is obviously stronger than that of the conduction band, therefore the electrical conductivity of p-type Sr5Al2Sb6 should be higher. For p-type Sr5Al2Sb6, the electrical conductivity along the y-direction decreases at first and then increases, due to the change of band effective mass with the change of doping degree. As it is known that the Fermi level will shift down with increasing p-type doping degree, from the band structures shown in Fig. 3 we can see that, for Sr5Al2Sb6, the band effective mass along ΓY is larger than those along the other two directions at VBM, as previously mentioned. Thus, the electrical conductivity of lightly doped p-type Sr5Al2Sb6 along the y direction is lower than those along the other two directions. However, when the carrier concentration is 1.26 × 1021 cm n−3, the doping degree is heavy, and the Fermi level shifts down. When the Fermi level shifts to around −0.25 eV, the calculated band effective masses are: m*xx = −3.67me, m*yy = −0.14me, and m*zz = 10.36me. Thus, the electrical conductivity of p-type Sr5Al2Sb6 along the y-direction becomes the highest. For Ca5Al2Sb6, the calculated band effective masses at VBM are: m*xx = −2.17me, m*yy = −0.28me, and m*zz = −0.22me, leading to a high electrical conductivity along the z-direction. With the downshift of the Fermi level, the dispersion of the bands along ΓZ is always the strongest, corresponding to the high electrical conductivity of p-type Ca5Al2Sb6 along the z-direction.

The optimal electronic performance of a thermoelectric semiconductor depends primarily on the weighted mobility μw,22,24,25

 
μw = μ(m*DOS/me), (7)
where me is the electron mass. By combining eqn (2), (5), and (7), we can get:
 
image file: c5ra02033f-t7.tif(8)

Thus, the weighted mobility is proportional to the band degeneracy and inversely proportional to the band effective mass. Therefore, the band effective mass and band degeneracy should determine the thermoelectric performance. From the band structures shown in Fig. 3 we can see that, for Sr5Al2Sb6, the band degeneracies of the VBM along the different directions are all 1, but they are different near −0.25 eV. The band degeneracy along ΓY is 2, and those along the ΓX and ΓZ directions are still 1 near −0.25 eV. By considering the band effective mass as discussed above, we can conclude that p-type Sr5Al2Sb6 has promising thermoelectric properties along the y-direction. For Ca5Al2Sb6, the band degeneracies along the different directions are the same with the shift of the Fermi level from VBM to −0.25 eV. Moreover, the band effective mass along ΓZ is always smaller than those along the other two directions. Thus, p-type Ca5Al2Sb6 may have promising thermoelectric properties along the z-direction.

To find an optimal carrier concentration for achieving a high ZT value, we need to study the dependence of ZT on the carrier concentration. However, there are no experimental results on the anisotropy of the lattice thermal conductivity and the anisotropy of the relaxation time for carriers. Thus, in the current study, we do not consider the anisotropies on the thermal conductivity and relaxation time, and we used the experimental thermal conductivity to roughly estimate the ZT values along the different directions as a function of the carrier concentration. For this reason, our predicted ZT value may be slightly different from the experimental ones. Moreover, previous experimentally synthesized samples of Sr5Al2Sb6 and Ca5Al2Sb6 are not crystal and are isotropic. Our predicted ZT values are anisotropic along the different directions. Our predicted ZT results may be helpful to better understand the ZT properties of crystalline samples and find the direction with the highest thermoelectric performance. Fig. 8(f) shows the ZT value of Sr5Al2Sb6, here the thermal conductivity κ was used as the experimental value (0.53 W mK−1).6 From Fig. 8, we can see that p-type Sr5Al2Sb6 along the y-direction has larger Seebeck coefficients and higher conductivities than those along the x- and z-directions. Consequently, at 800 K, the highest ZT value of p-type Sr5Al2Sb6 appears in the y-direction and is 1.01 with a carrier concentration of 1.26 × 1021 cm−3. For Ca5Al2Sb6, at 800 K, the highest ZT value of Ca5Al2Sb6 is 1.37 and appears in p-type doping along the z-direction with a carrier concentration of 6.07 × 1019 cm−3. The reason is that the effective mass of the top of the valence bands along ΓZ in Ca5Al2Sb6 (−0.22me) is very small, which leads to a high electrical conductivity of Ca5Al2Sb6 along this direction. For n-type Sr5Al2Sb6, their ZT values profit from their relatively high Seebeck coefficient, leading to the highest ZT value of 0.70 along the y-direction, corresponding to a carrier concentration of 1.31 × 1021 cm−3. From Fig. 8(f), we can see that p-type Sr5Al2Sb6 may have larger ZT values than those of the n-type one. Considering the influence of the Seebeck coefficient and electrical conductivity on the ZT value, we can see that the high Seebeck coefficient induces the high ZT value of the p-type Sr5Al2Sb6.

IV. Conclusion

Summary, the stability, electronic structures, and transport properties of Sr5Al2Sb6 and Ca5Al2Sb6 were studied by first-principles calculations and the semiclassical Boltzmann theory. The formation energies of several doped Sr5Al2Sb6 compounds were calculated. The result shows that the formation energies of Na-doping at a Sr site and Mn-doping at an Al site are negative. Thus, we propose that Sr5Al2Sb6 doped with Na1+ or Mn2+ is easier to realize and has a higher hole concentration, corresponding to p-type Sr5Al2Sb6. The high positive formation energy of Zn-doped Sr5Al2Sb6 means that it is difficult to achieve a high carrier concentration by Zn-doping, which is in good agreement with the low carrier concentration of Zn-doped Sr5Al2Sb6 determined by experimental work. The simulated doping effect on Sr5Al2Sb6 shows that Sr5Al2Sb6 has a higher Seebeck coefficient and a lower electrical conductivity than those of Ca5Al2Sb6. For Sr5Al2Sb6, the high Seebeck coefficient along the y-direction mainly comes from the large hole effective mass along ΓY. For Ca5Al2Sb6, the always small hole effective mass along the z-direction with increasing doping degree induces a high electrical conductivity along the z-direction, which is helpful for achieving a high thermoelectric performance along this direction. The different band gaps of the two compounds result from their different Sb–Sb interactions.

Acknowledgements

This research was sponsored by the National Natural Science Foundation of China (grant nos U1204112, 51371076), and the Program for Innovative Research Team (in Science and Technology) at the University of Henan Province (grant no. 13IRTSTHN01 7).

References

  1. G. Mahan, B. Sales and J. Sharp, Phys. Today, 2008, 50, 42 CrossRef PubMed.
  2. G. J. Snyder and E. S. Toberer, Nat. Mater., 2008, 7, 105 CrossRef CAS PubMed.
  3. S. M. Kauzlarich, Chemistry, structure, and bonding of Zintl phases and ions, VCH, New York, 1996 Search PubMed.
  4. E. S. Toberer, A. F. May and G. J. Snyder, Chem. Mater., 2009, 22, 624 CrossRef.
  5. S. M. Kauzlarich, S. R. Brown and G. J. Snyder, Dalton Trans., 2007, 2099 RSC.
  6. A. Zevalkink, Y. Takagiwa, K. Kitahara, K. Kimura and G. J. Snyder, Dalton Trans., 2014, 4720 RSC.
  7. E. S. Toberer, A. Zevalkink, N. Crisosto and G. J. Snyder, Adv. Funct. Mater., 2010, 20, 4375 CrossRef CAS PubMed.
  8. A. Zevalkink, E. S. Toberer, T. Bleith, E. Flage-Larsen and G. J. Snyder, J. Appl. Phys., 2011, 110, 013721 CrossRef PubMed.
  9. Y. L. Yan and Y. X. Wang, J. Mater. Chem., 2011, 21, 12497 RSC.
  10. S. I. Johnson, A. Zevalkink and G. J. Snyder, J. Mater. Chem. A, 2013, 1, 4244 CAS.
  11. A. Zevalkink, J. Swallow and G. J. Snyder, Dalton Trans., 2013, 9713 RSC.
  12. A. Zevalkink, E. S. Toberer, W. G. Zeier, E. Flage-Larsen and G. J. Snyder, Energy Environ. Sci., 2011, 4, 510 CAS.
  13. G. Kresse and J. Hafner, Phys. Rev. B: Condens. Matter Mater. Phys., 1993, 47, 558 CrossRef CAS.
  14. G. Kresse and J. Hafner, J. Phys.: Condens. Matter, 1994, 6, 8245 CrossRef CAS.
  15. L. Nordstrom and D. J. Singh, Planewaves, Pseudopotentials, and the LAPW method, Springer, 2006 Search PubMed.
  16. D. Koelling and B. Harmon, J. Phys. C: Solid State Phys., 1977, 10, 3107 CrossRef CAS.
  17. P. Hohenberg and W. Kohn, Phys. Rev., 1964, 136, B864 CrossRef.
  18. P. Blaha, K. Schwarz, G. Madsen, D. Kvasnicka, and J. Luitz, WIEN2k: An Augmented Plane Wave + Local Orbitals Program for Calculating Crystal Properties, Schwarz, Vienna University of Technology, Austria, 2001 Search PubMed.
  19. G. K. Madsen and D. J. Singh, Comput. Phys. Commun., 2006, 175, 67 CrossRef CAS PubMed.
  20. A. Zevalkink, J. Swallow and G. J. Snyder, J. Electron. Mater., 2012, 41, 813 CrossRef CAS PubMed.
  21. M. Cutler, J. Leavy and R. Fitzpatrick, Phys. Rev., 1964, 133, A1143 CrossRef.
  22. H. J. Goldsmid, Thermoelectric refrigeration, Plenum, 1964 Search PubMed.
  23. K. P. Ong, D. J. Singh and P. Wu, Phys. Rev. B: Condens. Matter Mater. Phys., 2011, 83, 115110 CrossRef.
  24. G. Mahan, Solid State Physics, Academic Press, New York, 1998, vol. 51, p. 11 Search PubMed.
  25. G. Slack, New materials and performance limits for thermoelectric cooling, in CRC Handbook of Thermoelectrics, 1995 Search PubMed.

Footnote

Electronic supplementary information (ESI) available. See DOI: 10.1039/c5ra02033f

This journal is © The Royal Society of Chemistry 2015
Click here to see how this site uses Cookies. View our privacy policy here.