Photophysical insights into fullerene–porphyrazine supramolecular interactions in solution

Anamika Raya, Haridas Palb and Sumanta Bhattacharya*a
aDepartment of Chemistry, The University of Burdwan, Golapbag, Burdwan-713 104, West Bengal, India. E-mail: sum_9974@rediffmail.com
bMolecular Photochemistry Section, Radiation & Photochemistry Division, Bhabha Atomic Research Centre, Trombay, Mumbai-400 085, India

Received 1st February 2015 , Accepted 11th March 2015

First published on 12th March 2015


Abstract

This communication reports UV-vis, fluorescence and quantum chemical investigations on the supramolecular interactions of a porphyrazine derivative, namely, 2,7,12,17-tetra-tert-butyl-5,10,15,20-tetraaza-21H,23H-porphine (1) with C60 and C70 in toluene and dichlorobenzene. A synergistic combination of rigidity in the host molecule and a shape-selective binding motif give rise to the strongest binding of C60 with porphyrazine.
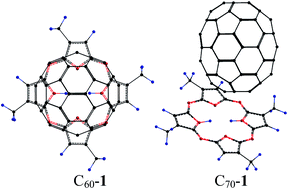

Fullerene-based supramolecular complexes have attracted immense attention in the recent past for the construction of photosynthetic systems and photonic devices.1–7 From the viewpoint of stability of host–guest complexes of fullerene, various host molecules have been designed in the recent past – for example, calixarenes,8,9 crown ethers,10,11 cyclodextrins,12,13 resorcarenes,14,15 cyclotriveratrylene,16 and carbon nanorings.17,18 Bowl-shaped π-conjugated molecules, for example, sumanene,19 are promising host molecules because their concave surface closely resembles fullerene segments and can fit precisely to the convex surface of C60. The interaction of corannulene with C60 is observed in a crystal structure, though it is not supposed to be effective in solution.20 Very recently, phosphorus containing chiral molecules have been designed for fullerene recognition based on concave/convex interactions.21 However, the complexation between fullerene and porphyrin (Fig. 1(a)) proves that concave/convex rationale is not always necessary to manipulate highly stable complex structure.22 As a result of this, various porphyrin host molecules like diporphyrin,23–27 phenothiazine-bridged cyclic porphyrin dimer,28 bisporphyrin,29 porphyrin tetramer,30 porphyrin hexamer,31 porphyrin box,32 a clicked porphyrin cage,33 calixarene diporphyrin,34 JAWS porphyrin23 are designed which exhibits larger value of binding constant (K) with fullerenes in solution compared to concave host molecules listed above. Apart from porphyrin, phthalocyanine (Pc, Fig. 1(b))/fullerene donor/acceptor conjugates have attracted immense attraction in recent past due to their resemblance in the construction of photosynthetic systems and photonic devices.35 The flat π-assembly of Pc shows high binding affinity towards fullerene in solution under the choice of self-assembly protocols.36–38 Like porphyrin and Pc, porphyrazine (Pz, Fig. 1(c)) and fullerene interactions have also been studied. In 1995, Hoffman et al. reported a fullerene and tetracyanoquinodimethane (TCNQ) donor–acceptor crystals of octakis(dimethylamino)porphyrazine.39 Few years later, the same research group reported the synthesis and structures of two donor–acceptor crystals formed from C60 and metallated porphyrazines.40 However, there is no report on binding studies between fullerene and Pz in solution, till date. Herein, we describe spectroscopic and theoretical insights on supramolecular association of 2,7,12,17-tetra-tert-butyl-5,10,15,20-tetraaza-21H,23H-porphine (1, Fig. 1(d)) with C60 and C70 in solvents having varying polarity. The fullerene–Pz association is proposed to be attractive and structure-defining.
image file: c5ra02003d-f1.tif
Fig. 1 Structure of various tetrapyrrole macrocycles along with 1, namely, (a) porphyrin, (b) phthalocyanine, (c) porphyrazine and (d) 1.

The Pz, namely, 1 and fullerenes (C60 & C70) are obtained from Aldrich, USA and used without any further purifications. The solvents, namely, toluene and 1,2-dichlorobenzene (DCB) are of UV-vis spectroscopic grade and used after proper distillation. Evidence in favor of interactions between fullerenes and 1 first comes from UV-vis spectroscopic measurements. Addition of 1 to C70 in DCB causes appearance of additional absorption peak in the visible region. This observation is a good fingerprint in favor of complexation between fullerenes and 1, leading us to postulate electronic interactions between these two chromophores, in the ground state. Identification of the charge transfer (CT) spectra in the UV-vis spectroscopic experiment of fullerene–1 complexes is quite interesting as this may be the first example to track the CT behaviour in solution for such complexation process. Fig. 2 nicely demonstrates the colour changes for various CT complexes of 1 with different electron acceptors, i.e., o-chloranil, p-chloranil, tetracyanoethylene (TCNE), 2,3-dichloro-5,6-dicyano-p-benzoquinone (DDQ) and C70 in comparison to pristine 1 and C70. No significant colour change is noticed for C601 complex in DCB. Fig. 3 shows the electronic absorption spectra of 1 and mixtures containing 1 + C70, 1 + TCNE, 1 + o-chloranil and 1 + DDQ, in DCB. Fig. S1 (in ESI) shows the electronic absorption spectra of remaining mixture containing 1 with p-chloranil in DCB. It should be mentioned at this point that high dielectric constant value of DCB (ε = 9.98) induces CT character as we failed to detect such absorption bands in toluene (ε = 2.39). Moreover, the solubility of fullerene, i.e., C60 in toluene and DCB are estimated to be 2.8 and 27 mg mL−1, respectively.41 Therefore, solvent polarity associated with solvophobic effect are very much responsible behind CT interaction between fullerene and porphyrazine measured in DCB.42 The CT absorption spectra have been analyzed by fitting to the Gaussian function y = y0 + [A/w√(π/2)]exp[−2(xxc)2/w2], where x and y denote wavelength and absorbance, respectively. The wavelengths at these new absorption maxima (λmax = xc) and the corresponding CT transition energies (CT) are summarized in Table 1. CT transition energies of these complexes are related to the vertical electron affinity (EvA) of the electron acceptors by the relation, 2C1 + CT = (1/IvD)C1(C1 + CT) + {(C2/IvD) + IvD}.43 The vertical electron affinities of C70, p-chloranil, TCNE, DDQ and o-chloranil are collected from literature.44–47 A plot (Fig. S2, in ESI) of 2C1 + CT versus C1(C1 + CT) for a given donor and various electron acceptors yields a slope of 1/IvD from which the value of 1/IvD is determined to be 7.87 eV. Utilizing the values of C1 and C2, degrees of CT (α) may be calculated as follows: α = (C2/2)/[(IvDEvA + C1)2 + (C2/2)].43,45 The values of α (listed in Table 1) are small and indicate that very little amount of charge transfer occurs in the ground state. Variation of α with the electron affinity of the acceptors is found to be non-linear (Fig. 4). This is quite expected as the model we use here to determine various electronic parameters are based upon interaction of a common donor species with structurally dissimilar electron acceptors. From the CT absorption spectra, we can enumerate the magnitude of the oscillator strength (f). The oscillator strength is estimated using the formula: f = 4.32 × 10⁻⁹εCTdν, where the term, ∫εCTdν denotes the area under the curve of the extinction coefficient of the absorption band in question vs. wavenumber. The observed oscillator strengths of the CT complexes of 1 are summarized in Table 1. The extinction coefficient is related to the transition dipole moment (μEN) by the relationship: μEN = 0.0952(εmaxΔν1/2ν)1/2, where μEN is defined as −eψex(∑ri)ψgdτ. Large value of μEN (Table 1) for C701 complex substantiates the CT character in ground state. Another important physicochemical parameter, namely, resonance energy (RN),48 is estimated for the CT complexes of 1 with different electron acceptors in present work and reported in Table 1. RN is determined according to the equation: εmax = 7.7 × 10⁴/{(CT/RN) − 3.5}. Moderate value of RN for the C701 complex provides very good support in favour of strong electronic interaction between these two species in solution.


image file: c5ra02003d-f2.tif
Fig. 2 Photographs of uncomplexed (a) 1 (2.3 × 10⁻⁵ M) and (b) C70 (7.0 × 10⁻⁵ M) along with CT complexes of 1 (2.3 × 10⁻⁵ M) in presence of (c) C70 (1.8 × 10⁻⁵ M), (d) TCNE (6.5 × 10⁻⁴ M), (e) DDQ (2.2 × 10⁻⁴ M), (f) p-chloranil (1.3 × 10⁻³ M) and (g) o-chloranil (7.0 × 10⁻⁴ M) in DCB.

image file: c5ra02003d-f3.tif
Fig. 3 UV-vis spectral variation of (a) 1 (3.45 × 10⁻⁶ M) in presence of (b) C70 (8.80 × 10⁻⁵ M), (c) TCNE (5.70 × 10⁻⁴ M), (d) DDQ (2.40 × 10⁻⁴ M) and (e) o-chloranil (9.60 × 10⁻⁴ M) solution recorded in DCB. CT spectra obtained by recording the spectra against 1 solution as in reference except C70 for which the solvent is used as reference; temp. 298 K.
Table 1 CT absorption maximum (λCT), CT transition energy (CT), vertical electron affinity of various electron acceptors (EvA), degrees of CT (α), oscillator strength (f), transition dipole strength (μEN), and resonance energy of interaction (RN) for the complexes of 1 with various electron acceptors recorded in DCB (temperature 298 K)
System λCT, nm CT, eV EvA, eV α f μEN,D RN, eV
C701 655 1.88 2.59 0.026 0.038 7.37 0.217
o-Chloranil–1 643 1.92 2.87 0.020 0.020 5.33 0.205
p-Chloranil–1 473 2.62 1.37 0.043 0.033 4.28 0.115
DDQ–1 702 1.76 3.27 0.011 0.0028 1.85 0.022
TCNE–1 638 1.94 3.17 0.014 0.0023 1.71 0.024


image file: c5ra02003d-f4.tif
Fig. 4 Variation of EvA against α for various CT complexes of 1 recorded in DCB at 298 K.

It is observed that both fullerenes and 1 attract each other spontaneously in toluene and DCB as evidenced from steady state fluorescence investigations; fluorescence intensity of 1 diminishes gradually by the addition of varying concentration of C60 and C70 upon excitation at its corresponding Soret (S2 ← S0) absorption peak. The steady state fluorescence titration experiments have been performed at constant concentration of 1. The spectral changes finally reach a plateau, indicating that the fluorescence quenching is induced by the complexation. It should be mentioned at this point that a purely diffusion-driven process is ruled out, on the basis of the applied fullerene concentration. The decrease of the fluorescence intensity of 1 suggests a static quenching event inside the well defined fullerene–1 supramolecular complexes. On the basis of the aforementioned results, we reach the conclusions that, in the fullerene–1 complexes, the fluorescence state of 1 is quenched by the addition of electron-accepting C60 and C70. The binding constant (K) of various fullerene–1 complexes have been determined according to Benesi–Hildebrand (BH) fluorescence type equation49 and reported in Table 2. An excellent correlation factor of 0.99 is observed for all the systems studied in the present work. One typical fluorescence quenching curve for C601 system in toluene along with fluorescence induced curve and BH plot are shown in Fig. 5. Similar sort of fluorescence spectral representations for C601 system in DCB and C701 system in both the solvents are demonstrated in Fig. S3–S5, respectively (in ESI). Noteworthy is that, ZnPc, a structural analogue of 1, is reported to exhibit ∼3.1 times lower magnitude36 of K than that of 1 during complexation with C60 in toluene. However, both 1 and ZnPc exhibit comparable value of K with C70 as reported in Table 2 (i.e., KC701 = 37[thin space (1/6-em)]000 M−1) and literature (i.e., KC70–ZnPc = 25[thin space (1/6-em)]690 M−1).36 It is interesting to note that the increase in magnitude of K led to increase of the fluorescence quenching efficiency. This can be viewed in terms of the fact that the rigidity of 1 introduces tight fixation of C60 compared to C70 unit in fullerene–1 host–guest complex. Table 2 also suggests that C60 always gives larger magnitude of K with 1 in both toluene and DCB in comparison to C70. This is quite unnatural as structural analogue of Pz, i.e., Znporphyrin22,50,51 and ZnPc,36 exhibit stronger binding with C70. As we use the Soret absorption band as our source of excitation wavelength in fluorescence experiment, the second excited singlet state of 1 has been deactivated by the following mechanism:

image file: c5ra02003d-t1.tif

Table 2 Binding constants (K, M−1) determined by steady state fluorescence method, heat of formation (ΔH0f) value estimated in vacuo by HF/3-21G calculations, lifetime of the excited singlet (τs) of 1, rate constant of charge-separation of the excited singlet (ksCS) and quantum yield of charge-separation for the excited singlet (φsCS) for the complexes of 1 with C60 and C70 recorded in toluene (and DCB) at 298 K
System K, M−1 ΔH0f, kcal mol−1 τs, ns ksCS, s−1 φsCS
1 2.86 (2.135)
C601 73[thin space (1/6-em)]000 (44[thin space (1/6-em)]585) −1.090 2.84 (2.05) 2.40 × 10⁶ (1.9 × 10⁷) 0.0068 (0.037)
C701 37[thin space (1/6-em)]000 (27[thin space (1/6-em)]570) −0.660 (end-on) 2.85 (2.11) 4.2 × 10⁵ (5.6 × 10⁶) 0.0015 (0.0126)
−0.100 (side-on)


image file: c5ra02003d-f5.tif
Fig. 5 Steady state fluorescence spectral variation of 1 (2.60 × 10⁻⁶ M) in presence of C60 (7.15 × 10⁻⁶ to 4.60 × 10⁻⁵ M) recorded in toluene at 298 K; the inset of Fig. 5 shows fluorescence induced curve and BH plot. λex = 337 nm; λem = 630 nm.

A similar sort of experimental observations have already been reported by Yin et al.52 and Guldi et al.53 We are very much thankful to one of the learned reviewers for his/her comments, as it creates the opportunity to find out the value of one important photophysical parameter, namely, the Stern–Volmer constants (KSV) for the C601 and C701 systems in steady state fluorescence titration experiments. If we make a plot of F0/F (where F0 and F are the steady state fluorescence intensity of 1 in absence and presence of fullerenes, respectively) vs. concentration of the quencher (here fullerene) at dilute concentration range of the quencher, excellent linear plots are obtained for all the systems studied in present work. However, at higher concentrations of quencher, the plots generate an upward curvature. From the slope of such plots, KSV may be enumerated. The values of KSV for C601 and C701 systems in toluene (and DCB) are estimated to be 69[thin space (1/6-em)]620 M−1 (56[thin space (1/6-em)]600 M−1) and 65[thin space (1/6-em)]410 M−1 (51[thin space (1/6-em)]200 M−1), respectively. Typical fluorescence spectral variation for determination of SV plot for C601 system in DCB is shown Fig. 6. SV plots for C601 system in toluene and C701 system in both the solvents are provided as Fig. S6–S8, respectively (in ESI). The bimolecular quenching constant, kq, calculated from the linear segment of the SV plots revealed that the kq values are 3 order of magnitude higher than that expected for diffusion controlled processes in DCB and toluene, respectively. The linear nature of SV plots at dilute concentration range of quencher along with order of magnitude of kq suggest that static type quenching is the main process for quenching of fluorescence of 1 in presence of fullerenes.54,55 The KSV values measured in this manuscript fall into the range between pure diffusion controlled quenching and hydrogen bonding facilitated quenching in solutions where fullerene is a fluorescent quencher as suggested by one of the learned reviewer.56–58 The above results, therefore, provide enough evidences in favour of the complexation between fullerene and 1 in both toluene and DCB.


image file: c5ra02003d-f6.tif
Fig. 6 Steady state fluorescence spectral variation of 1 (2.6 × 10⁻⁶ M) in presence of C60 (1.0 × 10⁻⁶ to 1.4 × 10⁻⁵ M) recorded in DCB at 298 K; the inset of Fig. 6 shows SV plot. λex = 340 nm; λem = 632 nm.

Another interesting aspect of the present investigations is that 1 did not exhibit significant selectivity in binding toward C60 or C70. The selectivities of C60 over C70 are found to be ∼2.0 and 1.6 in toluene and DCB, respectively. Although, the present selectivity ratio of porphyrazine is comparable to that of azacalix[m]arene[n]pyridine (∼1.94),59 it is much lower than those of calixarene diporphyrin (∼4.3),34 cyclic dimers of Zn–porphyrins (∼25.5)60 and corresponding H2–diporphyrin (∼32)61 complexes.

In our present work, a detailed conformational analysis of the individual components as well as the fullerene–1 complexes have been performed in vacuo by HF/3-21G calculations. The geometric parameters of the complexes are obtained after complete energy minimization. To limit the number of basis functions, we have replaced tert-butyl group with methyl in the structure of 1. The strongest binding of C60 towards 1 is reflected in terms of larger negative value of heat of formation (ΔHf°) for this complex compared to C701 estimated in vacuo (Table 2). Comparing the relative stability of C601 and C701 complexes in terms of ΔHf° value (listed in Table 2), it is revealed that C701 complex is supposed to be less stable in side-on orientation of C70 (Fig. S9, in ESI) compared to its end-on orientation (Fig. 7(b)) by 0.560 kcal mol−1. We anticipate that the contact area of 1 with C60 (Fig. 7(a)) would not differ much with respect to that of C70. Estimation of the surface area of the C70 complexes of 1 (side-on) and 1 (end-on) are estimated to be 857.32 and 857.23, Å2, respectively, which is very much close to that of C601 complex, i.e., 836.12 Å2. Thus, unlike fullerene–porphyrin interaction,22 computations of the preferred conformations of fullerene–1 complexes confirm that van der Waals attractive forces play negligible role in present case. The frontier highest occupied molecular orbitals (HOMO) and lowest unoccupied molecular orbitals (LUMO) for the investigated supramolecules have been obtained by DFT/B3LYP/6-31G* method and are demonstrated in Fig. 8 and S10 (in ESI) for C601 and C701 systems, respectively. In the studied systems, the electron distribution of HOMO and LUMO is exclusively found to be located on the 1 entity and fullerene spheroid, respectively. These results suggest weak charge-transfer interaction between 1 and fullerene in the ground state and at the same time, prove the existence of charge-transfer transition from 1 entity to fullerene spheroid. It is also observed that, HOMO of both C601 (−5.5945 eV) and C701 (−5.5964 eV) complexes corroborate fairly well with that of uncomplexed 1 (−5.6013 eV) while LUMO of these complexes, i.e., −3.0820 eV and −3.0912 eV lie very close to that of C60 (−3.1469 eV) and C70 (−3.1427 eV), respectively. The small HOMO–LUMO gap gives formidable support in favour of weak CT from 1 to fullerene as evidenced from low values of α tabulated in Table 1. Molecular electrostatic potential (MEP) maps have also been generated for the investigated supramolecules in present work with the help of DFT calculations and visualized in Fig. 9. Fig. 9 gives strong indication of electronic redistribution in donor (here 1) and acceptor (here fullerene) during non-covalent interaction. It may be mentioned here that validity of molecular orbitals generated by density functional methods is already being recognized.62 The accuracy of these methods, especially B3LYP, is being well demonstrated by D'Souza54 and Schaefer et al.63 and, more recently, on covalently linked C60–Znporphyrin system64 and fullerene-based photoactive layers for the construction of heteroconjugation solar cells.65


image file: c5ra02003d-f7.tif
Fig. 7 Ab initio (HF/3-21G) optimized geometric structures of (a) C601 complexes and (b) C701 (end-on orientation of C70) done in vacuo. The calculations are done using SPARTAN '06 software.

image file: c5ra02003d-f8.tif
Fig. 8 DFT (B3LYP/6-31G*) calculated frontier (a) HOMO and (b) LUMO for the C601 complex done in vacuo. The calculations are done using SPARTAN '14 software.

image file: c5ra02003d-f9.tif
Fig. 9 MEP maps of (a) C601 and (b) C701 (end-on orientation of C70) systems done by DFT (B3LYP/6-31G*) calculations in vacuo. The calculations are done using SPARTAN '14 software.

Evidence in favor of end-on orientation of C70 toward the plane of the 1 gets strong experimental support from variable temperature 13C NMR experiment of C601 (Fig. 10) and C701 systems (Fig. 11) recorded in toluene-d8 medium. The 13C NMR spectra of C60 and C70 shown in Fig. 10 and 11, respectively, are not decoupled. Similar to the case of C60, the 13C NMR signals due to C70 in C701 complex are upfield-shifted from those of uncomplexed C70. Since such an upfield shift is more pronounced for the pole carbon signals than for those located at the equator, C70 appears to adopt an end-on conformation with respect to 1 moiety in order to maximize the host–guest interaction. Both theoretical and experimental observations reveal that such a binding motif of C70 toward 1 takes place to maximize the electrostatic interactions. As shown in Fig. 10, 13C-enriched C60 and 1 in Tol-d8 shows a single resonance for C60 at 298 K due to time-averaging of bound and unbound C60. Upon cooling, this peak gradually broadens and at 243 K, it appears as separate singlet signal corresponding to bound C60 (140.3 ppm) and unbound C60 (142.8 ppm). The upfield shifts of the fullerene in the bound states are the result of ring currents effects of the porphyrazine π-system on the fullerene. Similar sort of observations is noticed by Boyd et al. for calix[4]arene-linked bisporphyrin host for fullerene.66


image file: c5ra02003d-f10.tif
Fig. 10 13C NMR spectrum of C60 in presence of 1 at different temperatures.

image file: c5ra02003d-f11.tif
Fig. 11 13C NMR spectrum of C70 in presence of 1 at different temperatures.

Apart from steady state fluorescence measurements, we have performed detailed nanosecond time-resolved fluorescence experiment for the fullerene–1 systems in toluene and DCB using 374 nm laser pulse. The experiment has been carried out at a fixed concentration of 1. The time-resolved fluorescence measurement shows mono-exponential decay for uncomplexed 1; lifetime value of the singlet excited state (τs) of 1 is measured to be 2.86 (Fig. S11 in ESI) and 2.135 ns (Fig. 12(a)) in toluene and DCB, respectively. When the experiment is carried out in toluene, no significant change in the value of τs is observed for C60 (2.84 ns, Fig. S11 in ESI) and C70 (2.85 ns, Fig. S11 in ESI). However, slight reduction in τs value is observed for 1 in presence of C70 (2.11 ns, Fig. 12(b)) and C60 (2.05 ns, Fig. 12(c)) measured in DCB. Utilizing the value of τs in DCB, rate constant of charge-separation of the excited singlet (ksCS) and quantum yield of charge-separation for the excited singlet (φsCS)67–69 have been evaluated and listed in Table 2. The most fascinating thing is that in DCB, C601 complex exhibits little charge-separation as φsCS value is estimated to be 0.037. The lifetime experiment, therefore, suggests enhancement in electrostatic interaction between 1 and fullerene in solvent having high dielectric constant value. To validate the presence of the static quenching mechanism in our present investigations, we have performed detailed nanosecond time-resolved fluorescence measurements for fullerene–1 complexes in both toluene and DCB. The titration experiment is carried out at a fixed concentration of 1 and a variable concentration of C60 and C70. It is observed that, upon the gradual addition of fullerenes C60 and C70 in toluene (and DCB), the value of τs suffers little change, and mono-exponential decay is followed. Plot of τs/τ vs. concentration of quencher resulting from time-resolved titration experiment for C601 and C701 systems recorded in DCB are shown in Fig. S12(a) & S12(b) respectively (in ESI); here, τs and τ denote the lifetime value of 1 in absence and presence of quencher, respectively. Since the value of τs does not change much in the presence of the quencher, there is no question of observing the lifetime value in another time range like the picosecond or femtosecond region. This important photophysical observation establishes that diffusion controlled mechanism is not operative behind quenching of the fluorescence intensity of 1 in presence of C60 and C70 in both toluene and DCB. Similar sort of observations is noticed when the experiments are performed in toluene. Scanning the emission feature in longer wavelength regions (700–800 nm), it is revealed a weak emission band at 763 nm corresponding to the singlet emission of C60 in DCB (marked as red colour in Fig. 13). The fluorescence intensity of this band for a fixed concentration of C60 is found to remain almost same as that obtained in presence of 1. This result indicates that in DCB, there is a relaxation pathway from the excited singlet state of 1 to that of the C60. Similar sort of observations have been made for C601 system in toluene (Fig. S13) studied in present work.


image file: c5ra02003d-f12.tif
Fig. 12 Time-resolved fluorescence decay profile of (a) 1 (3.0 × 10⁻⁶ M) in presence of (b) C70 (4.30 × 10⁻⁵ M) and (c) C60 (4.05 × 10⁻⁵ M) recorded in DCB at 298 K. Black and green colour lines represent instrument response function and fit to decay, respectively.

image file: c5ra02003d-f13.tif
Fig. 13 Steady state fluorescence spectral variation of C60 (2.0 × 10⁻⁵ M, red colour line) in presence of 1 (2.5 × 10⁻⁶ M, blue colour line) recorded in DCB at 298 K; λex = 340 nm; λem = 763 nm.

In conclusion, 1 has been demonstrated to be good shape-selective host molecule for fullerene guests. The fullerene–1 supramolecular recognition element may find potential application to construct discrete host–guest complexes in near future. Further studies on photophysical characterization and single crystal X-ray analysis of the complexes of porphyrazine with various fullerene derivatives are in progress.

Acknowledgements

Grant-In-Aid through Research Award Sanction no. F. 30-17/2012 (SA-II) supported by UGC, New Delhi is greatly acknowledged.

Notes and references

  1. M. E. El-Khouly, S. Fukuzumi and F. D'Souza, ChemPhysChem, 2014, 15, 30 CrossRef CAS PubMed.
  2. S. Fukuzumi, K. Ohkubo, F. D'Souza and J. L. Sessler, Chem. Commun., 2012, 9801 RSC.
  3. M. E. El-Khouly, C. A. Wijesinghe, M. E. El-Khouly, V. N. Nesterov, M. E. Zandler, S. Fukuzumi and F. D'Souza, Chem.–Eur. J., 2012, 18, 13844 CrossRef CAS PubMed.
  4. R. Chakrabarty, P. S. Mukherjee and P. J. Stang, Chem. Rev., 2011, 111, 6810 CrossRef CAS PubMed.
  5. G. Bottari, G. de la Torre, D. M. Guldi and T. Torres, Chem. Rev., 2010, 110, 6768 CrossRef CAS PubMed.
  6. D. Gonzalez-Rodriguez and G. Bottari, J. Porphyrins Phthalocyanines, 2009, 13, 624 CrossRef CAS.
  7. M. Alvaro, P. Atienzar, P. Cruz, J. L. Delgado, V. Troiani, H. Garcia, F. Langa, A. Palkar and L. Echegoyen, J. Am. Chem. Soc., 2006, 128, 6626 CrossRef CAS PubMed.
  8. S. X. Fa, L. S. Wang, D. X. Wang, L. Zhao and M. X. Wang, J. Org. Chem., 2014, 79, 3559 CrossRef CAS PubMed.
  9. S. Shinkai and A. Ikeda, Gazz. Chim. Ital., 1997, 127, 657 CAS.
  10. F. D'Souza, E. Maligaspe, A. S. D. Sandanayaka, N. K. Subbaiyan, P. A. Karr, T. Hasobe and O. Ito, J. Phys. Chem. A, 2010, 114, 10951 CrossRef PubMed.
  11. B. M. Illescas, J. Santos, M. C. Díaz, N. Martín, C. M. Atienza and D. M. Guldi, Eur. J. Org. Chem., 2007, 2007, 5027 CrossRef.
  12. W. Zhang, X. Gong, C. Liu, Y. Piao, Y. Sun and G. Diao, J. Mater. Chem. B, 2014, 2, 5107 RSC.
  13. T. Braun, Fullerene Sci. Technol., 1997, 5, 615 CrossRef CAS.
  14. O. D. Fox, M. G. B. Drew, E. J. S. Wilkinson and P. D. Beer, Chem. Commun., 2000, 391 RSC.
  15. F. C. Tucci, D. M. Rudkevich and J. Rebek, J. Org. Chem., 1999, 64, 4555 CrossRef CAS.
  16. F. Yang, Q. Chen, Q.-Y. Cheng, C.-G. Yan and B.-H. Han, J. Org. Chem., 2012, 77, 971 CrossRef CAS PubMed.
  17. T. Kawase, K. Tanaka, N. Shiono, Y. Seirai and M. Oda, Angew. Chem., Int. Ed., 2004, 43, 1722 CrossRef CAS PubMed.
  18. T. Kawase, N. Fujiwara, M. Tsutumi, M. Oda, Y. Maeda, T. Wakahara and T. Akasaka, Angew. Chem., Int. Ed., 2004, 43, 5060 CrossRef CAS PubMed.
  19. H. Sakurai, T. Daiko and T. Hirao, Science, 2003, 301, 1878 CrossRef CAS PubMed.
  20. L. T. Scott, M. M. Hashemi and M. S. Bratcher, J. Am. Chem. Soc., 1992, 114, 1920 CrossRef CAS.
  21. M. Yamamura, T. Saito and T. Nabeshima, J. Am. Chem. Soc., 2014, 136, 14299 CrossRef CAS PubMed.
  22. P. D. W. Boyd and C. A. Reed, Acc. Chem. Res., 2005, 38, 235 CrossRef CAS PubMed.
  23. D. Sun, F. S. Tham, C. A. Reed, L. Chaker, M. Burgess and P. D. W. Boyd, J. Am. Chem. Soc., 2000, 122, 10704 CrossRef CAS.
  24. A. Ouchi, K. Tashiro, K. Yamaguchi, T. Tsuchiya, T. Akasaka and T. Aida, Angew. Chem., Int. Ed., 2006, 45, 3542 CrossRef CAS PubMed.
  25. Y. Shoji, K. Tashiro and T. Aida, J. Am. Chem. Soc., 2004, 126, 6570 CrossRef CAS PubMed.
  26. S. Bhattacharya, T. Shimawaki, X. Peng, A. Ashokkumar, S. Aonuma, T. Kimura and N. Komatsu, Chem. Phys. Lett., 2006, 430, 435 CrossRef CAS PubMed.
  27. S. Bhattacharya, K. Tominaga, T. Kimura, H. Uno and N. Komatsu, Chem. Phys. Lett., 2007, 433, 395 CrossRef CAS PubMed.
  28. K. Sakaguchi, T. Kamimura, H. Uno, S. Mori, S. Ozako, H. Nobukuni, M. Ishida and F. Tani, J. Org. Chem., 2014, 79, 2980 CrossRef CAS PubMed.
  29. H. Uno, M. Furukawa, A. Fujimoto, H. Uoyama, H. Watanabe, T. Okujima, H. Yamada, S. Mori, M. Kuramoto, T. Iwamura, N. Hatae, F. Tani and N. Komatsu, J. Porphyrins Phthalocyanines, 2011, 15, 951 CrossRef CAS.
  30. Y. Kubo, A. Sugasaki, M. Ikeda, K. Sugiyasu, K. Sonoda, A. Ikeda, M. Takeuchi and S. Shinkai, Org. Lett., 2002, 4, 925 CrossRef CAS PubMed.
  31. M. Ayabe, A. Ikeda, Y. Kubo, M. Takeuchi and S. Shinkai, Angew. Chem., Int. Ed., 2002, 41, 2790 CrossRef CAS.
  32. D. M. Guldi, T. Da Ros, P. Braiuca, M. Prato and E. Alessio, J. Mater. Chem., 2002, 12, 2001 RSC.
  33. J. Zhang, X. Zheng, R. Jiang, Y. Yu, Y. Li, H. Liu, Q. Li, Z. Shuai and Y. Li, RSC Adv., 2014, 4, 27389 RSC.
  34. M.-X. Wang, X.-H. Zhang and Q.-Y. Zheng, Angew. Chem., Int. Ed., 2004, 43, 838 CrossRef CAS PubMed.
  35. G. Bottari, J. A. Suanzes, O. Trukhina and T. Torres, J. Phys. Chem. Lett., 2011, 2, 905 CrossRef CAS.
  36. A. Ray, D. Goswami, S. Chattopadhyay and S. Bhattacharya, J. Phys. Chem. A, 2008, 112, 11627 CrossRef CAS PubMed.
  37. R. F. Enes, J.-J. Cid, O. Trukhina, A. Hausmann, A. Gouloumis, P. Vázquez, J. A. S. Cavaleiro, A. C. Tomé, D. M. Guldi and T. Torres, Chem.–Eur. J., 2012, 18, 1727 CrossRef CAS PubMed.
  38. C. B. KC, K. Ohkubo, P. A. Karr, S. Fukuzumi and F. D'Souza, Chem. Commun., 2013, 49, 7614 RSC.
  39. D. M. Eichhorn, S. Yang, W. Jarrell, T. F. Baumann, L. S. Beall, A. J. P. White, D. J. Williams, A. G. M. Barrett and B. M. Hoffman, J. Chem. Soc., Chem. Commun., 1995, 1703 RSC.
  40. D. H. Hochmuth, S. L. J. Michel, A. J. P. White, D. J. Williams, A. G. M. Barrett and B. M. Hoffman, Eur. J. Inorg. Chem., 2000, 593 CrossRef CAS.
  41. R. S. Ruoff, D. S. Tse, R. Malhotra and D. C. Lorents, J. Phys. Chem. A, 1993, 97, 3379 CrossRef CAS.
  42. I. S. Molina, M. Ince, G. Bottari, C. G. Clasessens, M. V. Martinez-Diaz and T. Torres, Turk. J. Chem., 2014, 38, 1006 CrossRef PubMed.
  43. R. S. Mulliken, J. Am. Chem. Soc., 1952, 74, 811 CrossRef CAS.
  44. S. Bhattacharya, M. Banerjee and A. K. Mukherjee, Spectrochim. Acta, Part A, 2001, 57, 1463 CrossRef CAS.
  45. R. Foster, Organic Charge Transfer Complexes, Academic Press, New York, 1969, ch. 3 and 13 Search PubMed.
  46. M. E. Peover, J. Chem. Soc., 1962, 4540 RSC.
  47. S. Bhattacharya, M. Banerjee and A. K. Mukherjee, Spectrochim. Acta, Part A, 2001, 57, 2409 CrossRef CAS.
  48. G. Briegleb and J. Czekalla, Z. Phys. Chem., 1960, 24, 37 CrossRef CAS.
  49. H. A. Benesi and J. H. Hildebrand, J. Am. Chem. Soc., 1949, 71, 2703 CrossRef CAS.
  50. S. Mukherjee, A. K. Bauri and S. Bhattacharya, Chem. Phys. Lett., 2010, 500, 128 CrossRef CAS PubMed.
  51. A. Ray, A. Bauri and S. Bhattacharya, Spectrochim. Acta, Part A, 2015, 134, 566 CrossRef CAS PubMed.
  52. G. Yin, D. Xu and Z. Xu, Chem. Phys. Lett., 2002, 365, 232 CrossRef CAS.
  53. D. M. Guldi, T. Da Ros, P. Braiuca and M. Prato, Photochem. Photobiol. Sci., 2003, 2, 1067 CAS.
  54. F. D'Souza, G. R. Deviprasad, M. E. Zandler, V. T. Hoang, A. Klykov, M. V. Stipdonk, A. Perera, M. E. El-Khouly, M. Fuzitsuka and O. Ito, J. Phys. Chem. A, 2002, 106, 3243 CrossRef.
  55. F. D'Spuza and O. Ito, Chem. Commun., 2009, 4913 Search PubMed.
  56. K. Campbell, A. Zappas, U. Bunz, Y. S. Thio and D. G. Bucknall, J. Photochem. Photobiol., A, 2012, 249, 41 CrossRef CAS PubMed.
  57. A. Kathiravan, Synth. Met., 2014, 194, 77 CrossRef CAS PubMed.
  58. F. Li, K. G. Yager, N. M. Dawson, J. Yang, K. J. Malloy and Y. Qin, Macromolecules, 2013, 46, 9021 CrossRef CAS.
  59. C. F. Van Nostrum and R. J. M. Nolte, Chem. Commun., 1996, 2385 RSC.
  60. M. Dudic, P. Lhoták, I. Stibor, H. Petrıícková and K. Lang, New J. Chem., 2004, 28, 85 RSC.
  61. Y. Shoji, K. Tashiro and T. Aida, J. Am. Chem. Soc., 2004, 126, 6570 CrossRef CAS PubMed.
  62. R. Stowasser and R. Hoffmann, J. Am. Chem. Soc., 1999, 121, 3414 CrossRef CAS.
  63. J. C. Rienstra-Kiracofe, C. J. Barden, S. T. Brow and H. F. Schaefer, J. Phys. Chem. A, 2001, 105, 524 CrossRef CAS.
  64. O. Ito and F. D'Souza, Molecules, 2012, 17, 5816 CrossRef CAS PubMed.
  65. Y. Li, D. Qi, P. Song and F. Ma, Materials, 2015, 8, 42 CrossRef PubMed.
  66. A. Hosseini, S. Taylor, G. Accorsi, N. Armaroli, C. A. Reed and P. D. W. Boyd, J. Am. Chem. Soc., 2006, 128, 15903 CrossRef CAS PubMed.
  67. F. D'Souza, R. Chitta, S. Gadde, M. E. Zandler, A. L. McCarty, A. S. D. Sandanayaka, Y. Araki and O. Ito, Chem.–Eur. J., 2005, 11, 4416 CrossRef PubMed.
  68. A. Ray, K. Santhosh, S. Chattopadhyay, A. Samanta and S. Bhattacharya, J. Phys. Chem. A, 2010, 114, 5544 CrossRef CAS PubMed.
  69. A. Ray, K. Santhosh and S. Bhattacharya, J. Phys. Chem. B, 2012, 116, 11979 CrossRef CAS PubMed.

Footnotes

The authors wish to dedicate this work to Late Mr S. B. Banerjee for his constant encouragement in pursuing research work.
Electronic supplementary information (ESI) available: CT analysis of p-chloranil–1 complex in DCB (Fig. S1), plot for determination of IvD of 1 (Fig. S2), steady state fluorescence spectra, induced curves and BH plots for the determination of the binding constants of 1 with C60 and C70 in different solvents (Fig. S3–S5), steady state fluorescence spectral variation for the determinations of SV constants for C601 complex in toluene (Fig. S6) and C701 complex in toluene (Fig. S7) and DCB (Fig. S8), optimized structure of C701 complex at side-on orientation of C70 (Fig. S9), B3LYP/6-31G* optimized electronic, i.e., HOMO and LUMO, structure of C701 system in end-on orientation of C70 (Fig. S10), decay profile of 1 in absence and presence of C60 and C70 recorded in toluene (Fig. S11), plot of τs/τ vs. concentration of quencher for C601 and C701 systems measured in DCB (Fig. S12), and finally, fluorescence spectral variation of C60 in presence of 1 recorded in toluene (Fig. S13). See DOI: 10.1039/c5ra02003d

This journal is © The Royal Society of Chemistry 2015